
The use of e-commerce has been on the increase for several years now. The francenum.gouv.fr statistics confirm the increasing adoption of this mode of consumption. UNCTAD (United Nations Trade & Development) also offers some figures on online commerce (in particular, a 60% growth in sales since 2016): https://unctad.org/publication/digital-economy-report-2024 [EN]
This leads to ever greater consumption of resources in order to satisfy our demands as e-consumers. The environmental impact of the ‘physical’ side of the equation (product manufacture, delivery, returns, etc.) is increasingly well documented. As early as 2020, we wanted to look at the impact of the digital services we use. At the time, Greenspector was already proposing e-commerce articles and its environmental impacts. More recently, we have been looking at mobile applications used to make online purchases (from 2022).
Datareportal provides some interesting statistics on this subject for 2024 :
This year we decided to take a closer look at websites, as they are used on all types of device. This has made it easier for us to measure journeys that are more representative of those of e-consumers. To do this, we start with a classification of these sites, then measure them, assess their environmental impact and try to propose a more global vision of areas for improvement.
We took advantage of the sales period, which sees an increase in purchases but also, very often, an increase in the number of elements on websites (banners, etc.) aimed at attracting the attention of e-consumers.
For a broader perspective on online shopping, I recommend Laurence Roger’s article: https://les-enovateurs.com/acheter-en-ligne-ou-boutique-pas-exactement-pareil
The list of the main e-commerce sites, ranked by traffic in France in 2024, is as follows : https://www.observatoire-ecn.fr/demo/listing
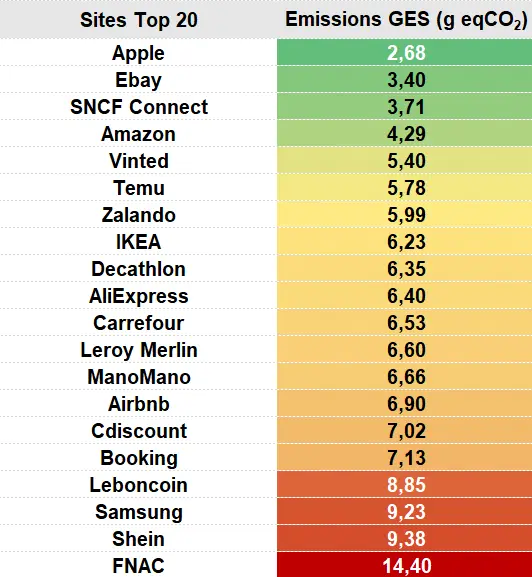
The sites are ranked from least to most impacting (in terms of greenhouse gas emissions):
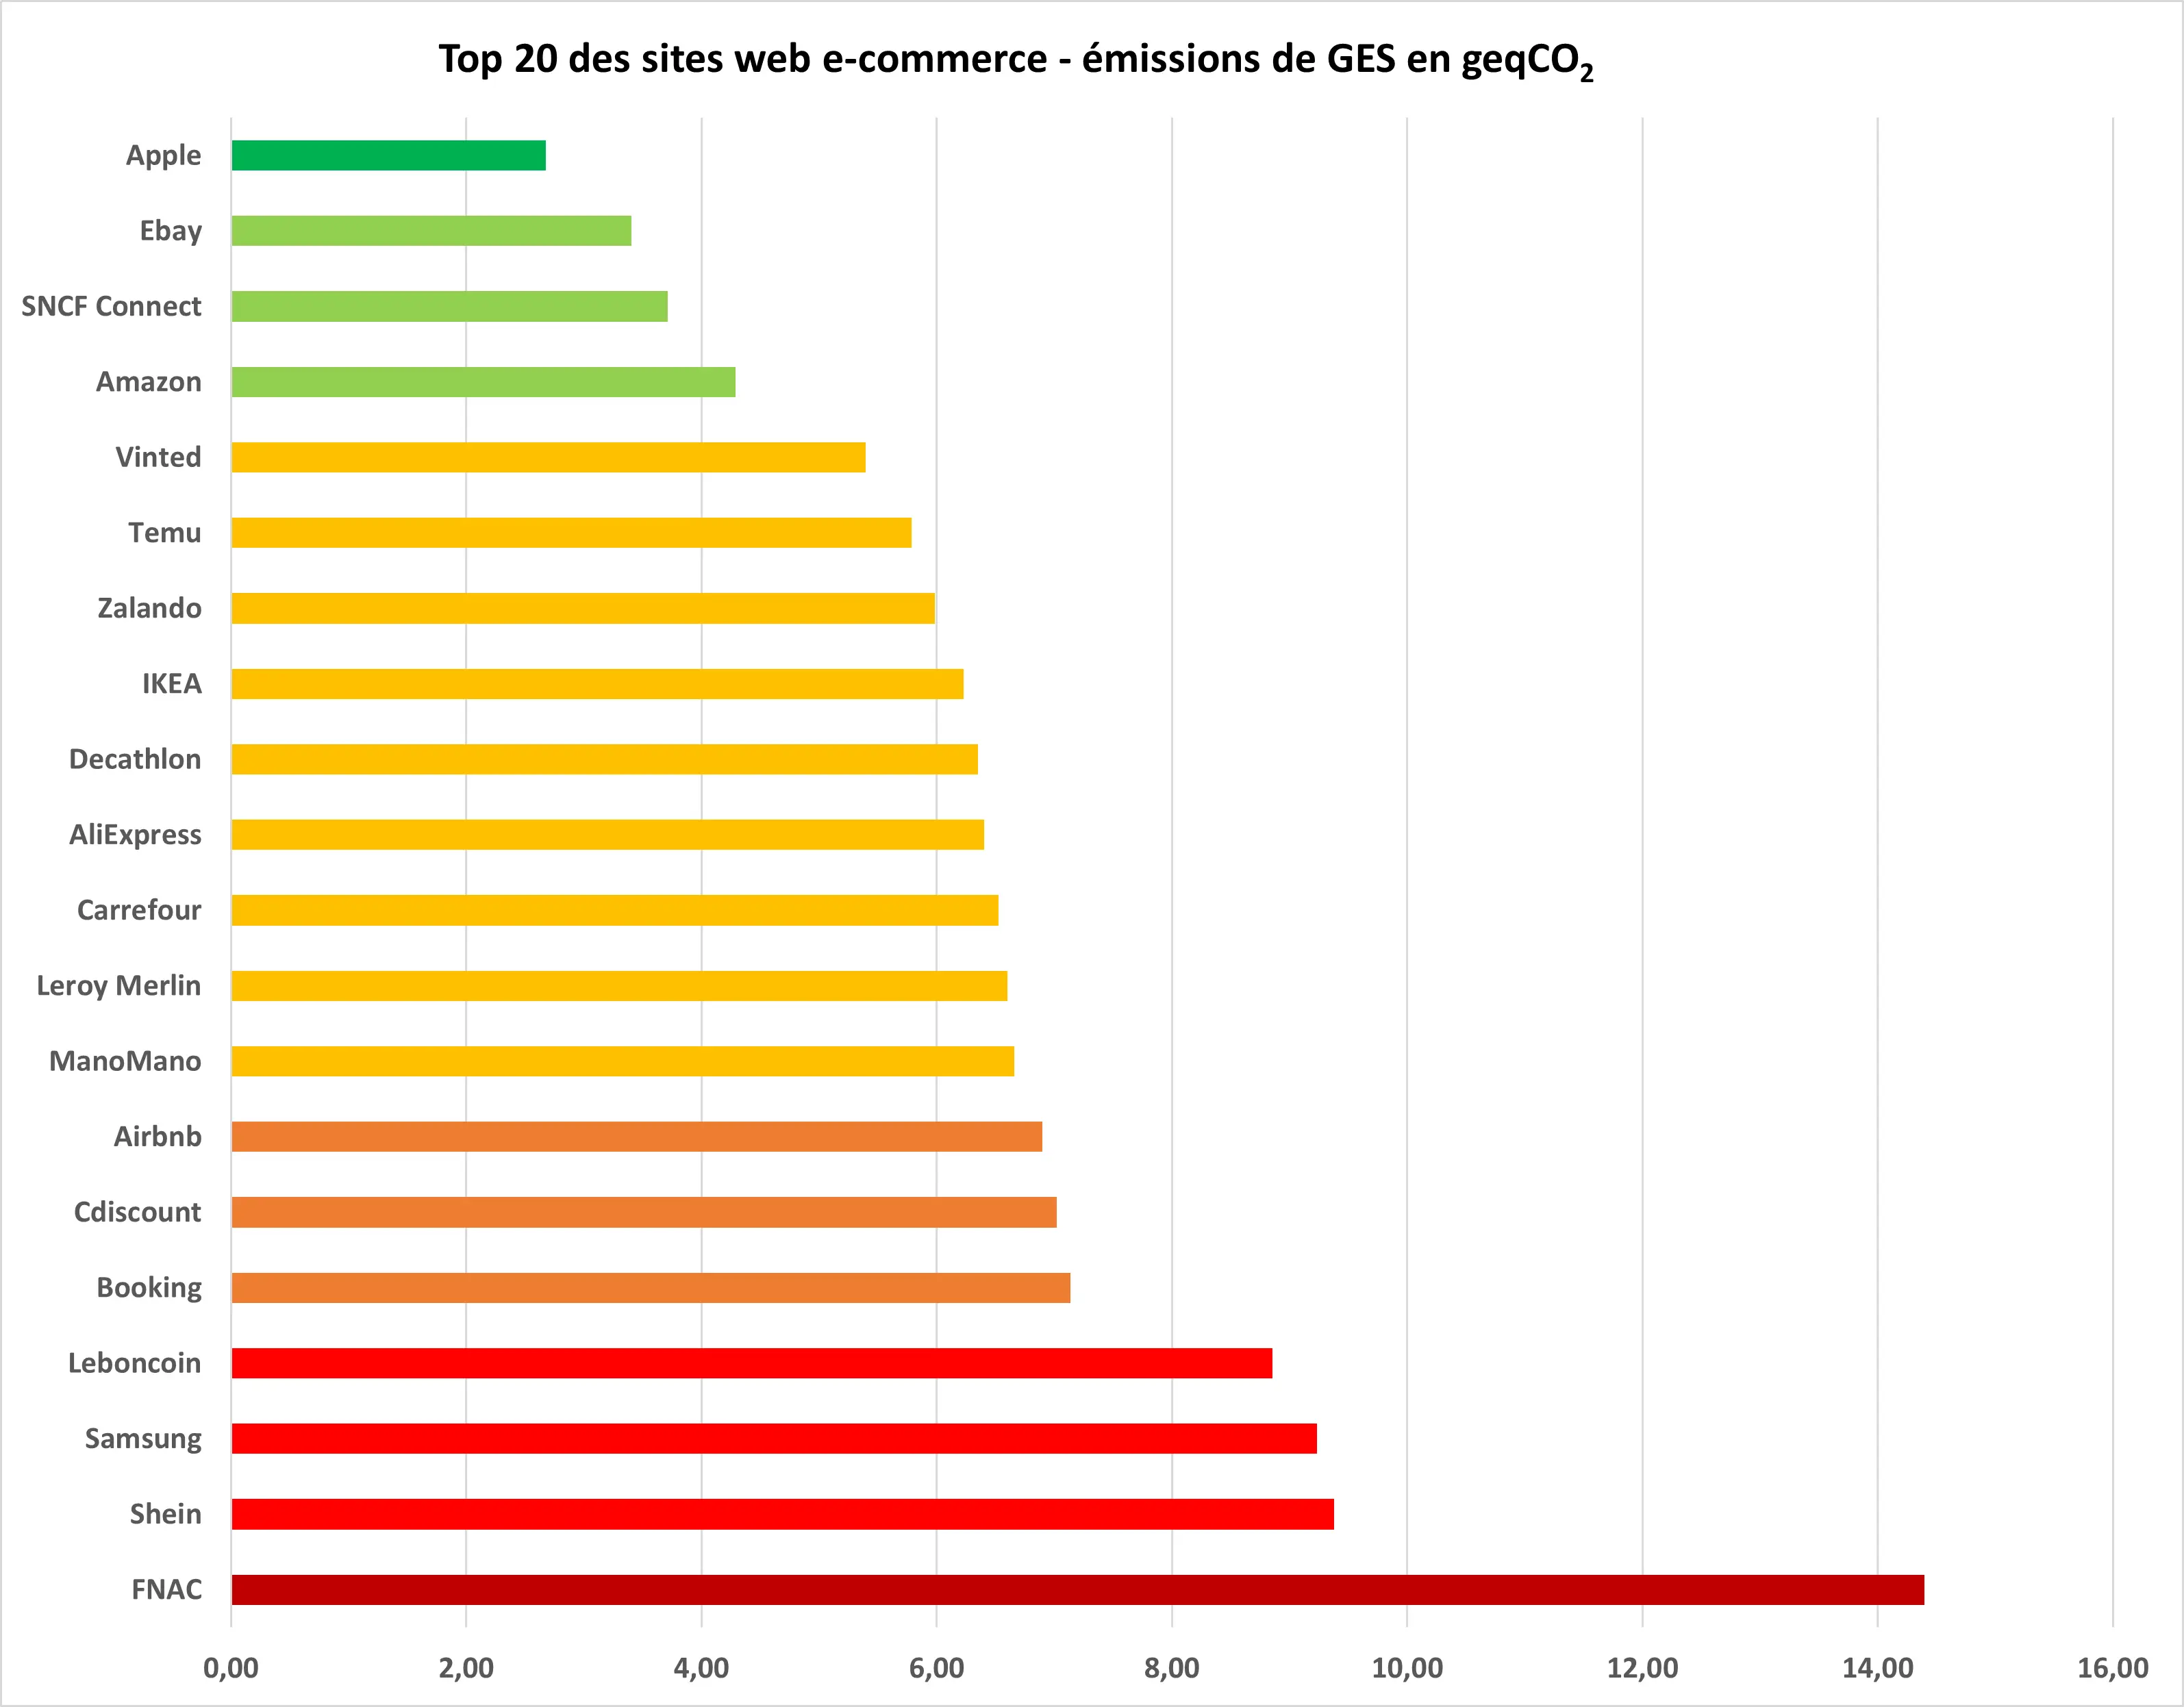
Ranking of the 20 e-commerce sites with the lowest greenhouse gas emissions
In the end, the ranking for all the sites measured was as follows:
The measurements were carried out on a Samsung Galaxy S10 smartphone running Android 12.
Initially, the measurements were carried out using a simple benchmark (loading, scrolling and pausing on each page). The sites selected turned out to be complex and the default path not very representative of user behaviour. We therefore decided to opt for more precise measurements using a user path that was representative of what most customers do. This was done using the Greenspector Studio SaaS solution, by automating and measuring a standard user path :
Each measurement is the average of 3 homogeneous measurements (with a low standard deviation). For each iteration, the cache is emptied beforehand. It is then kept during the same iteration (which makes it possible to evaluate what is kept in cache for the passage on a product sheet).
Various assumptions have been made for the environmental projection. The aim here is to simplify the calculations, even if the choices made do not apply to all the sites studied :
Breakdown of user terminals (source : https://datareportal.com/reports/digital-2024-france [EN]) :
Automating the visitor’s journey on the selected sites gives us a more complete picture of their behaviour :
There are a number of general observations to be made :
For example, on the home page of the Zalando site, the screen is mainly taken up by the cookie consent banner, the promotion of a new tool based on Artificial Intelligence, a banner for sales and another for installing the mobile application.

Following measurement using Greenspector Studio, the stages identified will be scored according to three criteria:
We are going to look at the rankings of the various sites according to each of these criteria in order to identify those that require our particular attention. By cross-referencing these different rankings, we will identify the sites to be analysed as a priority.
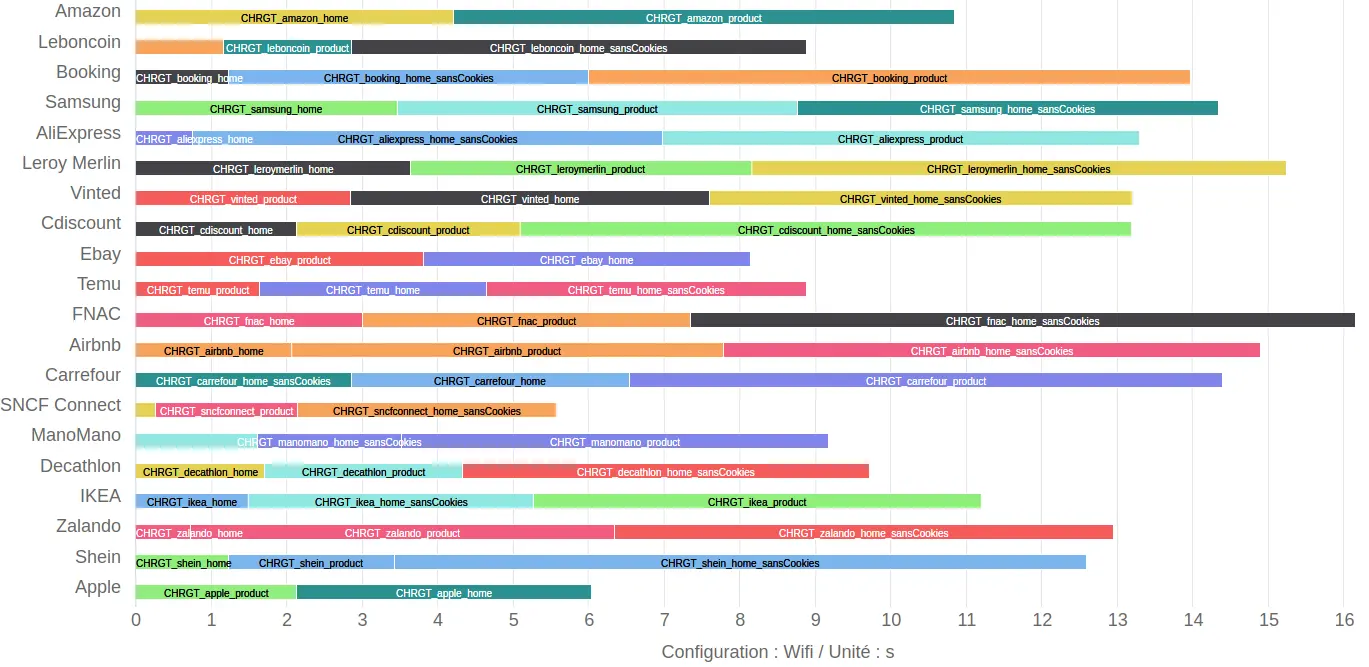
The duration of the pause stages is fixed (30s). So we still have to see how long the other stages last.
Here we can see that SNCF Connect comes out on top with the fastest route, closely followed by Apple.
At the other end of the scale, the FNAC site suffers from the longest steps. It is closely followed by Leroy Merlin and Airbnb.
It is customary to set a threshold of 3 s for a page to load (which refers to an old Google statistic). We note here that page load times are generally above this threshold, up to around 9s for the home pages of the FNAC and Shein sites.
In particular, some product pages take a very long time to load (even though they can in theory be based on data cached when the home page is loaded): for example, Booking and Carrefour.
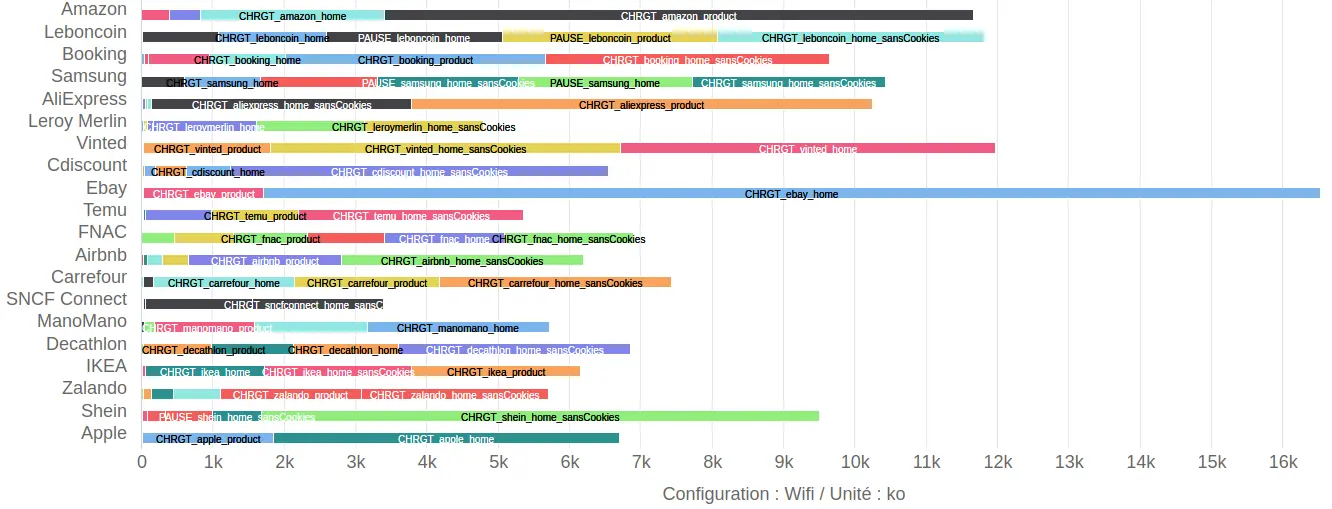
The journey requiring the least amount of data transferred is again for SNCF Connect, followed by Leroy Merlin. In the case of the Leroy Merlin site, it will therefore be interesting to see why the site requiring the least data is one of the longest to load.
The site for which the path measured involves the most data transferred is Ebay, followed by Vinted and Leboncoin.
The vast majority of loading stages here require more than 1 MB of data to be transferred.
The path measured here reveals the extensive use of third-party services in two ways:
There are also significant data transfers during some break stages :
There are other sites for which the data transferred during certain pause stages is significant in terms of volume.
In the case of Leboncoin, Greenspector Studio shows us the following graph for a pause on the home page :
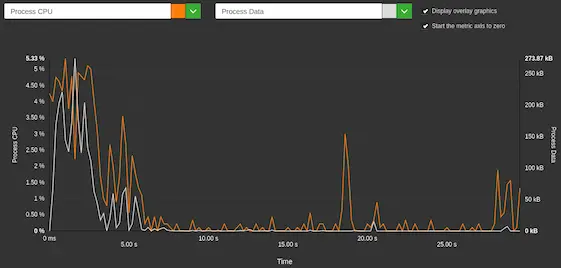
Greenspector Studio capture of the pause stage on the Leboncoin site
We can see that the additional data transfers here seem to be due to a load leftover. The trend is the same for the pause on a product sheet on the same site. In principle, the site has been optimised from a performance point of view to display pages as quickly as possible. But even when the page appears to have finished loading, other operations are in progress. Once the page has really finished loading, other small data and CPU peaks appear, which are generally linked to third-party services.
On the home page of the Samsung site, the same findings can be seen.
The site for which the path measured has the least impact in terms of energy is the Apple site, followed by Ebay and SNCF Connect. It will be interesting here to take a closer look at Ebay (which uses a lot of data but has little impact on energy), Apple and SNCF Connect (which appear to have little impact).
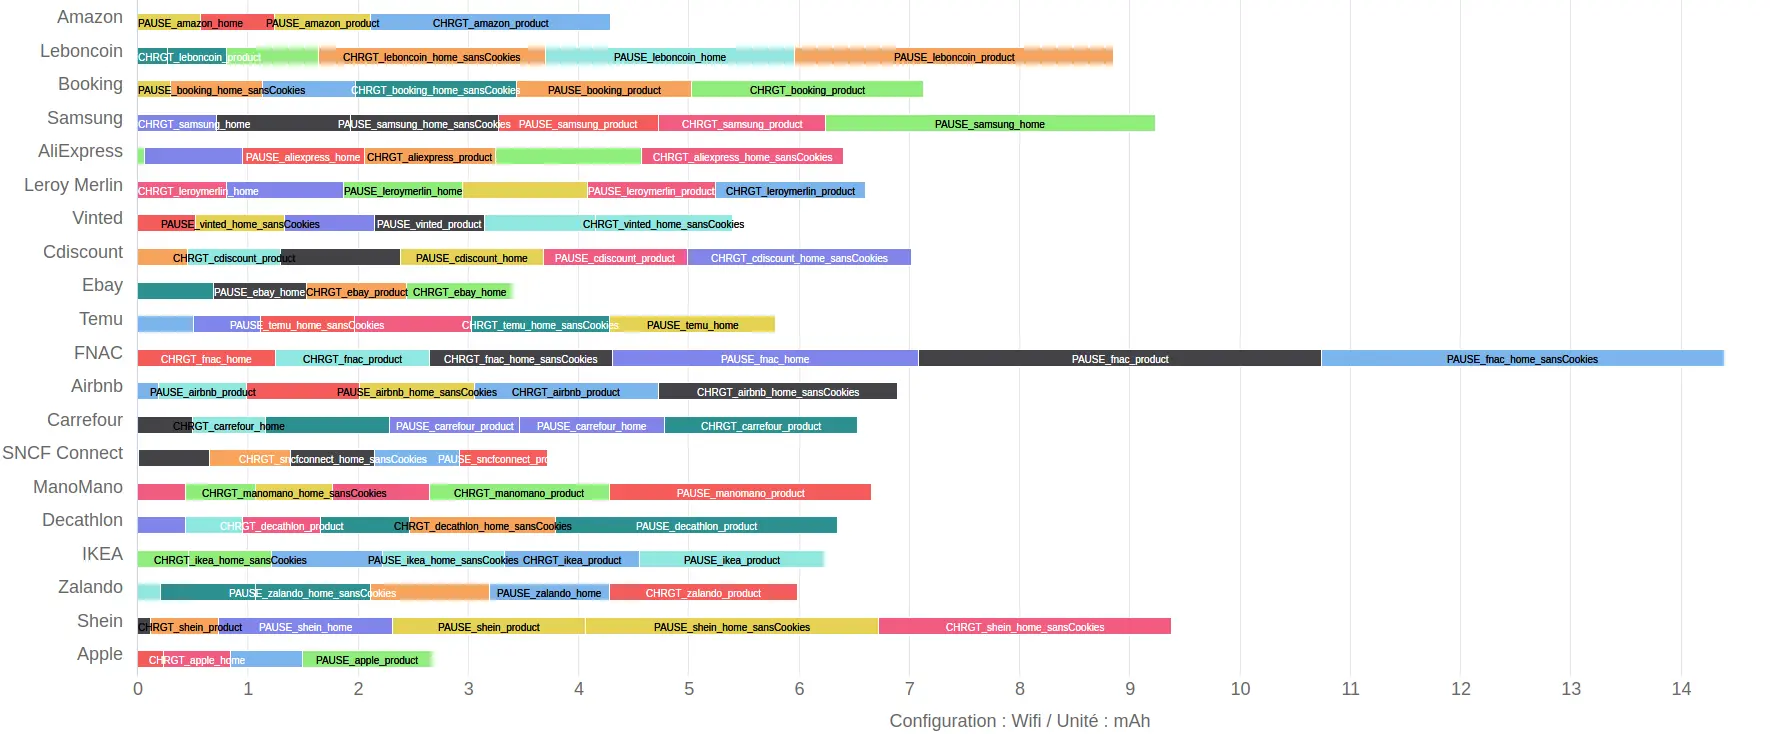
Most of the sites have a significant impact on battery discharge. In particular, the pause stages on the FNAC site have a high impact. We will analyse these later. In general, this over-consumption can be linked to background processing (analytics and other third-party services), animations or even a graphic charter that is too bright (in the case of an OLED or AMOLED screen).
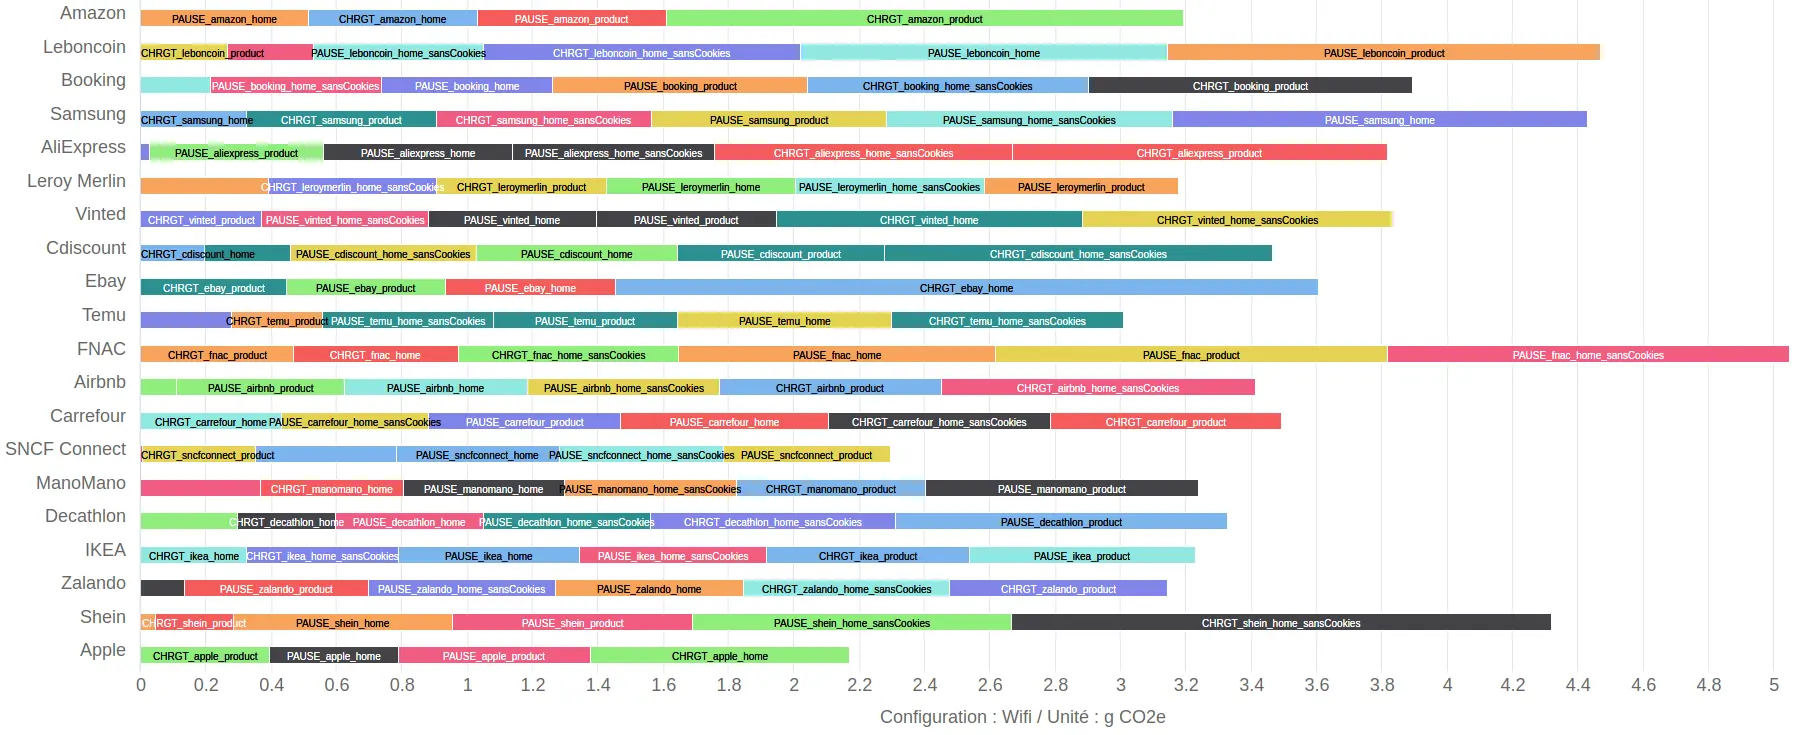
Ranking of sites according to greenhouse gas emissions
Greenhouse gas emissions are calculated using the Greenspector projection model mentioned earlier in this article. The parameters seen above (data transferred, duration of stages and energy) are therefore taken into account in their calculation.
The site with the lowest impact in terms of greenhouse gas emissions would therefore be the Apple site, followed by SNCF Connect.
The site with the highest impact would be FNAC, followed by Leboncoin and Samsung.
Next, we will analyse :
SNCF Connect appears to be one of the most sober websites. However, not everything is perfect. In particular, almost 2 MB of data is transferred for the home page and 1.5 MB for the product page. Despite all this, the site remains one of the fastest to load and also one of the least energy-consuming. This site is therefore one of the most exemplary of the lot in terms of eco-design, as evidenced by its a declaration on the subject. This desire is very apparent in the design of the site, but is also based on the fact that it requires less visual support than other e-commerce sites (which have to showcase visuals of their products). Similarly, there is little animated content on these pages (animation or video).
On this site, the largest files are the fonts. It is also quite surprising to see that certain basic good practices such as code minimisation are not applied.
The home and product pages are rather light on design: no pre-loaded videos or animations, and relatively few third-party services.
As with the SNCF Connect site, the two top-ranked sites have shaken off the ‘bad habits’ of other e-commerce sites. For example, there are few or no images, animations or third-party services (at least on the Apple site). Similarly, there are fewer deceptive mechanisms to encourage purchases than on the other sites in the ranking.
Another point in common : l’WAVE Tools accessibility checker (automatic and partial) reports very few errors (apart from several accessibility errors on the home page of the Apple site).
The home page often redirects to a CAPTCHA, which sometimes distorts the measurements and limits the use of certain performance analysis tools.
The images are fairly well optimised (WebP format, fairly light, etc). Although very light, the main image (LCP: Largest Contentful Paint) takes more than 4 seconds to display. The impact of Javascript appears to be quite substantial, contributing to the delay in display.
What’s more, displaying an auto-scrolling carousel makes it difficult to detect when the page has finished loading.
To get round these measurement problems, CrUXVis is used to check that the performance metrics are good and stable over time.
CrUXVis collects performance scores from Chrome users browsing the site.
A quick analysis of the home page reveals a number of images that would benefit from further optimisation:
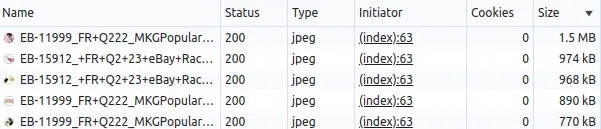
Optimising these images (preferably automatically) could easily reduce the impact on the site.
Similarly, some code files are not minified and should be. More generally, the way Javascript is processed is very detrimental to the site’s performance.
There are very few third-party services on the site.
We can see here that the performance results we obtained relate to the first page load. However, this is more complex and the elements displayed change several times before stabilising. In this case, via the automation for measurements with Greenspector Studio, it is possible to define precisely the element to wait for before considering the page to be fully loaded.
Large data transfers are a major symptom of degraded performance.
Overall, the images appear to be well optimised, in particular thanks to conversion to AVIF format.
On the other hand, there are numerous third-party services and a large number of JS files, some of which are very large.
Apart from the LCP, the Core Web Vitals are fairly satisfactory.
The site would therefore require further investigation to optimise the JS and audit the third-party services.
The findings are similar for the FNAC site: optimised images, JS to be optimised and third-party services to be audited.
CrUXVis confirms that the Core Web Vitals are well behind for this site.
It is also important to note that WAVE reports numerous accessibility errors, confirming a considerable deterioration in the user experience at a time when the accessibility of digital services is the subject of legal obligations.
The eco-design of websites and mobile applications is a subject that is receiving increasing coverage, particularly on our blog.
This ranking of e-commerce sites confirms that most would benefit from displaying fewer elements, being better optimised technically, limiting third-party services and deceptive mechanisms, and above all adopting a more sustainable overall approach.
This article was an opportunity to discover the consequences of an increasingly laborious user experience: pop-ups galore, captchas, the need to log in, and so on.
While e-commerce sites have in theory assimilated the financial benefits of web performance, it is important that they increasingly take into account the reduction of their environmental impact. These efforts can be a differentiating advantage for those who make the effort.
Similarly, via the Sustainability chapter of the Web Almanac, we were able to see that some of these efforts can be made directly by the turnkey tools used to build online shops: https://almanac.httparchive.org/en/2024/sustainability#popular-frameworks-platforms-and-cmss [EN]
More generally, we find the usual findings when we analyse the eco-design of digital services :
Reducing the environmental impact of e-commerce therefore goes well beyond technology and design, even if these two aspects can be used to implement quick wins that will kick-start a much broader continuous improvement process.
This article illustrates that the eco-design of websites and mobile applications is only part of the subject : https://uxdesign.cc/re-defining-sustainable-e-commerce-51cdc3e76d46 [EN].
In addition, ADEME (Agence de la Transition Ecologique) has a website dedicated to responsible marketing. It presents practical case studies and white papers on the subject : https://reussir-avec-un-marketing-responsable.org/
It is also essential to take into account the company’s values, product design and delivery methods. More than any other type of site or application, e-commerce must stop relying on deceptive mechanisms. Conversely, this type of digital service should consider nudges to encourage more responsible behaviour.