Fashion M-Commerce applications barometer (2018)
The study that we conducted within GREENSPECTOR is based on fashion M-Commerce applications among the most used in France in order to compare their energy consumption and resources according to frequent use scenarios.
Study presentation
E-commerce on mobile as well as sales via dedicated mobile applications (m-commerce) are growing in France from year to year. Mobile now accounts for 6% of all retail sales in the world and nearly 60% of e-commerce, after an annual increase of 40% in 2017 (eMarketer study). It becomes key for a brand to integrate a strategy of m-commerce as part of its digital transformation. Whether shopaholic, shopping for the latest news, or simply loyal to a particular brand or brand, you probably have one or more online sales apps on your smartphone.
We chose to study a fairly wide scope of applications positioned on the french fashion m-commerce. These applications offer highly product and purchase-oriented services. First issue, users associate the mobile application with the image of the brand and its maturity in its process of digital innovation; brands must be vigilant about the perceived quality of their mobile users. Another challenge, not the least: to offer the best possible user experience to induce the act of purchase and customer loyalty. The mobile application becomes a key vector of this loyalty as well as the transformation of the business. Thus it must offer an experience, certainly attractive but above all effective (targeting content and services, shopping without disruption, …) while combining performance and user-friendliness.
An application downloaded and present on the smartphone of his shopper also has requirements related to the sharing of the constrained resource that is our smartphone: how to reduce the size of the application, data generated but also how to reduce the consumption of resources to not risk being notified as too consuming application? How to get a good experience regardless of the environment of the user (low performance network, lowend smartphone, …)?
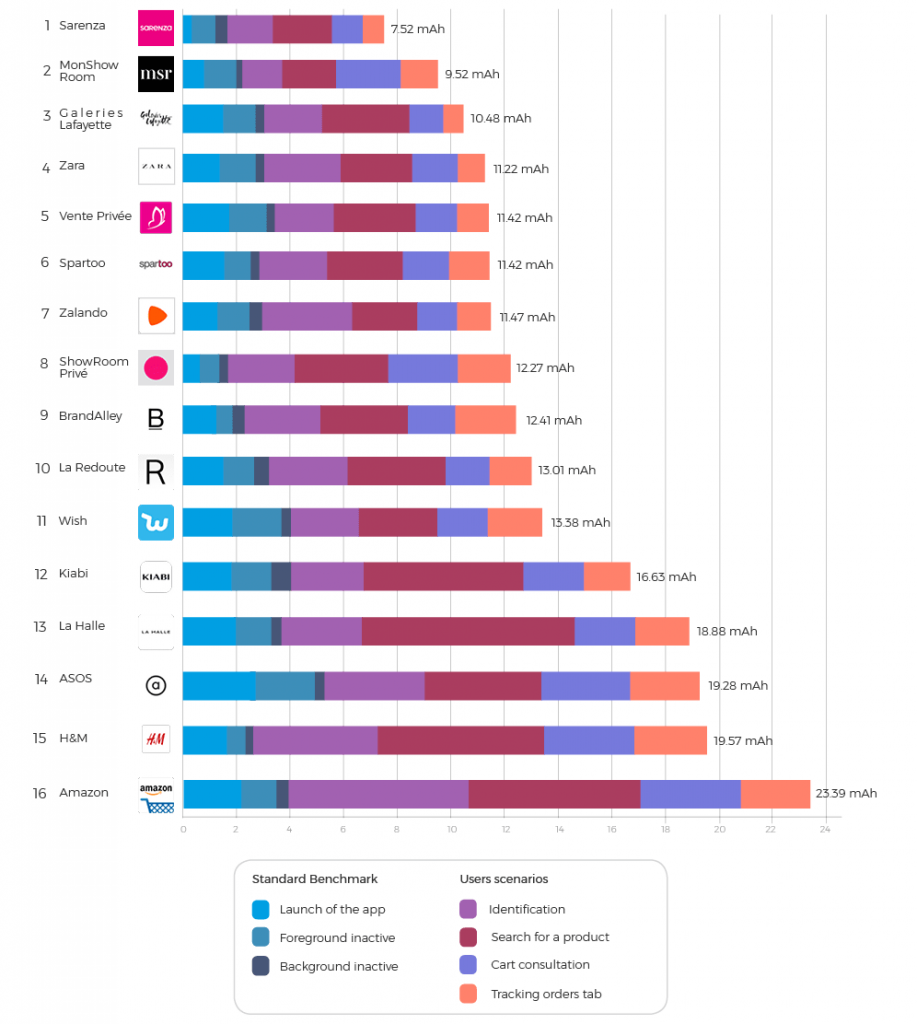
These are the questions we are trying to answer through this energy efficiency benchmark of 16 fashion m-commerce applications, used in France. A comparison that covers both technical issues and the typical paths of the mobile user. The differences in the impact on autonomy are important between the different applications and vary from single to triple for the same use. Difficult to make a direct link between this efficiency and the turnover generated or the average basket. Nevertheless, performance, in the context of an ever more instant use remains a key factor in the transformation of the basket: every second costs 7% conversion!
Results
Impact of applications on autonomy (mAh)
Methodology
We have selected 16 applications positioned on the fashion m-commerce.
| Application | Version | Downloads | Playstore score |
|---|---|---|---|
| Amazon | 16.12.0.100 | 100 000 000+ | 4.3 |
| ASOS | 4.4.4 | 10 000 000+ | 4.7 |
| BrandAlley | 3.2.3.2 | 100 000+ | 3.2 |
| Galeries Lafayette | 1.9 | 10 000+ | 2.7 |
| H&M | 9.6.2 | 10 000 000+ | 3.7 |
| Kiabi | 5.6 | 1 000 000+ | 4 |
| La Halle | 1.1.4 | 50 000+ | 3.2 |
| La Redoute | 8.9 | 1 000 000+ | 4 |
| Monshowroom | 1.0.1 | 10 000+ | 3 |
| Sarenza | 3.5.3 | 500 000+ | 3.7 |
| Showroom Privé | 9.6.1 | 5 000 000+ | 4.1 |
| Spartoo | 3.4.4 | 500 000+ | 4 |
| Vente Privée | 3.3.4 | 5 000 000+ | 3.9 |
| Wish | 4.19.5 | 100 000 000+ | 4.5 |
| Zalando | 4.24.1 | 10 000 000+ | 4.5 |
| Zara | 3.9.1 | 10 000 000+ | 4.3 |
Number of evaluated criteria
- Eco score global: it indicates the level of efficiency of the application, that is to say its respect for the resources of the device (battery, memory, processor) and the quality of its behavior on the network (data volumes, frequency of solicitation).
- Impact on the autonomy of the smartphone: It’s calculated on the basis of the speed of discharge of the battery during the scenario. It’s measured by means of energy sensors of the device.
- Risk of detection of the application as a consumer by the system: Manufacturers like Samsung or Huawei display notifications to users when they detect that an application consumes too much battery. It’s better to avoid this if you want to keep your retention rate.
- Time spent: Here, time is an indicator of the quality of the user journey. A faster route for the most frequent uses will also cause consumption
lower and better quality of user experience (UX).
Scenarios
4 user scenarios were realized:
- Application connection phase
- Search for a product
- Cart consultation
- Consultation of the tab “Tracking orders”

Kimberley DERUDDER has been digital marketing manager at Greenspector for more than 5 years. Kimberley graduated with a master’s degree in Marketing – Communication and specialized in Inbound Marketing after her first two years at Greenspector. Today in charge of the animation of the marketing, social media and lead generation strategy, she also takes care of app comparisons and battles.