2019 Mobile video games ranking : 12 apps measured
The 2018 year was a record year for the mobile application market, with more than 113 billion downloads worldwide, up 10% from 2017. These are video sharing and “casual games” applications which have been the most downloaded (Source: AppAnnie). If the carbon footprint of storage servers increases and has a strong impact on the environment, mobile applications are also becoming more and more energy intensive because they are demanding technical resources (RAM, CPU, Data, etc.). GREENSPECTOR has measured the energy consumption of mobile casual games apps. At the top of this ranking, Candy Crush Saga is the most energy efficient one.
Digital power consumption is up 9% a year, according to the Digital Environmental Impact Report released Oct. 4 by The Shift Project , think tank of the carbon transition. The share of digital in global greenhouse gas emissions has increased from 2, 5% in 2013 to 3.7% in 2018, representing an increase of 450 million tonnes in the OECD. These are the data centers that host softs and data, but also the use of terminals and networks. “The energy impact of watching video is about 1,500 times greater than the simple power consumption of the smartphone itself, the report.
In the study conducted in partnership with Atos, on the top 30 most energy-consuming applications, we have also identified that video game applications are among the most demanding applications, after those of social networks and browsers. This consumption has a significant impact on the battery life and therefore on the user experience: the drop in the battery level affects the remaining playing time before recharging.
Results
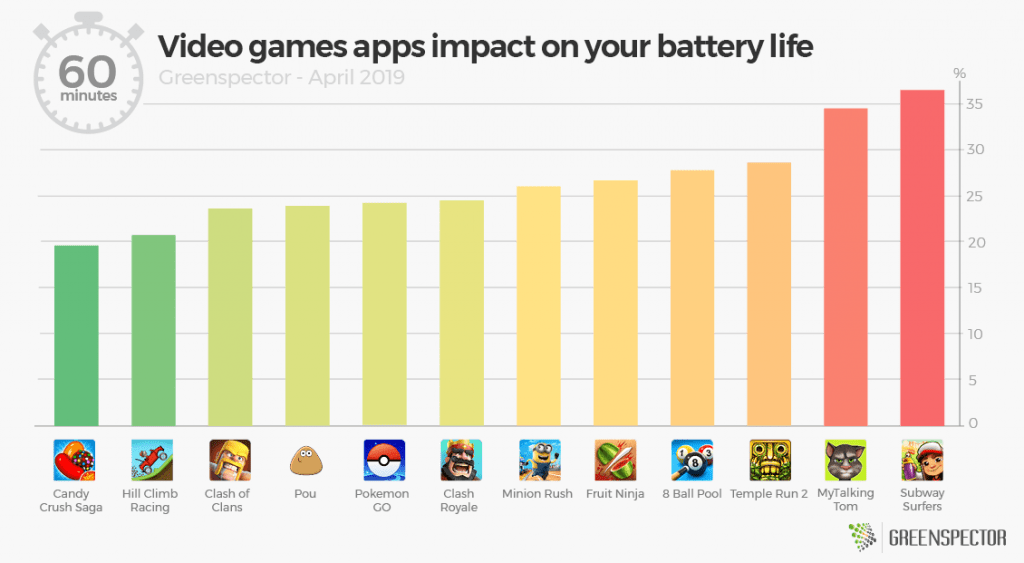
- Subway Surfers, last in the ranking, consumes almost twice as much as Candy Crush Saga;
- if Candy Crush Saga was running continuously on a smartphone for 60 minutes, the app would consume 19% battery, against nearly 40% for Subway Surfers.
The high energy and resource consumption of some applications can be explained by:
- 3D games such as : Temple Run 2, My Talking Tom or Subway Surfers tend to be more consumer than 2D games like Candy Crush Saga, Hill Climb Racing or Pou;
- some applications include unwanted ads that disrupt the user experience and increase energy consumption, aurtres offer to visualize advertising videos to win rewards in the game.
If we compare the energy consumption of these mobile video game applications to a heavier platform game (like Rayman Adventures for example, developed by Ubisoft), this one would be in the average consumption: it would only consume 24% battery and the average is 26%. Only the storage capacity of the device (weight of the installed application) would be more impacted.
For those who like numbers
| Application | Version | Downloads | Playstore Grade | App weight (MB) | Exchanged data (KB) | Memory (MB) | In game Energy consumption (mAh) |
|---|---|---|---|---|---|---|---|
| 8 Ball Pool | 4.3.1 | 100 000 000+ | 4.5 | 165 | 0.77 | 189.4 | 16.3 |
| Candy Crush Saga | 1.147.0.2 | 500 000 000+ | 4.5 | 132 | 0.22 | 254.8 | 12.2 |
| Clash of Clans | 11.446.11 | 500 000 000+ | 4.6 | 135 | 0.8 | 488.8 | 14.3 |
| Clash Royale | 2.6.1 | 100 000 000+ | 4.5 | 128 | 0.126 | 261.9 | 14.9 |
| Fruit Ninja | 2.7.2.504834 | 100 000 000+ | 4.3 | 140 | 6.03 | 294.4 | 14.8 |
| Hill Climb Racing | 1.41.0 | 500 000 000+ | 4.4 | 107 | 8.59 | 211.1 | 11.7 |
| Minion Rush | 6.4.1 | 100 000 000+ | 4.5 | 210 | 1.51 | 182.1 | 18.2 |
| MyTalkingTom | 5.2.3.326 | 500 000 000+ | 4.5 | 188 | 2.03 | 450 | 20.7 |
| Pokemon Go | 0.137.2 | 100 000 000+ | 4.1 | 218 | 0.271 | 450 | 15.4 |
| Pou | 1.4.77 | 500 000 000+ | 4.3 | 43 | 0.83 | 139.8 | 13.9 |
| Temple Run 2 | 1.55.3 | 500 000 000+ | 4.1 | 120 | 16.65 | 280.5 | 16.3 |
| Subway Surfers | 1.100.0 | 1 000 000 000+ | 4.5 | 165 | 35.75 | 320.9 | 23 |
| Rayman Adventures | 3.9.0 | 10 000 000+ | 4.6 | 524 | 1.34 | 326.6 | 15.5 |
The measurements were carried out by our laboratory on the basis of a standardized protocol, respecting a specific user scenario (launch of the app, launch of the game). The other scenarios are the launch of the application (20”), inactivity in the foreground (20”) and inactivity in the background (20”). This methodology makes it possible to estimate the embedded application complexity and its energy impact during the use phase.
Note: Find our other comparative applications articles:

Kimberley DERUDDER has been digital marketing manager at Greenspector for more than 5 years. Kimberley graduated with a master’s degree in Marketing – Communication and specialized in Inbound Marketing after her first two years at Greenspector. Today in charge of the animation of the marketing, social media and lead generation strategy, she also takes care of app comparisons and battles.