The battle of the week: Happn vs Tinder
Today’s match will oppose two social and dating apps: Happn vs. Tinder. Based on the same geographical proximity asset, where contact is created after validation of the two people via their profile, the two applications are a real current social phenomenon.

In the left corner, Happn, a French dating application created in 2014. It allows its users to find people they crossed in the day.
In the right corner, Tinder, American giant created in 2012, Happn’s competing application for networking and dating.
The weighing
At weighing Tinder is the heavier application with a weight of 170 MB. Its opponent Happn is much lighter with a weight of 79 MB, or 53% less.
The fight
All the lights are now turned on the fighters and the match can finally begin.
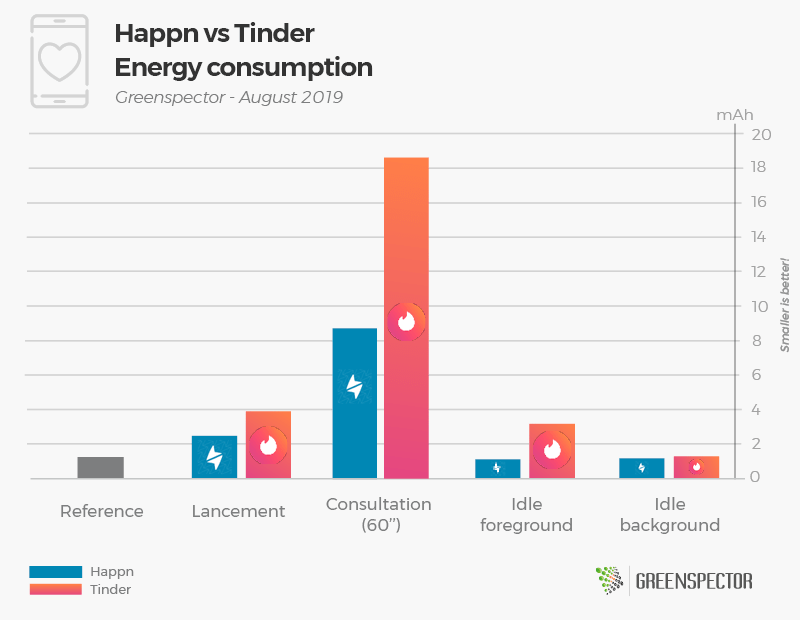
In the first part of the match which consists in measuring the impact of the launch phase of the application, it’s Happn that wins the first round by consumming 35% less than Tinder. The difference in consumption is very marked on the swiping profiles phase. Indeed, Happn (8.7 mAh) puts Tinder (18.6 mAh) K.O with a lower consumption of 53%. To end this confrontation, we have set up two decisive rounds of idle observation for each opponent. During the inactivity phases in foreground and background, Happn still leads with a 65% lower consumption compared to Tinder for this foreground phase and 8% for the background phase.
The bell rings, end of the match!
And the winner is…

Without any surprise, it’s a victory by knockout for Happn app, declared victorious against its opponent Tinder on an overall score of 13.5 mAh at 27 mAh, by consuming 50 % less energy.
For those who like numbers
| Application | Version | Downloads | Playstore Grade | App weight (MB) | Exchanged data (KB) | Memory (MB) | Energy consumption (mAh) |
|---|---|---|---|---|---|---|---|
| Happn | 24.10.0 | 50 000 000+ | 4.3 | 79 | 4.5 | 252 | 13.5 |
| Tinder | 10.20.0 | 100 000 000+ | 4 | 170 | 4.5 | 310.5 | 27 |
On a 1 minute usage scenario, Happn has a consumption equivalent to an application like WhatsApp. (Source: Study Consumption of top 30 most popular mobile applications)
The measurements were carried out by our laboratory on the basis of a standardized protocol, respecting a specific user scenario (launch of the app, profiles swiping). The other scenarios are the launch of the application (20”), inactivity in the foreground (20”) and inactivity in the background (20”). This methodology makes it possible to estimate the embedded application complexity and its energy impact during the use phase.
Find the battle of last week : Bankin vs Linxo
Battles ideas? Contact us!

Kimberley DERUDDER has been digital marketing manager at Greenspector for more than 5 years. Kimberley graduated with a master’s degree in Marketing – Communication and specialized in Inbound Marketing after her first two years at Greenspector. Today in charge of the animation of the marketing, social media and lead generation strategy, she also takes care of app comparisons and battles.