« Dès la phase de conception et tout au long du projet, nous avons intégré dans nos exigences la maîtrise de la performance associée à une démarche de sobriété. Avec Greenspector nous avons pu y associer une mesure, travailler sur des optimisations tout en poursuivant l’acculturation de nos collaborateurs sur le sujet pour un résultat très encourageant »
Sébastien Gobin
Responsable Qualité et Production Tech & Produits
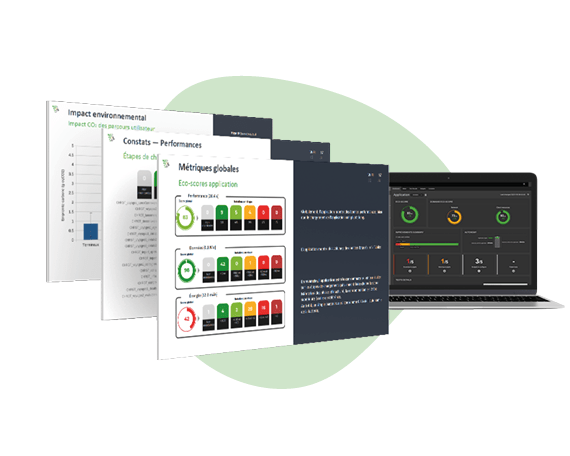
« La solution remonte des résultats très concrets sur le comportement de nos applications. » « Cela nous permet de nous concentrer sur les actions les plus impactantes. » « Travailler sur la sobriété permet très clairement d’avoir une application plus performante. »
Greenspector may use cookies to improve your experience. We are careful to only collect essential information to better understand your use of our website.
This website uses cookies to improve your experience while you navigate through the website. Out of these, the cookies that are categorized as necessary are stored on your browser as they are essential for the working of basic functionalities of the website. We also use third-party cookies that help us analyze and understand how you use this website. These cookies will be stored in your browser only with your consent. You also have the option to opt-out of these cookies. But opting out of some of these cookies may affect your browsing experience.
Performance cookies are used to understand and analyze the key performance indexes of the website which helps in delivering a better user experience for the visitors.
Analytical cookies are used to understand how visitors interact with the website. These cookies help provide information on metrics the number of visitors, bounce rate, traffic source, etc.