Author: Kimberley DERUDDER

Kimberley DERUDDER has been digital marketing manager at Greenspector for more than 5 years. Kimberley graduated with a master's degree in Marketing - Communication and specialized in Inbound Marketing after her first two years at Greenspector. Today in charge of the animation of the marketing, social media and lead generation strategy, she also takes care of app comparisons and battles.

What’s new? Greenspector release note v.2.10.0

Reading Time: 2 minutes

The Greenspector team is proud to announce its latest release v.2.10.0.

With this release, you can now monitor your phone during your working day in the field. With a new application installed on your android phone, you can start monitoring, do your normal job, stop the monitoring. You can then retrieve the results and analyze the metrics. This tool may be useful to understand the behaviour of all your professional applications installed on your phone (energy leaks, memory leaks…)

Collect metrics coming from devices used in the field

  1. Measuring a demo application (contact list)
  2. Our Greenspector app allows you to start the measurement (start measure)
  3. Or stop it (stop measure)
  4. You can send the measures and visualize the metrics to the web interface
  5. Or generate a CVS file with all the metrics

What’s new? Greenspector release note v.2.9.0

Reading Time: 2 minutes

The Greenspector team is proud to announce its latest release v.2.9.0.

To measure application and website consumption, you can run user journeys on our smartphone farms. In this context, we have improved our simplified test language (GDSL) with, for example, features for preparing browsers but also taking Firefox into account… Unlike many tools that provide you with an environmental impact only on the main page and on simulated environments, these capabilities will allow you to assess and monitor the impact of your digital solution!

API Swagger for existing routes applications
You can now easily switch browser

Greenspector partner alongside Atos – EcoAct for ChangeNOW and its digital edition (May 27-29)

Reading Time: 2 minutes

ChangeNOW, the largest gathering of innovations for the planet, will be held this year in a 100% digital format from May 27 to 29, 2021. For 3 days, the summit highlights the most concrete and innovative solutions: more than 1000 solutions, 500 speakers and 120 countries united to face the greatest environmental and climatic challenges.

Greenspector will exhibit its unique and innovative solution to measure/analyze the consumption of digital services. For this 2021 edition, Greenspector has signed a partnership with ChangeNow and EcoAct. Greenspector will carry out an estimate of the carbon footprint of the event alongside EcoAct, a long-standing player in the fight against climate change.

For this purpose, Greenspector will measure the energy and resources consumption of the event’s web and mobile platform and will also estimate the carbon impact of the websites of all event partners. These measurements, carried out on real devices using the Greenspector Test Runner tool, will be accessible on our website in the form of dashboards or rankings to the various stakeholders of the event.

Climate change, resources, biodiversity and inclusion are the greatest challenges of our century. The ChangeNOW Summit is a unique opportunity to connect with investors, media, corporations, institutions and talents that can support your projects and make them scale to accelerate change.

As a partner of ChangeNOW, Greenspector is proud to offer you a 30% reduction for the purchase of a business pass with the code: GREENSPECTORNOW2021.

Which video conferencing mobile application to reduce your impact? 2021 Edition

Reading Time: 6 minutes

We invite you to consult the 2022 edition. Read the article.

For this new 2021 edition of our ranking, we have completed our 2020 study with new solutions and even extended it to web solutions. The objective of these measures is to see how the solutions stand in terms of environmental impact (Carbon) with each other on common user scenarios but also to provide benchmarks on our uses of videoconferencing.

So this time we compared 19 mobile applications: Big Blue Button, BlueJeans, Circuit by Unify, Cisco Webex Meetings, ClickMeeting, Go To Meeting, Discord, Google Meet, Infomaniak kMeet, Jitsi, Pexip, Rainbow, Skype, StarLeaf, Microsoft Teams, Tixeo, WhereBy, Zoho Meeting et Zoom.

For each of its applications, measured on an S7 smartphone (Android 8), the following three scenarios were carried out through our Greenspector Test Runner, allowing manual tests to be carried out over a period of 1 minute in one-to-one:

  • Audio conference only
  • Audio + video conference (camera activated on each side)
  • Audio and screen sharing conference

Learn more about the methodology.

Projected carbon impact ranking of videoconferencing applications (gEqCO2)

Here are the impact averages for the three scenarios:

User scenario / Year1 mn of audio conference1 min of audio + video conference1 min of audio + screen sharing conference
20210.155 gEqCO20.403 gEqCO20.163 gEqCO2

1,38 meters made in a light vehicle3,6 meters made in a light vehicle1,46 meters made in a light vehicle
20200.102 gEqCO20.289 gEqCO20.121 gEqCO2

On average, one minute of audio-video conferencing impacts 61% less (or 2.6 times less) than with activated cameras and 5% less than when sharing a screen. According to our recent study on the impact of streaming a MyCanal video, on average, one hour of video streaming corresponds to an impact of 14g eqCO2. Or 0.233g eqCO2 per minute, or 1.7 less impacting than a minute of video conferencing in audio and camera but 1.5 times more than a minute of video conferencing in audio-only.

The Top 3 for one minute of videoconferencing on average: Google Meet (0.164 gEqCO2), Tixeo (0.166 gEqCO2), and Microsoft Teams (0.167 gEqCO2). Google Meet, first in this ranking on the carbon impact side, has an impact 2.5 times less than, Discord, the last app in this ranking. The average of this ranking is 0.237 gEqCO2, only 7 solutions are above.

The main part of the Carbon impacts is situated on the user device part (72%), followed by the Network part (16%) and finally the Server part (12%).

Here are the three least impacting applications in terms of Carbon depending on the scenario:

Audio (Top 3)Audio + camera (Top 3)Audio + screensharing (Top 3)
Microsoft TeamsBig Blue Buttons (via Chrome)Microsoft Teams
Google MeetClick MeetingGo To Meeting
Infomaniak MeetGoogle MeetTixeo

Energy Consumption of Video Conferencing Applications (mAh)

Here are the energy consumption averages for the three scenarios:

User scenario/year1 mn of audio conference1 mn of audio + video conference1 mn of audio + screen-sharing conference
20219.84 mAh16.26 mAh9.98 mAh
20206.6 mAh14.24 mAh7.50 mAh

On average, one minute of audio-video conferencing consumes 39% less (or 1.6 times less) energy than with activated cameras and 1.5% less than when sharing a screen.

The Top 3 (all scenarios combined) in energy consumption: Microsoft Teams (27.27 mAh), Go To Meeting (28.79 mAh), and Google Meet (30.11 mAh). Microsoft Teams first in this ranking in terms of energy consumption consumes 2 times less than the last in this ranking: Discord.

Here are the three most energy efficient applications depending on the scenario:

Audio (Top 3)Audio + camera (Top 3)Audio + screen-sharing (Top 3)
Microsoft TeamsZoho MeetingMicrosoft Teams
TixeoZoomTixeo
Infomaniak kMeetStarLeafGo To Meeting

Exchanged data from videoconferencing applications (MB)

Here are the averages of the data exchanged for the three scenarios:

User scenario/year1mn of audio conference1 mn of audio + video conference1 mn of audio + screen-sharing conference
20211.15 Mo16.01 Mo1.87 Mo
20200.806 Mo8.44 Mo1.43 Mo

It is on the consumption of data that the gaps are widening between tools and uses.

On average, one minute of audio conferencing consumes 92% less (or 14 times less) data exchanged than with activated cameras and 38% less than when sharing a screen.

The Top 3 (all scenarios combined) in energy consumption: Big Blue Buttons (4.49 MB), Tixeo (6.21 MB), and Google Meet (6.30 MB). Big Blue Buttons (via Chrome) first in this ranking for exchanged data consumes 10 times less than the last in this ranking: Discord.

Here are the three applications that consume the least amount of data according to the scenario:

Audio (Top 3)Audio + camera (Top 3)Audio + screensharing (Top 3)
Cisco Webex MeetingsBig Blue ButtonsCisco Webex Meetings
Blue JeansTixeoInfomaniak kMeet
Google MeetGoogle MeetGoogle Meet

And for our daily use of videoconferencing:

Just like our first study, we advise you during your online conferences to:

Favour audio only during your meetings: the video stream (camera) will tend to consume a lot more. A mobile session is on average 2.6 times more impactful for the environment in terms of carbon impact when the video is added to the audio. Adding screen sharing is not penalizing if it is useful.

Optimize the settings (when possible): adopt the dark theme, activate the data or energy-saving settings (in the case of LED, AMOLED type screens).

Prefer videoconferencing over travelling by car!

  • Comparison for 2 people who talk to each other in a 3-hour session in audio and active cameras (0.403 gEqCO2 per minute) while one of the two has made 20 km (112 gEqCO2 / km in France) round trip for a face to face.
  • By videoconference: 180 * 0.403 * 2 = 145 gEqCO2
  • By car: 112 * 20 = 2.4 kg EqCO2 or approximately 16x more impact.

Measured versions: Big Blue Button via Chrome (87.0.4280.101), BlueJeans (45.0.2516), Circuit by Unify (1.2.5102), Cisco Webex Meetings (41.2.1), ClickMeeting (4.4.6), Go To Meeting (4.6.0.7), Discord (62.5), Google Meet (2021.01.24.355466926), Infomaniak kMeet (2.2), Jitsi (20.6.2), Pexip (3.4.6), Rainbow (1.84.1), Skype (8.68.0.97), StarLeaf (4.4.29), Microsoft Teams (1416.1.0.0.2021020402), Tixeo (16.0.1.2), WhereBy (2.3.0), Zoho Meeting (2.1.4) et Zoom (5.5.2.1328).

For each of its applications, measured on an S7 smartphone (Android 8), the user scenarios were carried out through our Greenspector Test Runner, allowing manual tests to be carried out.

Once the application is downloaded and installed, we run our measurements on the basic and original settings of the application. No modification is made (even if certain options make it possible to reduce the consumption of energy or resources: data saving mode, dark theme, etc. However, we encourage you to check the settings of your favourite application to optimize it. impact.

Each measurement is the average of 5 homogeneous measurements (with a low standard deviation). The consumption measured on the given smartphone according to a Wi-Fi type network can be different on a laptop PC with a wired network for example. For each of the iterations, the cache is first emptied.

To assess the French impacts of infrastructures (datacenter, network) in the carbon projection calculations, we relied on a Greenspector methodology based on real data measured from the volume of data exchanged. This evaluation methodology takes into account the consumption of resources and energy in use for the requested equipment. As this is a very macroscopic approach, it is subject to uncertainty and could be fine-tuned to adapt to a given context, to a given tool. For the Carbon projection, we assumed a 50% projection via a Wi-Fi network and 50% via a mobile network.

To assess the impacts of the mobile in the carbon projection calculations, we measure on a real device, the energy consumption of the user scenario and in order to integrate the material impact share, we rely on the wear rate theory generated by the user scenario on the battery, the first wearing part of a smartphone. 500 full charge and discharge cycles, therefore, cause a change of smartphone in our model. This methodology and method of calculation have been validated by the consulting firm specializing in eco-design, Evea.

In a process of continuous improvement, we are vigilant in constantly improving the consistency of our measurements as well as our methodology for projecting CO2 impact data. Therefore, it is unfortunately not possible to compare a study published a year earlier with a recent study.

Digital sobriety comparison of 3 direct messaging apps for business.

Reading Time: 6 minutes

Introduction

Today and more than ever, communication is essential in business. Since the start of the Covid-19 crisis, many companies and employees have discovered remote work. This exceptional situation has led to a change in our interaction habits: making teams communicate effectively with each other, remotely, instantly. We decided to compare the 3 most popular direct messaging apps for business: Skype, Slack and Teams.

6 scenarios were carried out on the basis of an average user journey:

– Launch of the application
– Opening of a blank one-to-one conversation
– Sending a text message
– Send an image (.jpg)
– Sending an attachment (.pdf)
– Send an animated image or GIF (.gif)

Consult the methodology and the details of the scenarios.

Carbon impact projection

Carbon impact (graph) of apps: Skype, Slack and Teams

During the application launching stage, the carbon impact of Skype (0.038 gEqCO2) and Slack (0.039 gEqCO2) are pretty similar. Teams exchanges 77% more data compared to Skype, therefore increasing its carbon impact where in terms of energy, the Teams application has a consumption similar to the other two apps.

On the part of sending a text message and sending an image, Slack is the most efficient application oscillating between -30% (message) and -60% (image) less than Skype, less good application on these two scenarios.

Generally speaking, Teams consumes a lot more data. Indeed, on average it is nearly 196 KB where Skype is at 134 KB and Slack is at 113 KB.

The application with the best carbon impact average is Slack (0.035 gEqCO2) followed closely by Skype (0.043 gEqCO2) then Teams (0.055 gEqCO2), a difference of 36% between the best and the worst.

Focus on background consumption

On the background idle side of the application, we notice several things:

Slack consumption in IDLE Background

Slack consumption in the background is higher than the other two apps. Especially in terms of data exchanged where Skype and Teams do not exchange any data in this user step. Slack also consumes in terms of CPU (1.16%) where Skype consumes 10x less and Teams is once again at zero. This consumption is not linked to the background setting (state change processing) but lasts over time both on background inactivity states and in foreground inactivity.

AppsEnergy consumption par second (µAh/s)Exchanged Data (KB)CPU (%)
Skype45.1700.11
Slack57.1442.61.16
Teams44.0800

The Slack app performs processing in the background, impacting battery, power and resource consumption throughout the day. If we project this impact for a user who puts his Slack application in the background on his phone for a whole working day (7 hours), we obtain an impact of 26 gEqCO2, or approximately the Carbon impact of an average light vehicle driven in 230 meters! At the scale of the year (220 days): this behavior for a person is equivalent to 50 km of the same vehicle. Probably a mess that could be taken care of and avoided.

Average carbon impact projection of the scenarios

Carbon impact of direct messaging apps user journeys

The scenario with the lowest carbon impact on average of the 3 applications measured is that of opening a conversation (0.018 gEqCO2) consuming 69% less than sending an attachment (0.061 gEqCO2). The step of sending an image is the second least impactful step with + 10% more than opening a conversation. Finally, sending a text message and loading the app are similar in their impact (less than 1% difference).

Disclaimer : Note that these scenarios do not have the same duration.

Scenarios and their duration (in seconds)SkypeSlackTeams
Launch of the application4,524,135,88
Opening a conversation1,761,828,95
Sending a text message33,331,7832,19
Sending an image15,169,0714,46
Sending an attachment10,1312,1310,99

Below, the ranking of applications according to their carbon impact per second.

Carbon impact per second of direct messaging apps

Projected energy consumption of scenarios over 60 seconds

Energy consumption of direct messaging apps

When it comes to the launch of the application, Skype is in the lead with energy consumption of 31 mAh followed closely by Teams (32.8 mAh) then Slack (35.5 mAh). A difference of 12% between the first and the last application for this step.

For the opening a conversation step, Teams (11.3 mAh) is doing well with a lower consumption of 61% compared to Skype and Slack side by side (29 mAh).

For the 3 scenarios of sending a text message, image or attachment, the ranking does not change: Slack remains in the lead followed by Skype and Teams.

In the end, by adding all the steps, the Teams application is the most efficient (71.3 mAh) followed by Slack in second position (85.6 mAh) then Skype, the last one (86.2 mAh).

Remember that this classification is projected over one minute of use. In real time, Slack is the fastest application (11.7 seconds on average scenario completion time), Teams the slowest (14.49 seconds), however Teams is the most sober in terms of downloading speed on the smartphone (237, 7 on average compared to 285.6 for Slack or 287.2 for Skype).

On average, a minute of writing and sending a text message consumes 3.33 mAh, which is 2x less consumption than a minute spent in videoconferencing (audio only: 6.60 mAh).

Slack vs Teams: send a GIF

Slack

Teams

For the same functionality of finding and sending a GIF via Giphy third-party, the two applications Slack and Teams have a different user journey.

In fact, Slack allows, with a simple command, the search and display of a SINGLE GIF via the keywords typed then offers the possibility of loading a new one if the first one is not suitable. The command used is as follows:

/giphy simpson

Teams meanwhile, displays a search bar that displays new GIFs with each new letter typed. So unnecessarily. loading dozens and dozens of GIFs. After typing the entire keyword “simpson”, the results window will always display a number. For this scenario, we have chosen to select the first gif from the results.

We therefore observe a difference between the two applications:

ApplicationsDuration of the scenario
(in second)
Energy consumption
(mAh)
Exchanged data
(Mo)
Carbon impact projection
(gEqCO2)
Slack24,842,370,3090,065
Teams24,423,9232,336

We can see that the Slack user journey is much more energy and resource efficient than that of Teams. Especially for the part of the data exchanged (a difference of more than 22 MB!), Which can be explained by the quantity of GIFs unnecessarily loaded by Teams.

The difference in power consumption between these two apps is 40% for a similar scenario duration. The carbon impact is multiplied by 36 for the Teams application compared to Slack.

For each of its applications, measured on an S7 smartphone (Android 8), the user scenarios were carried out through our GREENSPECTOR Test Runner, allowing the performance of automated tests.

Details of the scenarios:

  • Launch the application
  • Opening a one-to-one conversation
  • Sending a 28 character text message “Hello this is a test message”
  • Sending an image (.jpg): 32 KB (350×350)
  • Sending an attachment (.pdf): 188Kb – generated from a Word text file (A4 format)
  • Sending an animated image or GIF (.gif): GIF used for Slack – 225Ko – 500×375; GIF used for Teams – 600Kb – 500×352

Each measurement is the average of 3 homogeneous measurements (with a low standard deviation). The consumption measured on the given smartphone according to a wifi type network can be different on a laptop PC with a wired network for example. For each of the iterations, the cache is first emptied.

To assess the impacts of infrastructure (datacenter, network) in the carbon projection calculations, we relied on the OneByte methodology based on real data measured on the volume of data exchanged. This assessment methodology takes into account the consumption of resources and energy in use for the requested equipment. As this is a very macroscopic approach, it is subject to uncertainty and could be fine-tuned to adapt to a context, to a given tool. For the Carbon projection, we assumed a 50% projection via a Wi-Fi network and 50% via a mobile network.

To assess the impacts of the mobile in the carbon projection calculations, we measure the energy consumption of the user scenario on a real device and in order to integrate the material impact share, we rely on the theoretical wear rate generated by the user scenario on the battery, the first wearing part of a smartphone. 500 full charge and discharge cycles therefore cause a change of smartphone in our model. This methodology and method of calculation have been validated by the consulting firm specializing in eco-design : Evea.

The carbon impact of Instagram app features

Reading Time: 4 minutes
Instagram logo

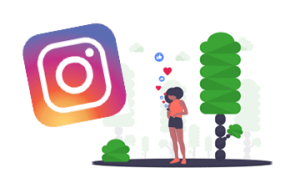
Have you ever wondered what the environmental cost of a post, a story, watching a live or Instagram feed?

The application launched in 2010 has 1 billion monthly active users (Source) including 28 million unique visitors per month. In France, there are 11 million unique visitors per day. Instagram is the most frequented social network behind Facebook.

For this study, we chose to measure the carbon impact, energy consumption, and data on 5 user journeys on the Instagram mobile application (version 148.0.0.33.121):

  • The publication of a photo in story
  • The publication of a photo with filter and description in profile
  • Viewing a live Instagram
  • Hosting a live Instagram
  • Scrolling the news feed

The carbon impact of Instagram features per 1 minute unit of time

carbon-impact instagram

The feature that has the least impact on the environment over one minute is the photo publication (0.154 gEqCO2), this is the carbon equivalent of 1.3 meters made by a light vehicle/minute. This feature consumes 10 times less than the most impactful of our measures.

The most impactful feature over one minute is that of the scrolling of the newsfeed (1.549 gEqCO2). Over one minute, it is the equivalent of 13 meters done in a light vehicle. Composed of photos, videos, and advertisements (for an active account), the functionality does not consume the most energy (see following graphs), but in terms of the data exchanged, it is the one that displays the highest value (14.63 MB for one minute).

Regarding the Live feature, whether it is on the viewer or host side, the impact is almost the same (13% less for the viewer). The energy consumption is similar, however, the spectator part exchanges fewer data.

If we consider that the average carbon impact of Instagram is 0.664 gEqCO2 / minute (unweighted average of these 5 uses) and that its users spend an average of 28 minutes / day on the social network (Source). So the average impact of a user on Instagram is 18.6 gEqCO2 / day, the equivalent of 166 meters traveled by a light vehicle.

Average Instagram app carbon impact per day and per user

Energy consumption of Instagram features for 1 minute

energy consumption of instagram features

Posting a photo on your Instagram account consumes 1.8 times less energy than posting a photo as a Story (reduced to a one-minute user journey) and 2.4 times less than hosting a Live. The live features are very consuming here since it is a continuous video stream.


Data exchanged from Instagram features for 1 minute

exchanged data from instagram features

The association of photos, videos and advertisements of the newsfeed feature greatly impacts its data exchange since it has to load new elements when scrolling. It also consumes 2.6 times more data than hosting a live and 16 times more than publishing a photo (user journeys reduced to one minute of use) /


Methodology

The application is measured on an S7 smartphone (Android 8), the user scenarios were carried out through our GREENSPECTOR Test Runner, allowing the performance of automated tests.

Each measurement is the average of 3 homogeneous measurements (with a low standard deviation). The consumption measured on the given smartphone according to a Wi-Fi type network can be different on a laptop PC with a wired network for example.

To assess the impacts of infrastructure (datacenter, network) in the carbon projection calculations, we relied on the OneByte methodology based on real data measured on the volume of data exchanged. This assessment methodology takes into account the consumption of resources and energy in use for the requested equipment. As this is a very macroscopic approach, it is subject to uncertainty and could be fine-tuned to adapt to a context, to a given tool. For the Carbon projection, we assumed a 50% projection via a wifi network and 50% via a mobile network.

To assess the impacts of mobile phones in the carbon projection calculations, we measure the energy consumption of the user scenario on a real device and in order to integrate the material impact share, we rely on the theoretical wear rate generated by the user scenario on the battery, the first wearing part of a smartphone. 500 full charge and discharge cycles therefore cause a change of smartphone in our model.


For those who like numbers

Use caseEnergy consumption (mAh)Exchanged data (MB)Memory consumption (MB)Test time (second)Carbon impact (gEqCO2) per minuteEquivalence in meters of average car in France / minute
Create Stories3,320,522410220,2772,47
Publish a photo on your feed4,750,806425590,1541,37
Timeline scrolling9,714,63460631,54913,83
Hosting a live23,8410,554471190,7166,39
Live viewing23,398,785221190,6225,55

The environmental impact of search engines apps

Reading Time: 13 minutes

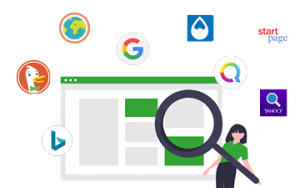
Introduction

Almost 93% of all internet traffic comes from search engines. It is estimated that Google receives 80,000 requests per second or 6.9 billion requests per day. (Source: Blog du modérateur). Globally, if Google holds nearly 91% of the market share, in recent years, new alternative solutions have been trying to disrupt this digital monopoly of internet research.

What are the impacts of our activities on web or mobile search engine applications? What are the most / least impacting solutions for the environment, network congestion, and the autonomy of our smartphones? Moreover, what are the parameters that can vary this impact and how can we, consumers, better limit our impact?

For this study, we chose to measure 8 of the most popular search engine applications in France on the web and mobile versions on Android: Bing, DuckDuckGo, Ecosia, Google, Lilo, Qwant, StartPage, and Yahoo.

Logos applications moteurs recherche

Summary:

  1. Website search vs URL search comparison
  2. Local search comparison
  3. Weather Search comparison
  4. Comparison of a basic search according to several criteria
    (auto-completion, dark theme, newsfeed)
  5. Comparison between search engines using a web browser
  6. Our advice for an eco-responsible search
  7. Methodology

Disclaimer: we only measure the user device activity, its inputs/outputs, and project the network and server impacts on the basis of an average impact methodology (see methodology section). We know that some engines use low-energy servers, optimized cooling, “green” electricity… That others better protect your privacy or even finance associations and important causes … We have not had access to the data center of our respondents, and we, therefore, made assumptions based on activity projections based on the volume exchanged. However, since this is a subject that has a direct economic impact, we could imagine that these companies have designed optimized systems so that the purchase of machines and their operation don’t cost them too much!


Website search vs URL

For this first comparison, two scenarios are carried out here: on the one hand we launch a search for the keyword “Fnac” and on the other we launch a search by URL “Fnac.com”, allowing us to directly access the site, without going through the search results. Only two applications do not permit direct URL access: StartPage and Yahoo. StartPage does not appear in this ranking due to a display fault on the Fnac site.

Carbon impact of a basic search vs URL

This is not a surprise and it is always better to measure it, we observe that a search by URL consumes much less on all the measured search engine applications. On average, there is a 35% reduction in the carbon impact. Therefore, prefer a search by URL (if you know it!) without going through the search results page in order to save energy and data!

For this first comparison, we recommend using Ecosia, which is the most efficient engine here, all research combined (0.167 gEqCO2) with a standard deviation of 0.377 gEqCO2 with the least sober in the DuckDuckGo ranking (0.5433 gEqCO2). The second place goes to Google (0.192 gEqCO2) which consumes 13% more than Ecosia.

These results are nevertheless very disparate between the different solutions since if on Ecosia the 2 types of research have almost the same impact, it is 2.3 times more important for Google and 4.4 times more for Lilo for example.

On a basic search, it will cost you a 50% higher battery impact with DuckDuckGo and 6 times more data received than with Ecosia. Nevertheless, we note that the memory consumption used by Ecosia is 1.5 times greater on the user’s smartphone in this scenario than the average of other engines. On this same route, we can also note that the lowest energy consumption for your batteries is that of Qwant (tied with Ecosia) due to a faster route. Here efficiency and user scenario performance go hand in hand. It should also be noted that for the most-used engine on the planet, Google is also the one that has the most autonomy impact on basic search, 28% more than the average for other engines. Special mention for Yahoo, which manages to reconcile a low impact and lower memory consumption (not taken into account in the calculation of the Carbon impact).

On a URL search, DuckDuckGo‘s carbon impact is 2.2 times higher than the average for other engines and almost 4 times higher than the most virtuous Google in this scenario. This is explained by low power consumption on the user device but above all with a data consumption 7.3 times less than the average of the engines and almost 15 times less than DuckDuckGo! Small consolation for DuckDuckGo, it also consumes the least memory on the user device with 50% less than the engine average and up to 93% less than the most memory-intensive Ecosia in this scenario again.


Local search, the impact of an interactive map

Capture d'écran du scénario de recherche locale

For this scenario, we run a local search. The keywords “Restaurant Nantes” are searched, most search engines then display an interactive map with a selection of restaurants.

Carbon impact of local research

For this local search, four applications stand out by not displaying an interactive map on the results page: Ecosia, StartPage, Lilo (display of a Pages Jaunes list), and Yahoo. Although less practical for discovering the suggestions at a glance, we notice that these applications are less “carbon-intensive”. It is therefore not surprising that the display of a presentation cartographic representation is detrimental to the environmental impact.

If we take the averages of applications that do not display a map (0.076 gEqCO2) to those that display one (0.161 gEqCO2): we obtain a carbon impact difference of 52%. Maybe these solutions could offer a 2-step map display and only display the detailed map on user request?

In this ranking, Ecosia is also in the lead (0.055 gEqCO2) followed closely by StartPage (0.078 gEqCO2). The worst applications are Google (0.178 gEqCO2) and Qwant (integration of a PagesJaunes card, 0.216 gEqCO2).

The difference in carbon impact between the best and worst application is 74%. However and again Ecosia is also the one which consumes the most memory on the user device, 50% more than the average of the engines for a local search. In the end, only StartPage manages to combine a low carbon impact and lower consumption of memory resources.

To explain these differences, we can cite the data impact 10 times higher for Qwant compared to Ecosia and 2.7 times higher compared to the average for other engines. On the energy side, the differences measured are smaller, Google and Yahoo are the worst enemies of your battery and of the carbon impact on the user device with 28% more consumption on average than the average for other engines.


Targeted search, the impact of a weather widget

Capture d'écran du scénario de recherche ciblée météo

For this scenario, we launch a weather search for the keywords “Météo Nantes”. All engines work with a weather widget. Only the Lilo and Qwant engines do not display any and do not allow a direct view of the current weather forecast. However, Qwant displays in partnership with Yellow Pages, the nearest meteorological organization, skewing the results.

Carbon impact of targeted «weather» research

We observe for this search comparison targeted on the weather, that the Lilo application (0.045 gEqCO2) which does not display a weather widget, is at the top of the ranking. Followed by Ecosia (0.062 gEqCO2), the most efficient application of those which display a weather widget. Between Lilo and Ecosia, the difference in carbon impact amounts to 26%.

If we compare Lilo to the average of the applications displaying the weather widget (0.083 gEqCO2), the difference in carbon impact then amounts to 45%.

The most impacting engine with the weather widget is DuckDuckGo (0.118 gEqCO2), which is 1.9 times more than Ecosia.

For Qwant (0.199 gEqCO2), the research is inconclusive since the engine does not display a widget but the nearest weather station in the form of a Pages Jaunes business and cartographic representation. This practice is clearly more consuming/impacting, 2.5 times more impacting than the average of other engines, and 4 times more impacting than the Lilo engine.

Lilo consumes little energy on the user device and little data. On this indicator, it consumes more than 4 times less data than the engine average and up to 11 times less than Qwant!

On the memory footprint and user battery consumption part, for targeted research, it is again the most efficient StartPage app with 47% less than the average energy consumption of other engines but also 44% less memory than the average. Yahoo, Qwant, and Google are also the most energy-intensive with an average consumption higher with 13% more than the other engines. On the memory side, it is again Ecosia which over-consumes with 50% more than the average of its competitors and almost twice as much as DuckDuckGo!


Search of a definition

In this part, we analyze different ways of approaching a basic search for a definition. We have chosen THE most searched definition on Google in 2019 in France, that of the word “Procrastination”. In addition, in order to save you research, we give you the meaning: Procrastination (feminine name) “tendency to postpone, to put systematically to the next day”. We will check the major research trends of 2020 in a future study!

Definition search

Capture d'écran du scénario de recherche de définition du mot procrastination

This scenario will be used as a basis for the next ones, we are launching a search for the keywords “procrastination definition”.

Carbon impact of a basic definition search

For a simple research, our top 3 carbon impact side consists of: Lilo (0.065 gEqCO2), Ecosia (0.068 gEqCO2) and StartPage (0.076 gEqCO2). Qwant is disadvantaged by its excessive data consumption, it is more economical in the energy consumed on the device since second on the energy consumption side.

StartPage, in addition to having a low impact, is also less “resource-intensive” in memory than the other engines and 2 times less than Ecosia, especially on this use case. StartPage is also the most energy-efficient and 2 times less than Yahoo in the same search scenario.

Qwant is again last in this ranking in terms of carbon impact because it is too expensive in terms of data, almost 3 times more than the average for other engines, and up to 6 times more than Ecosia.

On this same basic research and on the basis of the average impact of the 8 engines, the share of the impact linked to the network and to the mobile is preponderant and in equal share compared to the share of impact on the server which remains low.

Part en pourcentage de l'impact lié au réseau, au mobile et au serveur

However, this projection must be the subject of a more in-depth analysis by placing probes in data centers in particular.

On average, the carbon impact for all search engines is 0.106 gEqCO2. Google‘s, the most widely used engine in the world, is 0.108 gEqCO2, or the carbon impact equivalent of one meter (0.96m) carried out in a light vehicle.

If one projects based on Google usage statistics, here are some interesting numbers:

The carbon impact of the 80,000 requests made in 1 second (if all these requests were basic requests launched from a mid-range smartphone) worldwide is: 8,660 gEqCO2, ie the equivalent of 77 km traveled in a light vehicle. The carbon impact of a day of Google queries is a carbon equivalent of 6.7 million km in a light vehicle.

Definition search with autocompletion

Capture d'écran du scénario de recherche de définition du mot procrastination en auto-complétion

For this auto-completion or “suggestion” scenario, we run a search for the “definition pro” keywords, the engine then displays a “definition procrastination” or “definition procrastinate” suggestion. We click on this proposition. To evaluate this scenario, we had to activate a parameter which allowed us to deactivate the auto-completion mode on the different engines, only 2 engines allow it and are therefore compared here on this scenario.

Carbon impact of basic research vs auto-completion

Only two search engine applications allow you to completely remove suggestions or auto-completion (Ecosia and DuckDuckGo). We note that for Ecosia, for equivalent energy consumption, a basic search without suggestions, the consumption of data exchanged is reduced by 11% compared to a search offering suggestions. On the DuckDuckGo side, a search without suggestions reduces energy consumption by 22% and the volume of data exchanged by 14%.

We observe on average that research using auto-completion reduces the carbon impact by 14%.

Definition search with dark theme

Capture d'écran du thème sombre de Qwant

For this scenario, we activate the dark theme from the settings of the only two apps offering it: DuckDuckGo and Qwant and run the same search for the definition of the word procrastination.

Carbon impact of a light theme vs dark theme research

For these two applications offering the dark theme on mobile, on average the dark theme reduces the carbon impact by 3%. And a little more optimized for DuckDuckGo than for Qwant with an 8% gain on the default theme.

Definition search with active newsfeed

Capture d'écran du scénario de recherche avec newsfeed actif

For this scenario, we activate the homepage newsfeed of some applications and compare with the without newsfeed version.

Carbon impact of research without and with active newsfeed

3 applications allow the activation and deactivation of the news feed present on the home page: Google, Bing, and Qwant. This has the effect of increasing the carbon impact of these three applications by only 3% on average, with an average increase in data of 4% on these 3 engines and a slight increase in local energy consumption. (1%)


Search with a web browser

Capture d'écran de l'application Chrome

For this scenario, we launch the Chrome web browser (version 83.0.4103.106), the measured search engine is previously defined as the default one. The search for definition is always that of the word procrastination.

Carbon impact of an application vs web search

We chose to compare an app search and a browser search. For this measurement, we have chosen the Chrome browser, you can find our “best browsers to use in 2020” study if you’re looking for a browser ranking. For two of the applications measured: DuckDuckGo and Bing, searching via Chrome is less impactful on average by 8%. For the other applications, for which browsing on Chrome is more impactful, this is an average difference of 116% but which goes up to multiply the impact by 5.3 for Lilo. Overall and on average, search through a browser on all of these engines is 64% more impactful than through the mobile application.

For all of these engines,

  • energy consumption is stable and slightly lower on the web by 2% but with large disparities: + 48% for StartPage and minus 28% for Yahoo.
  • Data consumption is growing sharply for web research, with a volume that doubles (+ 119%). There is a strong contrast, however: when Bing consumes 12% less (the only less “data-consuming”), others consume more with a peak for Lilo in particular (13 times more) and Ecosia (4 times more). Google remains in the average of 2 times more data on the web version.
  • Local memory consumption also increases significantly for a mobile web search versus mobile application search with + 48%. Again, there is a strong contrast with Ecosia last on this criterion for the mobile application and first on this web search criterion with a decrease of 2%. For all the others, it is a strong increase within particular for DuckDuckGo (+ 115%) and StartPage (107%).
  • Note that travel times have decreased by 6% partially explaining lower energy consumption in web search.

Our advice for eco-responsible search

When we observe the environmental impact of a search, it is difficult to give with certainty the best advice, a link saved in your favorites to go directly to the right information, good content will always have less impact than launching a new search. We have not tested other related areas such as the security/use of your data or the accessibility of solutions, here is some information that we could summarize:

Conseils de GREENSPECTOR pour une recherche éco-responsable
  • A shorter search process results in less energy/battery impact on your user’s smartphone and can help reduce the overall carbon impact across the chain.
  • The carbon impacts of our research are mainly distributed between the network part and the user’s mobile part equally.
  • A search has more impact via a mobile browser than with a mobile application (64% carbon gain on average).
  • For the engines with the least carbon impact, opt for StartPage or Ecosia even if the latter consumes a lot of memory, a point to correct.
  • To save your battery and your data plan, choose StartPage.
  • If you’re having memory issues on an older smartphone, give DuckDuckGo a try.
  • If you don’t see a need for it, turn off newsfeed widgets, interactive map display, and other weather widgets. Average carbon gain of 48% to 52%.
  • Switch to dark to light displays, when available. Average carbon gain of 3%.

As for Google, which dominates the market, it is in the average carbon footprint but is also the one that on average consumes the most memory (40% more than other engines for all of these uses). Let us keep in mind that an average google request is equivalent to the carbon impact of a journey of 1 meter in an average light vehicle.


Methodology

For each of its applications, measured on an S7 smartphone (Android 8), the user scenario was carried out through our GREENSPECTOR Test Runner, allowing the performance of automated tests.

Each measurement is the average of 4 homogeneous measurements (with a low standard deviation). The consumption measured on the given smartphone according to a wifi type network can be different on a laptop PC with a wired network for example.

To assess the impacts of infrastructure (datacenter, network) in the carbon projection calculations, we relied on the OneByte methodology based on real data measured on the volume of data exchanged. This assessment methodology takes into account the consumption of resources and energy in use for the requested equipment. As this is a very macroscopic approach, it is subject to uncertainty and could be fine-tuned to adapt to a given context, to a given tool. For the Carbon projection, we assumed a 50% projection via a wifi network and 50% via a mobile network.

To assess the impacts of mobile phones in the carbon projection calculations, we measure the energy consumption of the user scenario on a real device and in order to integrate the material impact share, we rely on the theoretical wear rate generated by the user scenario on the battery, the first wearing part of a smartphone. 500 full charge and discharge cycles, therefore, cause a change of smartphone in our model. This methodology and method of calculation have been validated by the consulting firm specializing in eco-design Evea.

Search engineVersionWeight (MB) Samsung S7Playstore gradeDownloadsFrench Market Share (%)
Bing11.3.2820730292,84,55 000 000+3,83%
DuckDuckGo5.55.134,14,710 000 000+0,86%
Ecosia3.8.11374,65 000 000+1,11%
Google11.10.11.214184,35 000 000 000+ 91,68%
Lilo1.0.2286,74,3100 000+N/C
Qwant3.5.01794,01 000 000+0,79%
StartPage2.1.574,4500 000+N/C
Yahoo5.10.51114,31 000 000+1,32 %

What’s the carbon impact for social network applications?

Reading Time: 6 minutes

The stay-at-home context has mechanically increased the mobile applications use of the social network type in order to keep people connected. Like the professional use of videoconferencing tools, these uses have brought additional pressure on the network and on the servers of these solutions.

What are our activities impact on social networks? What are the most / least impactful solutions for the environment, network congestion and the autonomy of our smartphones?

For this study, we’ve chosen to measure the news feed of the 10 most popular social media applications: Facebook, Instagram, LinkedIn, Pinterest, Reddit, Snapchat, TikTok, Twitch, Twitter and Youtube. Although these applications are different in terms of functionality, we have chosen to compare them in terms of carbon impact, energy consumption and data exchanged.

For each of its applications, measured on an S7 smartphone (Android 8), the user scenario lasting 1 minute was carried out through our GREENSPECTOR Test Runner, allowing manual tests to be carried out. For each of its applications, the user scenario corresponds to a scrolling of the contents of the news feed of an active account.

Each data measurement is the average of 3 homogeneous measurements (with a small standard deviation). The consumption measured on the given smartphone according to a wifi type network can be different on a laptop PC with a wired network for example.

To make Carbon projections to assess the impacts of infrastructure (data center, network), we relied on the OneByte methodology based on real data measured by the volume of data exchanged. This evaluation methodology takes into account the consumption of resources and energy in use for the equipment requested. As it is a very macroscopic approach, it is subject to uncertainty and could be refined to adapt a context, a given tool. For the Carbon projection, we have assumed a projection of 50% via a wifi network and 50% via a mobile network.

To make the carbon projection of the mobile, we measure both the energy consumption linked to the use case based on real measurement on real device and to integrate the share of material impact, we rely on the rated theoretical wear and tear generated by the use case on the battery, the first wearing part of a smartphone. 500 cycles of full charges and discharges therefore cause in our model a change of smartphone.

Projected data measured in Carbon impact (gEqCO2)

Youtube (0.66 gEqCO2) is first in the ranking, followed closely by Facebook (0.73 gEqCO2) and LinkedIn (0.75 gEqCO2). This is easily explained, since the only videos launching during the news feed for Youtube are thumbnails and this, after 2 seconds. It should be noted that in our test, the scanning of the news feed was slow enough to launch videos according to this principle of tempo.

On the Environmental Impact side of applications, the social network whose news feed is the most impacting is Tik Tok. Unsurprisingly, this social network is based exclusively on watching videos and preloading videos from the news feed at startup. The Shift Project also presents streaming platforms such as Netflix, Youtube and Tik Tok as being responsible for 80% of digital electricity consumption. We had already noted this significant impact, in particular when the application was launched in 2019.

Only 4 applications (Tik Tok, Reddit, Pinterest and Snapchat) are above the average carbon impact (2.1 qEqCO2) observed for this comparison of the news feed. Moreover, the Tik Tok news feed has a carbon impact of 7.4 times greater than that of Youtube.

What if we were to project all of this at the user level?

If we projected this usage “display and progress of the news feed” as being representative over the duration of daily usage/user, we will obtain this data.

According to the Global Web Index 2019, we spend on average 2 hours and 22 minutes on social networks. If we project the average carbon impact of the 10 applications measured (2.10 gEqCO2) over 60 seconds at the average time spent per user, we obtain for a user/day: 280.5 gEqCO2. Or the equivalent of 2.50 km traveled in a vehicle. This also corresponds to 102 kgEqCO2 per user per year, the equivalent of 914 km traveled by medium vehicle in France. This is equivalent to 1.5% of the carbon impact of a French person (7 Tons).

And globally?

If we projected this usage “display and progress of the news feed” as being representative over the duration of daily usage/user, we will obtain this data.

The 2019 figures of LyfeMarketing and Emarsys announce 3.2 billion social network users (42% of the world population) of which 91% access social networks via a mobile device. 80% of the time spent (2 hours and 22 minutes) on social networks is spent on a mobile device. If we project our carbon/user impact to these data, we obtain: 262 million Tons EqCO2 per year for the 3.2 billion users on mobile, the equivalent of 56% of EqCO2 impacts in France.

Energy consumption measurement (mAh)

In terms of energy consumption, the bad students are the news feeds of the Snapchat, Tik Tok and Pinterest applications. The good energy students are Youtube, LinkedIn, and Reddit. The Snapchat news feed consumes 1.6 times more energy here than that of Youtube.

The average established for energy consumption is 10.6 mAh, only 4 applications are above.

If we assume that the application runs continuously on the smartphone, then we can project the remaining battery life time (graph below). We can observe that with Snapchat running, the battery lasts 3.45 hours. On the Youtube side, the battery autonomy lasts 5.46 hours, i.e a ratio of 1.5 (or a difference of 2 hours) between the best and the least good application of this ranking. The average is 4.8 hours for all of these applications. The reference measurement of the test smartphone is 1.32 mAh, its battery capacity of 3000 mAh, we can estimate its autonomy at 18 hours. The use of social networking applications therefore greatly impacts your battery life.

Measurement of data exchanged (MB)

In terms of data exchanged, the bad students are the news feeds of the Tik Tok, Reddit and Pinterest applications. The good students on the data exchanged side are Youtube, Facebook and LinkedIn. Tik Tok consumes 9 times more data than the Youtube application.

The average established for the data exchanged is 19.2 MB for this use. Beware of your data plans! Projection in 1 month, you will have consumed 74 GB!

Taking into account the real average time spent by social network according to the Visionary Marketing blog: if you only use Tik Tok in social network (up to 52 minutes per projected day), you will consume nearly 71 GB per month, while Instagram (up to 53 minutes a day) will consume 25.6 GB! Are you more connected to Facebook? This will make you consume almost 10 GB (up to 58 minutes per day) per month.

For those who like numbers

ApplicationVersionDownloadsGoogle Play Store GradeEnergy consumption (mAh)Data exchanged (MB)Memory consumption (MB)Carbon Impact (qEqCO2)
Facebook270.1/0.66.1275 000 000 000+4,29,551845870.73
Instagram142.0.34.1101 000 000 000+4,510,917,2503,21.91
LinkedIn4.1.451 500 000 000+4,39,26,15492,40.75
Pinterest8.17.0100 000 000+4,611,133,2432,73.53
Reddit2020.18.010 000 000+4,69,243,4414,04.54
Snapchat10.82.5.0 1 000 000 000+4,314,418505,82.03
Tik Tok16.0.43 1 000 000 000+4,312,146,9385,54.93
Twitch9.1.1100 000 000+4,69,69,4374,41.09
Twitter8.45.0 500 000 000+4,510,76,6421,10.83
Youtube15.19.34 5 000 000 000+4,19,15,1379,30.66

GREENSPECTOR, member of the Solar Impulse label Efficient Solutions

Reading Time: 2 minutes

GREENSPECTOR is proud to be an efficient solution member of the Solar Impulse label, one of the first labels to recognize positive impact companies.

“We are very proud to be part of this selection of 1000 solutions to save the planet. The digital industry is increasingly polluting and needs tools to reduce its impact. Greenspector has developed a tool that enables the eco-design process to be mastered to limit the energy-resource impact by being integrated into the manufacturing process of the digital service.

Being labeled by the Solar Impulse foundation is a tremendous recognition for our project which has animated the entire GREENSPECTOR team for almost 10 years and which materialized in 2016 with a solution launched on the market. It is also for the future a good proof that our solution and our associated expertise will bring a positive impact for the planet and a benefit for our customers anxious to integrate resource management for an eco-responsible, sober and inclusive digital.”

Thierry LEBOUCQ
Président de GREENSPECTOR

About the Solar Impulse Foundation

Founded in 2018 by Bertrand Picard, the Solar Impulse Foundation has set itself the challenge of identifying 1,000 efficient solutions for the planet. The Solar Impulse label rewards efficient, clean and profitable solutions with a positive impact on the environment and quality of life. In collaboration with renowned institutions, solutions applying to the Label must go through a neutral and certified methodology based on the following 5 criteria broken down into three themes of feasibility, environmental impact and profitability :

  1. Credibility of the concept
  2. Scalability
  3. Environmental benefits
  4. Customer economic incentive
  5. Profitability of the vendor

The Solar Impulse Foundation has received broad support from institutions including the UNFCCC, the European Commission, the International Renewable Energy Agency (IRENA) and the International Energy Agency (IEA).

For more information, visit: https://solarimpulse.com

Facebook app vs Facebook web

Reading Time: 3 minutes

For this week’s battle, we are comparing the Facebook application with its web version on Chrome. Note that the measurements were taken from an account connected to the social network.

L’application Facebook created in 2014 and founded by Mark Zuckerberg is an online social network that allows its users to post images, photos, videos, files and documents, exchange messages, join and create groups and use a variety of applications. In 2017, the social network had more than 2.1 billion subscribers.

The fight

All the lights are now turned on the fighters and the match can finally begin.

In the first part of the battle to measure the impact of the launch phase of the application, on this side it is the web version of Facebook (2.48 mAh) which wins the first round by consuming 30% less than the application (3,28 mAh). During the second round which corresponds to the usage scenario, it is the application version (10.13 mAh) which leads to that of the web (21.52 mAh) with a energy consumption lower than 53%. To put an end to this confrontation, we have set up two decisive rounds of observation of the rest phases of each opponent. The web version displays a consumption of less than 30% for the inactivity phase in the foreground but is the most consuming side of the inactivity phase in the background with 3% more than the application version.

The bell rings, end of the match!

The winner

It’s the web version of Facebook that wins this match. The Facebook application is the best in terms of energy consumption, with an overall score of 14.06 mAh to 26.33 mAh, i.e. 39% less battery consumption compared to its web version. However, the web version on Chrome displaying Facebook consumes 71% less data on the user scenario side.

If we project the journey for one minute in carbon impact, the Facebook application consumes 1.42 gEqCO2 or the equivalent of 12.71 meters made in a light vehicle against 1.06 gEqCO2 for the web version or the equivalent 9.48 meters. It is therefore the web version of Facebook that should be preferred!

For those who like numbers

ApplicationVersionDownloadsPlaystore gradeApp weighting (MB)Exchanged data (MB)Memory consumption (MB)Energy consumption (mAh)Carbon Impact (gEqCO2)
Facebook269.0.0.50.1275 000 000 000+4.322712.56321.4516.061.42
Facebook via Chrome81.0.4044.1385 000 000 000+4.32207.35781.8126.331.06

The measurements were carried out by our laboratory on the basis of a standardized protocol, respecting a specific user scenario (launch of the app, timeline scrolling). The other scenarios are the launch of the application (20”), inactivity in the foreground (20”) and inactivity in the background (20”). This methodology makes it possible to estimate the embedded application complexity and its energy impact during the use phase.

The Carbon Impact calculation is based on a projection according to the OneByte methodology of the Shift Project for the server and network part. Assumption calculated according to network and datacenter impact in France, for network connectivity 50% Wi-Fi, 50% mobile network, device life based on 500 full charge / discharge cycles.


Retrouvez la battle de la semaine dernière : Petit Bamboo vs Meditopia Des idées de battles ? Contactez-nous !