Sobriété des applications
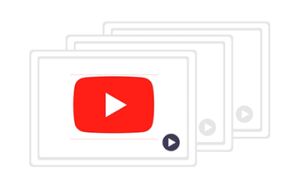
1 hour of Netflix viewing is equivalent to 100 gEqCO2. So what?
Netflix, along with others like the BBC, has researched, with support from the University of Bristol, the impact of its service. The precise figures and
Netflix, along with others like the BBC, has researched, with support from the University of Bristol, the impact of its service. The precise figures and
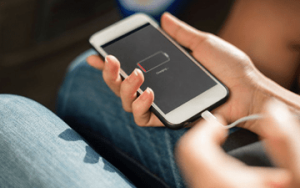
User terminals: the high environmental impact of the manufacturing phase User terminals are now the biggest contributors to the environmental impact of digital technology and
Everyone is talking about digital sobriety. From web agencies to politicians, including ESNs, all communicate on the subject, on the explanation of the impact, on
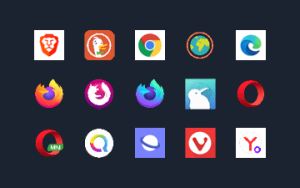
The internet browser is the most important tool on a mobile device. It is the engine for browsing the internet. No longer just for websites

Introduction This study was carried out by Greenspector, a company specializing in the impact of digital technology, and EVEA, specializing in analyzes of the environmental
Third-party service integration makes it easy to quickly add functionality to a site such as a video or social network integration (see the case of

The GREENSPECTOR team is proud to announce the release of its new release: version 2.6.0 Quinoa!
The 2021 edition of this ranking is available! Read the study The web browser is a main tool on a mobile device. Not only for
The GREENSPECTOR team gladly announces its newest release is ready : version 2.3.0 Nopal! Details on improvements below.