Postal services around the world are changing. Digital has gone through this … the traditional mail business is only 28% for La Poste Group in France. New businesses all based on digital tools are being validated or deployed to take over and allow new levers of growth and profitability for these organizations that have often lived on monopoly situations. All this digital transformation is accompanied by a societal transformation and a consideration of environmental issues.
Where are these companies in this transformation? Few indices or indicators of concrete results of this triple transformation. The website of these organizations is a “visible” symbol of this transformation. The site:
- Is it inclusive (People), do you need a lot of resources to navigate and do you put a lot of people in the service?
- is he sober (Planet), consumes a lot of energy on a device, a lot of requests on our servers, a lot of data on networks
- Is it powerful (Profit)? Is it displayed quickly?
Admittedly, the perimeters of postal activity in the world vary significantly from one country to another in the context of this economic transformation. Admittedly, the proposed benchmark is not exhaustive and does not measure all the pages of the site. It nevertheless allows to get a good idea of the level of maturity of digital eco-design.
Synthesis of results by Greenspector ECOSCORE
The Ecoscore takes into account the energy consumption, the memory used, the data exchanged, the number of queries and other metrics that contribute to the level of eco-design of a Web to a score of 100 for a website or a page. It is a perfect synthesis of this study and all the indicators presented below that will make it possible to explain the main points of work to analyze and improve.
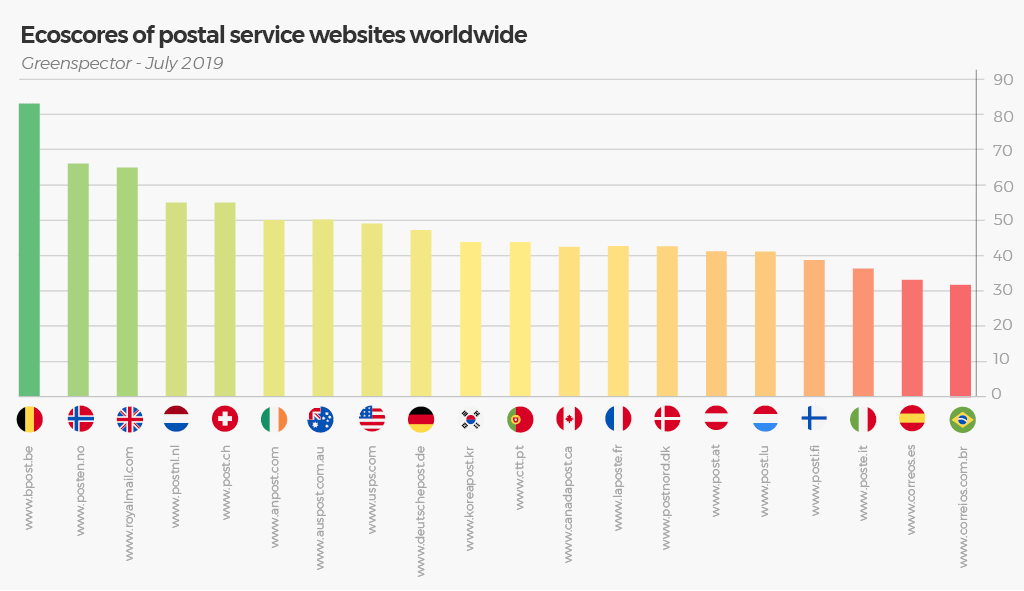
An excellent result for Belgium, example of sobriety on all the fields and which surpasses all the other countries in our benchmark. Good job for Norway and Great Britain ! To be improved for South Korea, Portugal, Canada, France, Denmark, Austria, Luxembourg and Finland. France in the second third must progress on this topic of digital eco-responsibility. Last rankings for Italy, Spain and Brazil.
The energy consumption of a website:
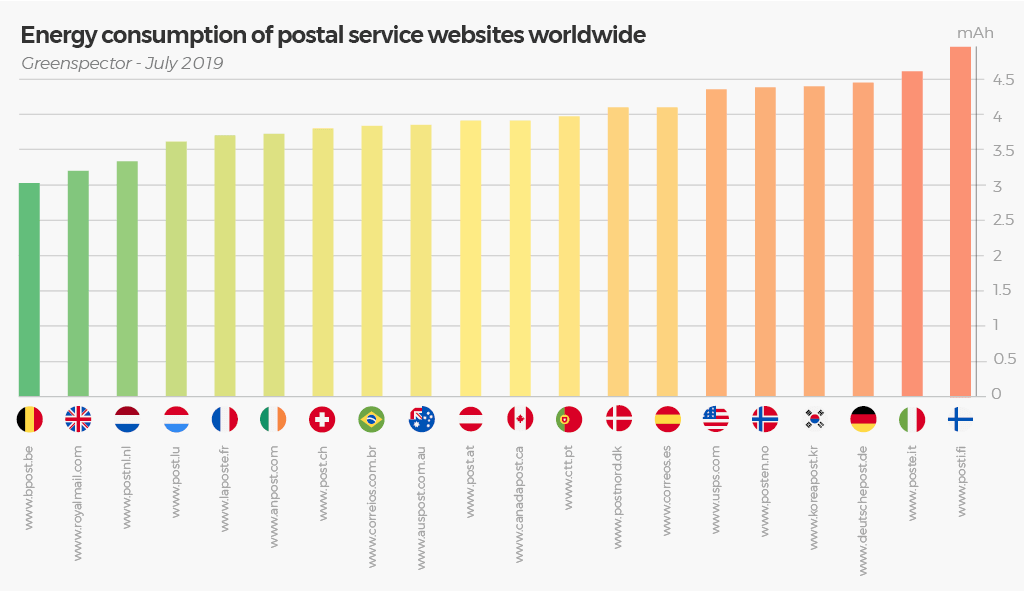
This energy consumption will vary between 3 and 5 mAh, or 66% difference on a simple scenario between the Belgian website and the Finnish website. Note that the distribution is rather homogeneous and that the average is about 4 mAh. The French Post is in 5th place with 3.71 mAh.
Data exchanged:
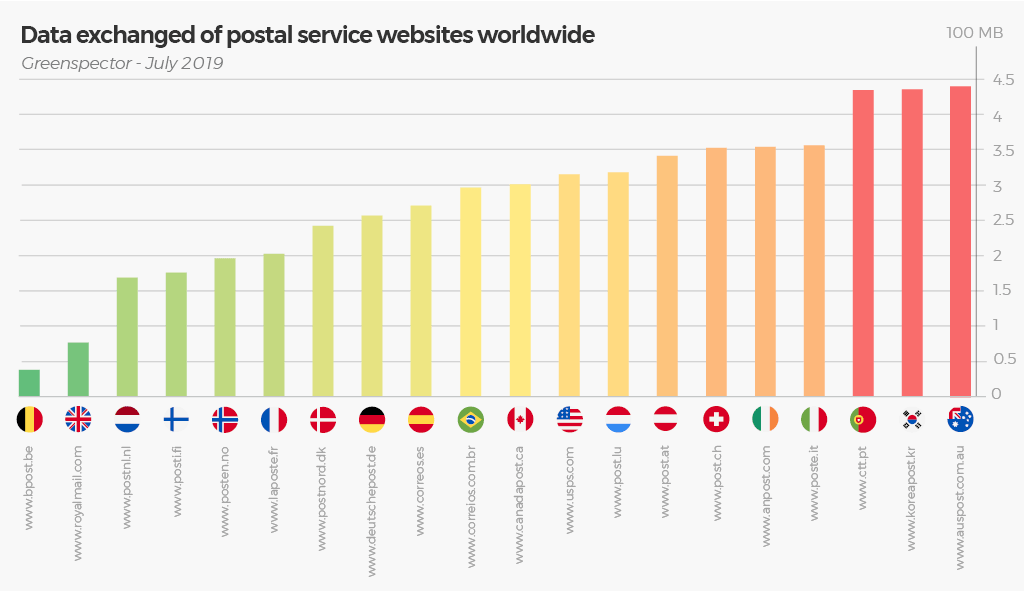
The difference is very important between the less and the more “voracious in data”. we can divide by 11 between the Belgian Post Office (0.38 MB) and the Australian Post (over 4.4 MB). The French company ranks 6th.
Memory Consumption:
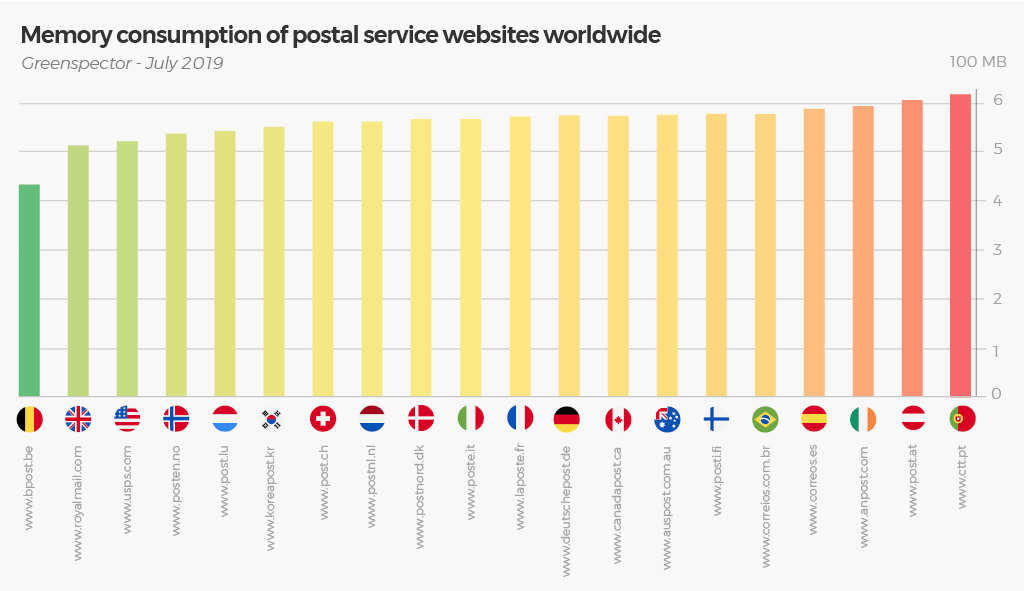
Belgium still has the place of honor in this classification with a consumption very lower than all other websites with a small difference between the best and the last, Portugal (42%) but a gap of 20% between the second and the last. latest. France ranks in 11th position.
CPU Consumption:
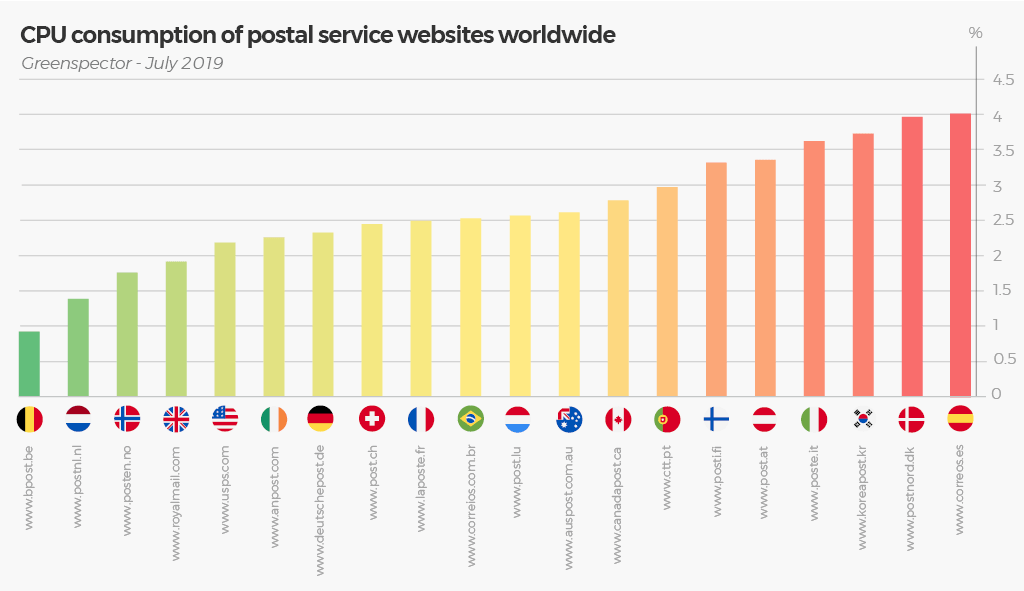
A significant consumption ratio between the first, Belgium and the last Spain (ratio of over 4). France ranks 9th.
The number of requests sent to the data centers:
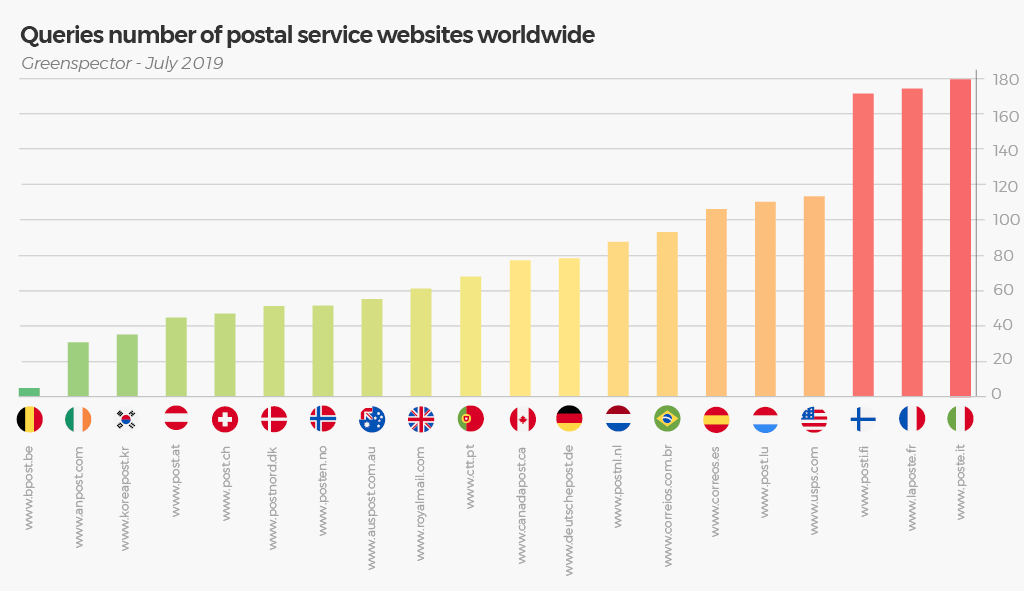
An important ratio between the first, Belgium and the last, Italy with a ratio of 36! Many requests for Finland (171), France (174) and Italy (180). France and Finland share the last places with about 10 kb of data averaged per query versus 117 kb on average for Ireland. The number of requests is a factor increasing the consumption on the device of the user but also on the solicitation of the servers. Objective: group queries to limit the consumption.
Table of raw results:
| Countries | Websites | Energy consumption (mAh) | Data exchanged (100 MB) | Memory consumption (100 MB) | Number of queries | CPU (%) | Ecoscore (on 100) |
|---|---|---|---|---|---|---|---|
| Germany | www.deutschepost.de | 4,4 | 2,5 | 574,4 | 78 | 2,3% | 47 |
| Austria | www.post.at | 3,9 | 3,4 | 604,6 | 45 | 3,3% | 41 |
| Australia | www.auspost.com.au | 3,8 | 4,4 | 575,5 | 55 | 2,6% | 50 |
| Belgium | www.bpost.be | 3 | 0,3 | 433,2 | 5 | 0,9% | 83 |
| Brazil | www.correios.com.br | 3,8 | 2,9 | 579,4 | 93 | 2,5% | 32 |
| Canada | www.canadapost.ca | 3,9 | 3 | 575,2 | 78 | 2,7% | 43 |
| South Korea | www.koreapost.kr | 4,3 | 4,3 | 552,2 | 35 | 3,7% | 44 |
| Spain | www.correos.es | 4,1 | 2,7 | 587,6 | 106 | 3,9% | 33 |
| Danemark | www.postnord.dk | 4,1 | 2,4 | 567,5 | 51 | 3,9% | 42 |
| Finland | www.posti.fi | 4,9 | 1,7 | 578,4 | 171 | 3,3% | 39 |
| France | www.laposte.fr | 3,7 | 2 | 572,7 | 174 | 2,4% | 43 |
| Great Britain | www.royalmail.com | 3,2 | 0,73 | 514,2 | 61 | 1,9% | 65 |
| Irland | www.anpost.com | 3,7 | 3,5 | 594,7 | 31 | 2,2% | 50 |
| Italy | www.poste.it | 4,6 | 3,5 | 568,2 | 180 | 3,6% | 36 |
| Luxembourg | www.post.lu | 3,6 | 3,1 | 544,0 | 110 | 2,5% | 41 |
| Norway | www.posten.no | 4,3 | 1,9 | 537,8 | 51 | 1,7% | 66 |
| Netherlands | www.postnl.nl | 3,3 | 1,6 | 562,8 | 88 | 1,3% | 55 |
| Portugal | www.ctt.pt | 3,9 | 4,3 | 618,6 | 68 | 2,9% | 44 |
| Swiss | www.post.ch | 3,8 | 3,5 | 561,5 | 47 | 2,4% | 55 |
| USA | www.usps.com | 4,3 | 3,1 | 522 | 113 | 2,1% | 49 |
| Average | 3,9 | 2,7 | 561,2 | 82 | 2,6% | 47,9 | |
| Min | 3 | 0,3 | 433,2 | 5 | 0,9% | 32 | |
| Max | 4,9 | 4,4 | 618,6 | 180 | 3,9% | 83 |
This test was performed under the following conditions:
- Measured the 06/28/2019 on real device Galaxy S7 (Android 8)
- Private Wi-Fi network, Chrome browser
- Protocol used 1 minute and 10 seconds of test on the homepage: 20 seconds of loading, 20 seconds of idle foreground, 10 seconds of scroll, 20 seconds in idle background.
