1 hour of Netflix viewing is equivalent to 100 gEqCO2. So what?
Netflix, along with others like the BBC, has researched, with support from the University of Bristol, the impact of its service. The precise figures and the methodology will be published soon, but it appears that one hour of viewing Netflix is equivalent to 100 gEqCO2.
When the communication was released, several digital players took up this figure, but, in my opinion, not for good reasons. Communicating the impact of video through The Shift Project emerges as a systematic point of debate. As of March 2020, the Shift post had been widely disseminated in the media with a significant evaluation error. This error had been corrected in June 2020 but the damage was already done.
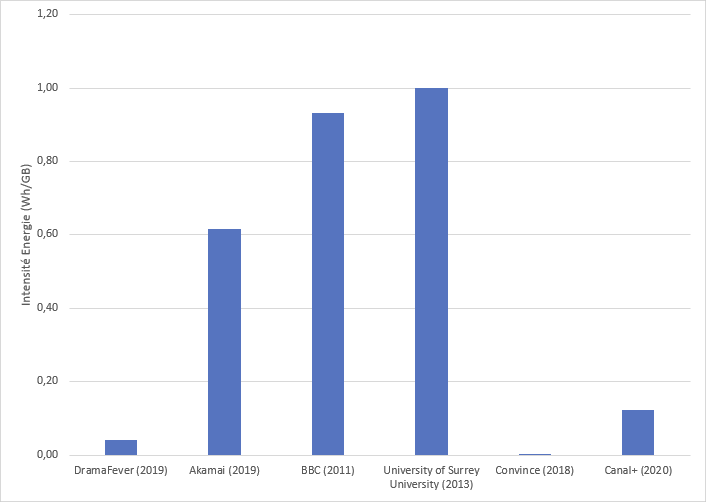
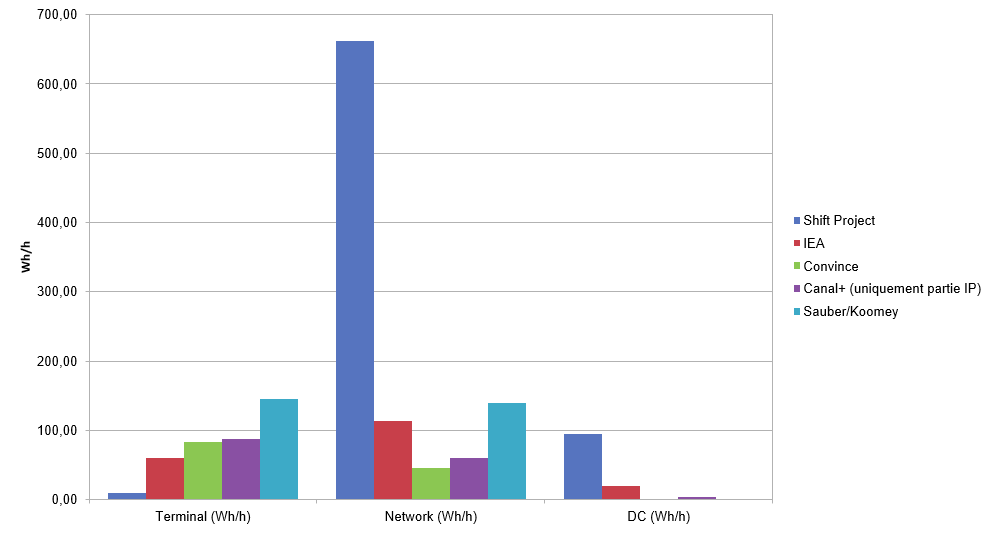
In this context, the IEA carried out a contradictory analysis on the subject. In the end, many studies on the impact of the video came out (IEA, the German Ministry of the Environment, ourselves with our study on the impact of playing a Canal + video). It is always difficult but not impossible to compare the figures (for example, whether or not the manufacturing stage is taken into account, the representativeness of the terminals, the different infrastructures, and optimizations between players, etc.), however, if we take things comparable, all studies have similar orders of magnitude. By taking the correction for the Shift Project error (Ratio 8 resulting from an error between Byte and Bit), the numbers are also close.
What do the studies say?
But beyond the discussions on the numbers, if we examine the studies in detail, the conclusions point in the same direction:
“Set against all this is the fact that consumption of streaming media is growing rapidly. Netflix subscriptions grew 20% last year to 167m, while electricity consumption rose 84%.”
“What is indisputable is the need to keep a close eye on the explosive growth of Netflix and other digital technologies and services to ensure society is receiving maximum benefits, while minimising the negative consequences – including on electricity use and carbon emissions.”
“Netflix isn’t the only company using DIMPACT right now, either. The BBC, ITV, and Sky are also involved. A spokesperson from ITV says that, like Netflix, the tool will help it to find and target hot spots and reduce emissions. Making such decisions based on accurate data is crucial if digital media companies are to get a grip on their carbon footprints.”
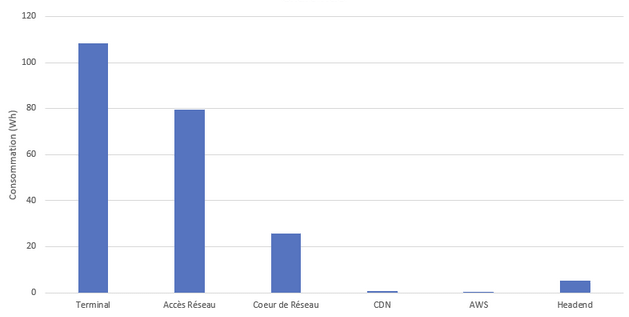
“This work allows us first of all to identify the technical projects to prioritize to minimize the carbon footprint of myCANAL video consumption as much as possible. At the same time, the lessons guide us on the awareness messages to relay to our users, throughout our future developments. This commitment to cooperation between our technical developments and our users is the key to consumption that has less impact on the environment. “ (Testimony of the CDO of Canal +, Greenspector study of the impact of playing a video)
“The most recent findings now show us that it is possible to stream data without negatively impacting the climate if you do it right and choose the right method for data transmission”.
Are the discussions going in the right direction?
The errors of some studies did not help calm the discussions. Neither does the media coverage of these figures. However, we should not be fooled, saying that digital technology has an impact is not necessarily well accepted by all players. This can be a nuisance for a field that for 30 years has been accustomed to a development paradigm without very little constraint and above all very little interest in internal environmental issues. Let us remember that Moore’s Law, which governs this digital world a great deal, is a self-fulfilling prophecy and not a scientific law: the industry is putting in place financial and technical means so that the power of processors increases regularly. We must not be fooled because focusing on certain errors allows the problems to be ignored. I have seen only quotes from the Shift Project error in Netflix’s DIMPACT ad but no quotes about Netflix’s desire to measure and reduce its impact. We must accept the mistakes of the past if we are to move forward on this subject. The study of the Shift has the merit of bringing to the fore an issue that was difficult to be seen. And also accept these own mistakes, how many digital promises have not been (yet) proven? Have the positive digital externalities been scientifically quantified by a sufficient number of studies? This latest analysis shows that the few existing studies (Mainly 2 Carbon Trust studies and the GSMA) deserve much more work to confirm the huge announced benefits of digital technology.
“The study of claims of positive impacts of digital on the climate leads to the conclusion that these cannot be used to inform policy decisions or research. They are based on extremely patchy data and assumptions that are too optimistic to extrapolate global estimates. In addition, the two reports studied do not see the avoidances in the same sectors, or even contradict each other.“
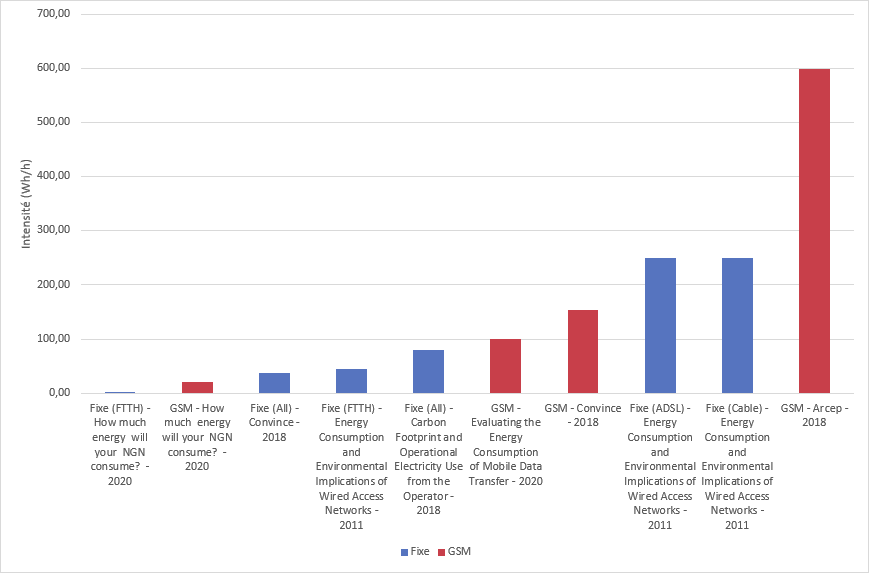
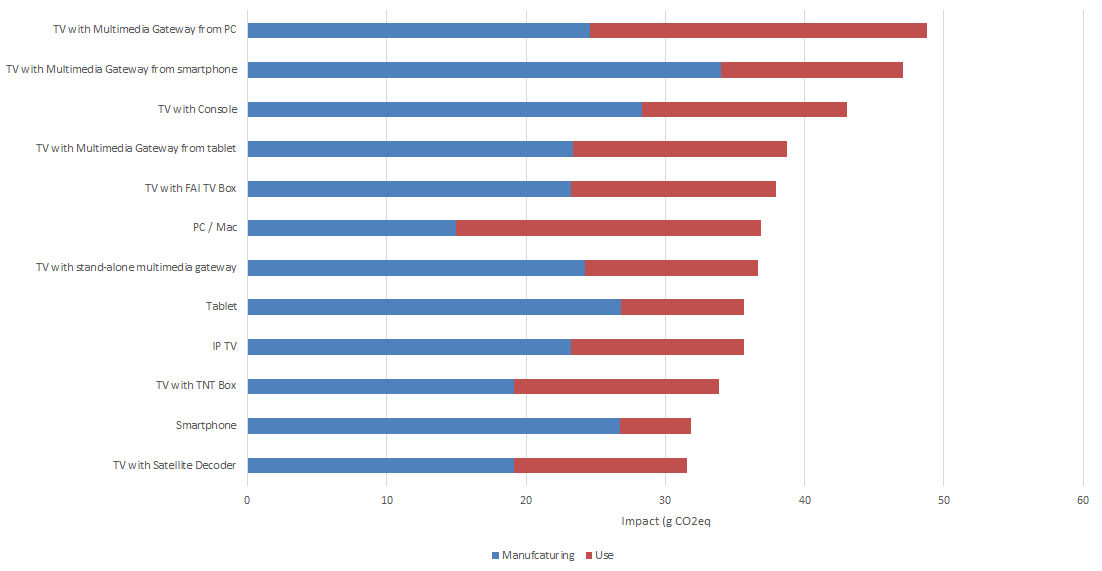
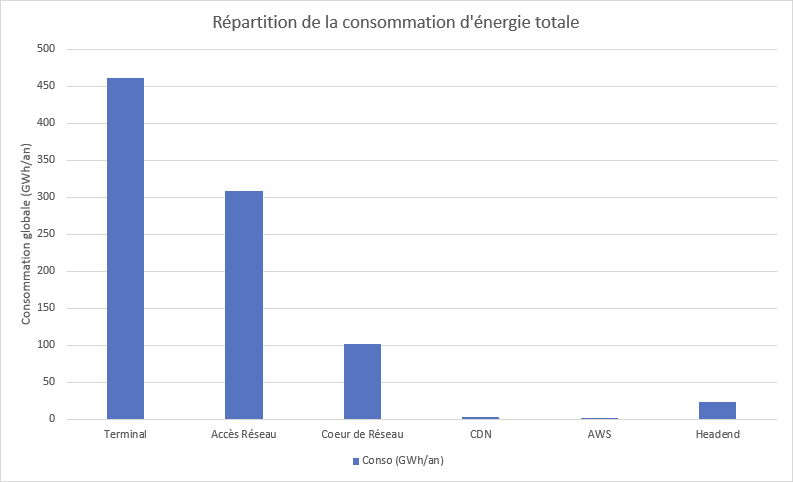
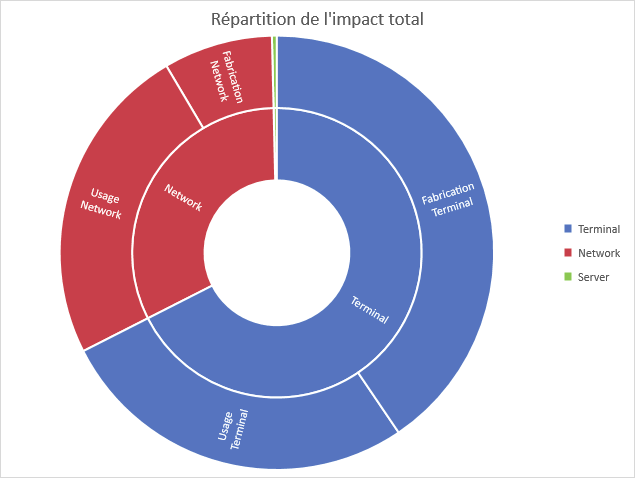
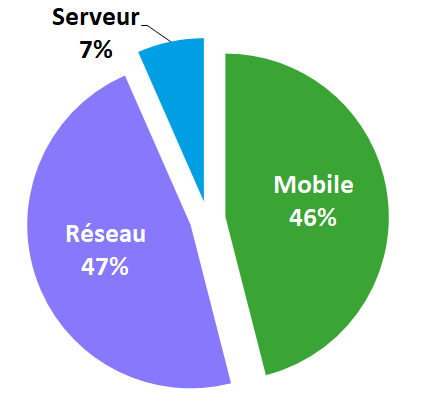
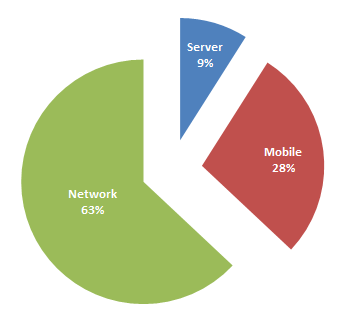
It is even a shame to focus on one aspect of the impact by dismissing the overall issue. This is the case in the discussion of the impact of the network on the energy part. The calculation method based on the kWh / Gb metric, even if shared by almost all of the studies and internal teams of operators, is criticized by some. This method can in fact be improved, but the church must be put back in the middle of the village: the impact of the network is in all cases weaker than the Terminal part, the material manufacturing part is never discussed in these debates while this is the main issue of the impact of digital technology. Especially since the energy improvement of the network and data centers is based on a principle contrary to the impact of the hardware: the regular renewal of the hardware to put in place new, more efficient technologies.
Google has been criticized for the waste policy of its servers. Practices have been improved but one can wonder about this management: even if the servers are resold and the environmental cost is amortized for the buyer, this does not change anything in the excessive renewal cycle.
“We’re also working to design out waste, embedding circular economy principles into our server management by reusing materials multiple times. In 2018, 19% of components used for machine upgrades were refurbished inventory. When we can’t find a new use for our equipment, we completely erase any components that stored data and then resell them. In 2018, we resold nearly 3.5 million units into the secondary market for reuse by other organizations.” (Google Environmental Report 2019).
One of the first explanations for these clear-cut discussions often comes from the lack of awareness of digital environmental issues. But behind that there is also a more sociological explanation: We reproach certain organizations for “ecological” beliefs. However, we can also speak of belief among certain digital players when we uncritically idolize the benefits of digital technology. In this case, not sure let these discussions go in the right direction. “Technophobic” versus “Techno-béa”, the reasoned find it difficult to take their place in the middle. Several avenues are however useful to progress serenely on the impact of digital!
Let us limit the comparisons between domains
Comparisons of the environmental impact of digital technology with other fields are a trap. It is necessary to understand an abstract CO2 impact. We use it ourselves to carry out this awareness. However, this leads to sometimes biased conclusions.
Here is the brief used by Les Echos! “Netflix claims that one hour of streaming on its platform generates less than 100gCO2e. This is the equivalent of using a 75W fan for 6 hours in Europe, or a 1,000W air conditioner running for 40 minutes.”
So an hour of streaming is low? Yes and no. Because it has to be seen from a “macro” level: worldwide viewing hours are exploding. And Netflix isn’t the only digital service we use. Is it possible to compare it to fan time? A household will be able to visualize 4 flows at the same time for several hours, we are not on the same importance of use with a fan (Maybe if with global warming …).
What is important is that this metric will allow service designers to track their improvement. With the details of this impact, they will be able to identify the hotspots. It will allow you to compare yourself to a competitor and to position yourself.
Using these numbers to say that the impact of digital is huge or zero doesn’t help much in the debate. All areas must reduce their impact, the challenges ahead are enormous and this type of comparison does not necessarily help in the dynamics of improvement. On the other hand, the more this type of study comes out, the more we will have a precise mapping of the impact of digital technology.
Let’s collaborate!
LCA models are criticized for their unreliability. Ok, is that a reason to abandon digital impact analysis? That would suit some well!
Above all, it is necessary to improve them. And this will come through more transparency: public LCAs from equipment manufacturers, energy consumption metrics reported by hosts, and even more information on the renewal of parks … Some players are playing the game, it is is what we were able to do for example with Canal + and this made it possible to have reliable data on the datacenter, CDN and terminal parts. However, the lack of transparency is significant in this sector when it comes to the area of environmental impact.
It is also necessary to avoid always blaming other sectors. In these discussions about the impact of video, and more broadly digital, I continually see “it’s not me, it’s him” arguments. For example, it is the hardware that must be acted upon, implying the software is not responsible for the impact. Once again, the environmental context is critical, there are no quick fixes and everyone must act. To free oneself from actions by pointing fingers at other actors is not serious. The idea of measuring the impact of digital is not to do “digital bashing” but to improve it. So there is no reason not to take these issues into account, unless ” go into a lobbying process and want to move towards total digital liberalization.
Having seen this field evolve over the past 10 years, I can say that there is a real awareness of certain players. The impact of digital can still be denied, but it is a dangerous risk. Dangerous because it is clear that the environmental objectives will be more and more restrictive, like it or not. Not taking this issue in hand is leaving it to other people. This is what we are seeing today: some are complaining about digital laws. But what have they done over the past 10 years when this issue was known? For fear that this will slow down the development of digital technology compared to other countries? Instead, why not see digital sobriety as a competitive factor in our industry? We can see that sobriety is taken into account by many countries (the DIMPACT project is an example). France has a lead with many players dealing with sobriety. It is time to act, to collaborate on these subjects, to criticize the methods to improve them, to measure themselves, for everyone to act in their area of expertise.
This is what guides our R&D strategy, providing a precise tool for measuring energy consumption and the impact of terminals. We are working to improve the reliability of measurements in this area, to try to provide food for thought and metrics. Hoping that the debates will be non-Manichean and more constructive and that the digital sector fully takes environmental issues into account.

Digital Sobriety Expert
Books author «Green Patterns», «Green IT – Gérer la consommation d’énergie de vos systèmes informatiques», …
Speaker (VOXXED Luxembourg, EGG Berlin, ICT4S Stockholm, …)
Green Code Lab Founder, ecodesign software national association