Category: Battles

What is the environmental impact of LLM use on the customer’s side ? Battle ChatGPT VS DeepSeek

Reading Time: 9 minutes

Introduction

a. Context 

Who hasn’t ever used DeepSeek, ChatGPT, Copilot, Gemini, Mistral…? LLMs (Large Language Models) are becoming an essential part of everyday life, whether you’re a schoolchild, a developer or just a web surfer. 

As this Deloitte study points out, these generative AIs have a high environmental cost, particularly on the server side. They currently account for 1.4% of global electricity consumption and are expected to triple by 2030. As the models are very heavy, they consume a lot of power when processing the data and generating the response. In the case of LLM generative AI, consumption is high on the server side, but it would also be interesting to measure the consumption and environmental impact on the user terminal side, because more generally speaking, for a traditional digital service, the impact is much greater on the client side.  

This trend is corroborated by other studies, including an analysis by McKinsey published in October 2024, which estimates that demand for AI-enabled data center capacity will increase by an average of 33% per year between 2023 and 2030. 

Recently, DeepSeek made a splash in the LLM world, boasting performance similar to the best with a lighter model. But what about on the client side? We propose to measure and compare the performance of DeepSeek applications and ChatGPT, the most popular generative AI today, based on the same user scenario.   

b. measurement perimeter 

All the measurements were taken using Greenspector Studio.

All these measurements were carried out on a real terminal, in this case a Samsung Galaxy S10 running Android 12, which corresponds to an entry-level smartphone today. 

These measurements were carried out on:  

  • DeepSeek version 1.0.8 
  • ChatGPT version 1.2025.028. 

c. Methodology and scenario 

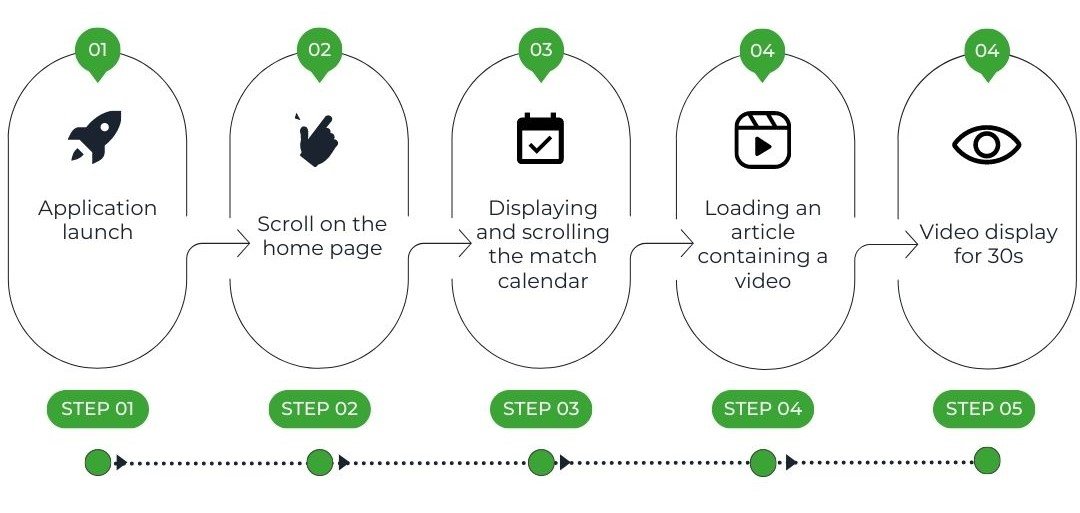
To measure the two applications, we used a common user journey for the 2 applications tested: 

  • Opening the application 
  • Logging in to an account (compulsory for DeepSeek and recommended for ChatGPT in order to access all the features) 
  • Write an initial ‘simple prompt’: ‘I’m looking for an internship in digital sustainability. Explain to me in one sentence what this is all about’. 
  • Waiting for the response to the simple prompt 
  • A prompt asking for a 500-word response says ‘500-word prompt’: ‘Now go into more detail and explain what digital sustainability is in 500 words without searching the web.’ 
  • Waiting for the 500-word prompt response 
  • A prompt asking the same thing as the 500-word prompt but searching the web, ‘web prompt’: ‘Now go into more detail about what digital sustainability is in 500 words by searching the web.’ 
  • Waiting for the prompt web response 
  • Download a CV from the Internet 
  • Insert a file in the LLM 

Note that these different prompts are linked in a single discussion. 

Additional methodological note: 

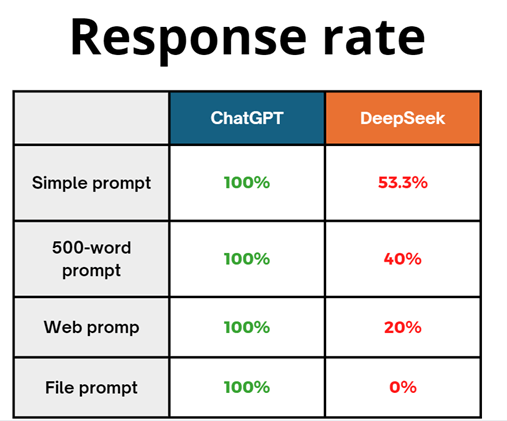
 We have only included the measurements that functionally show a result. During the measurements, DeepSeek often failed to respond to user requests, probably because the servers were too busy. We therefore had to perform more measurements on DeepSeek to obtain usable results. We also deleted part of the route initially tested from the response to the prompt file because DeepSeek did not provide a response to the generation of a covering letter.

I. Performances, consumption and environmental costs 

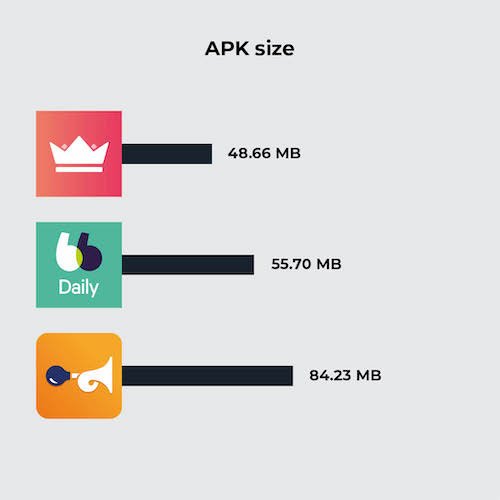
a. Application size on the smartphone

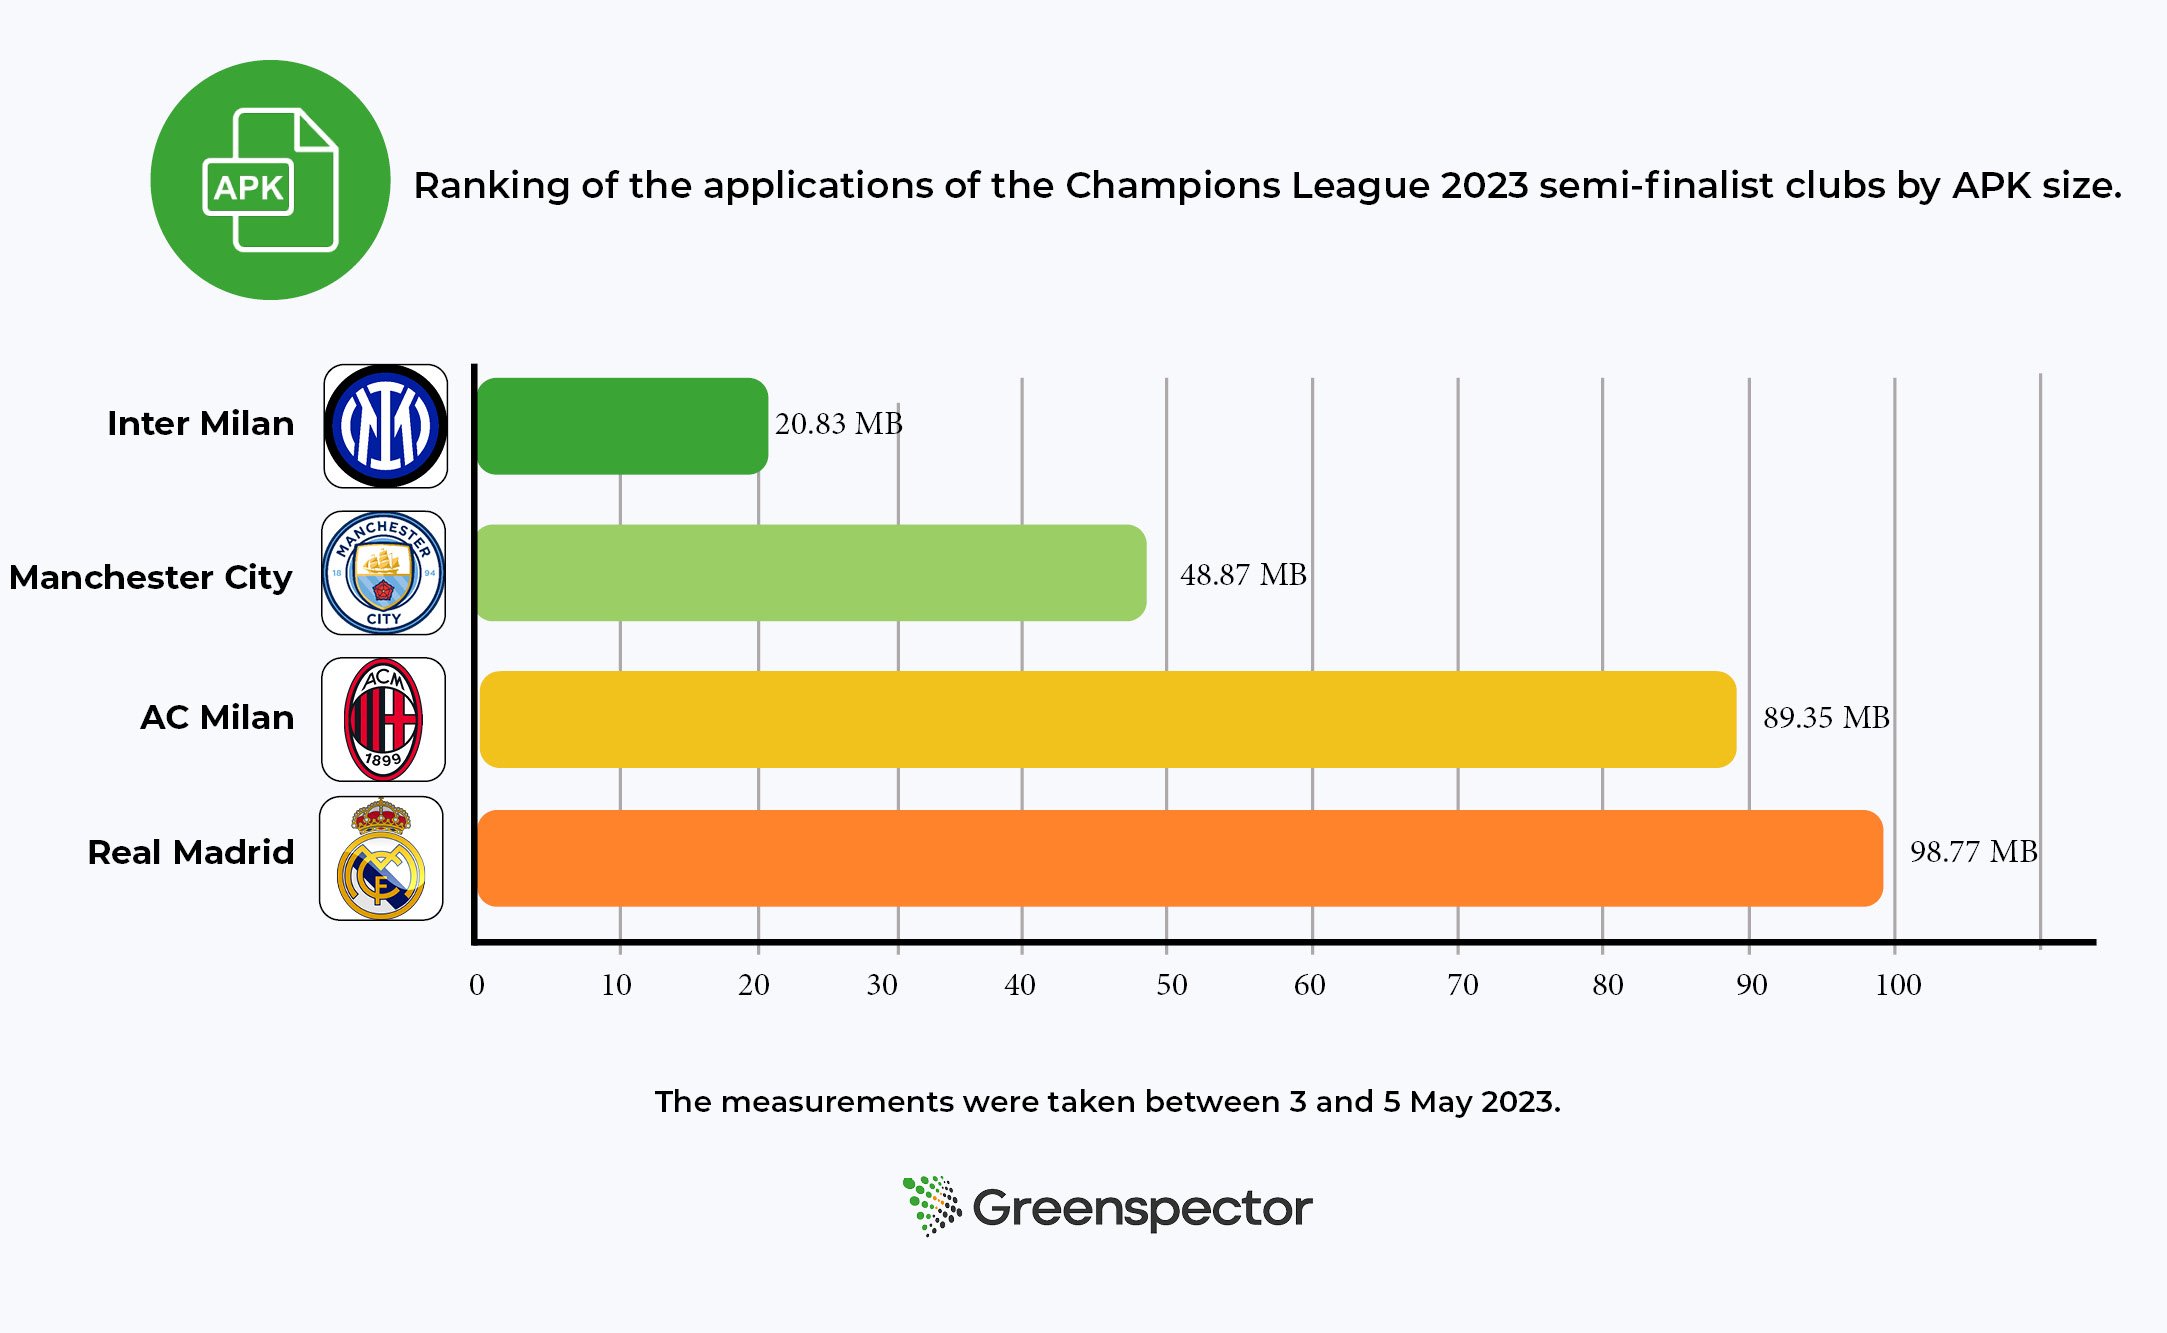
The applications are not the same size: DeepSeek is 32.33 MB compared with 76.36 MB for ChatGPT, more than twice the weight of its rival. The same applies to the APK files: DeepSeek’s are twice as light as ChatGPT’s.  

Given the number of installations and the number of updates of these 2 applications, this is a significant factor in the impact generated by this usage requirement. We’re talking about more than 10 million downloads on the playstore for DeepSeek and more than 100 million for ChatGPT. 
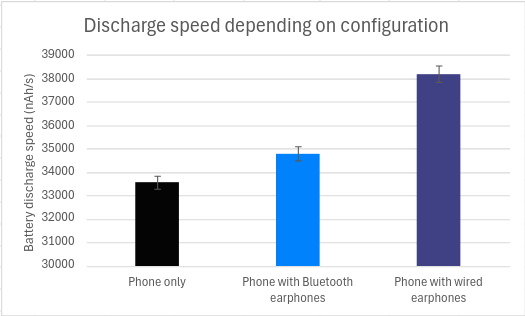
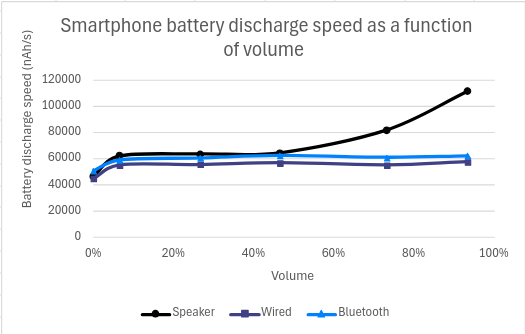
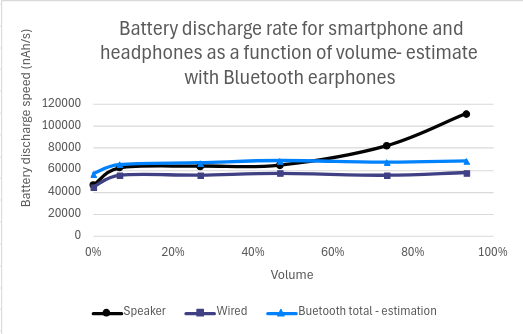
b. Discharge speed

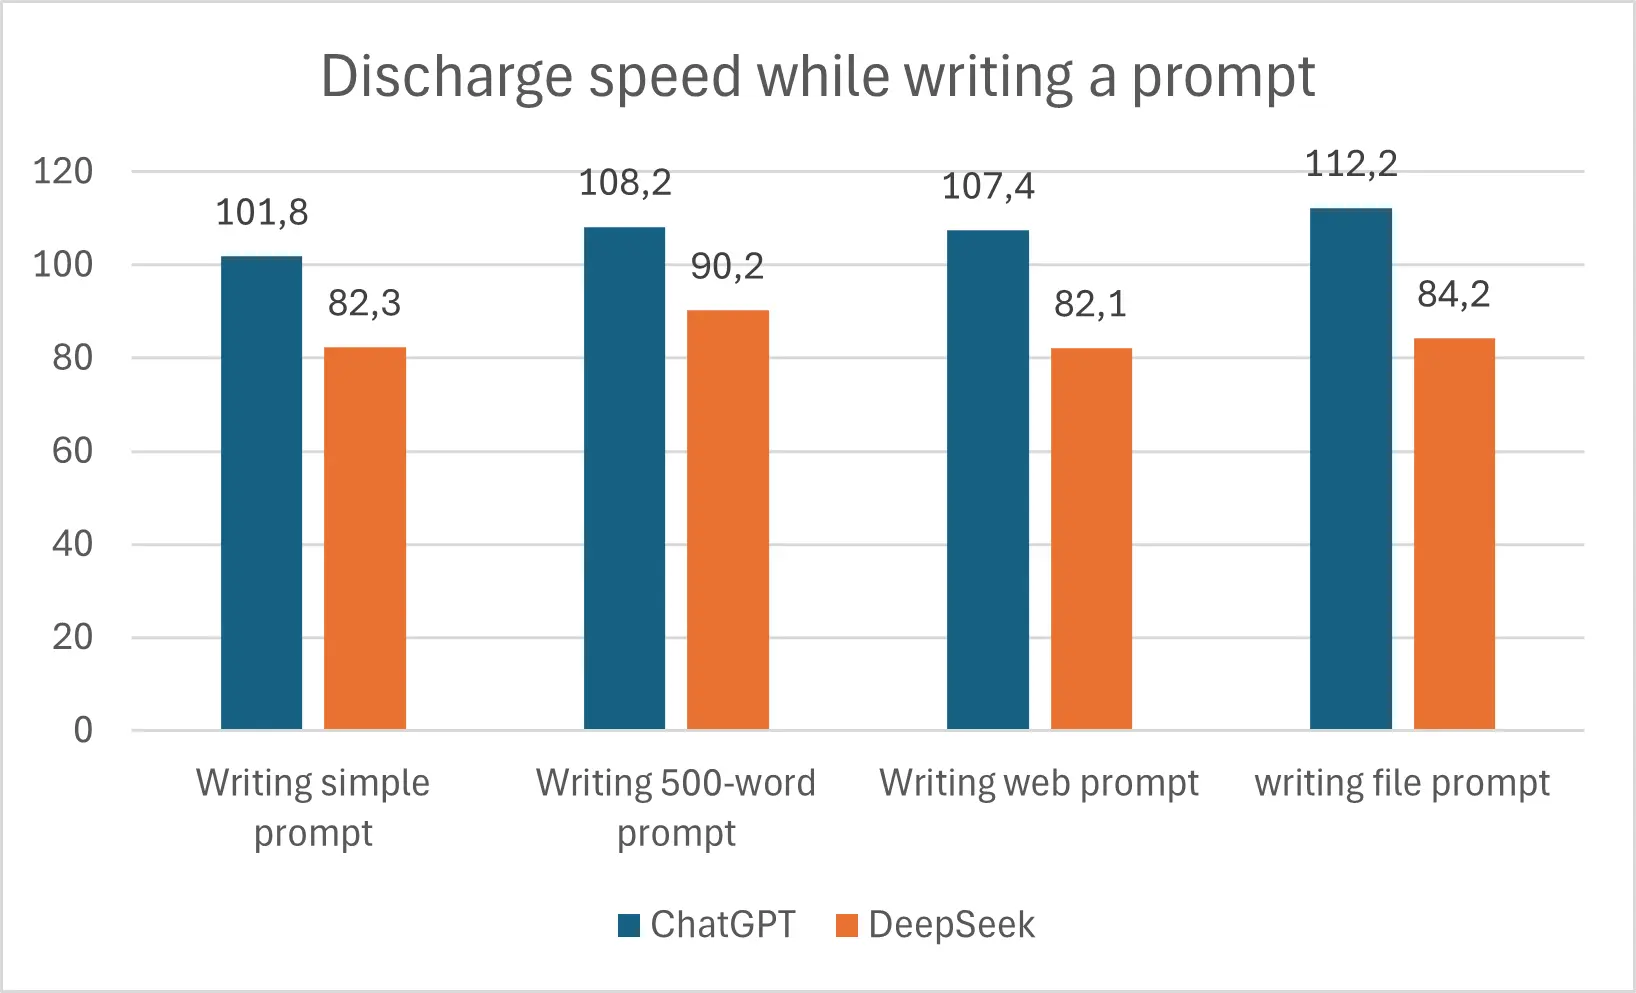
ChatGPT discharges the battery faster when writing a prompt. 102.37 µAh/s compared with 85.51 µAh/s for DeepSeek, figures taken from the single prompt. This trend holds true for all prompts. Given that writing prompts take the same amount of time for both, on average DeepSeek consumes 24% less than ChatGPT when writing prompts. 

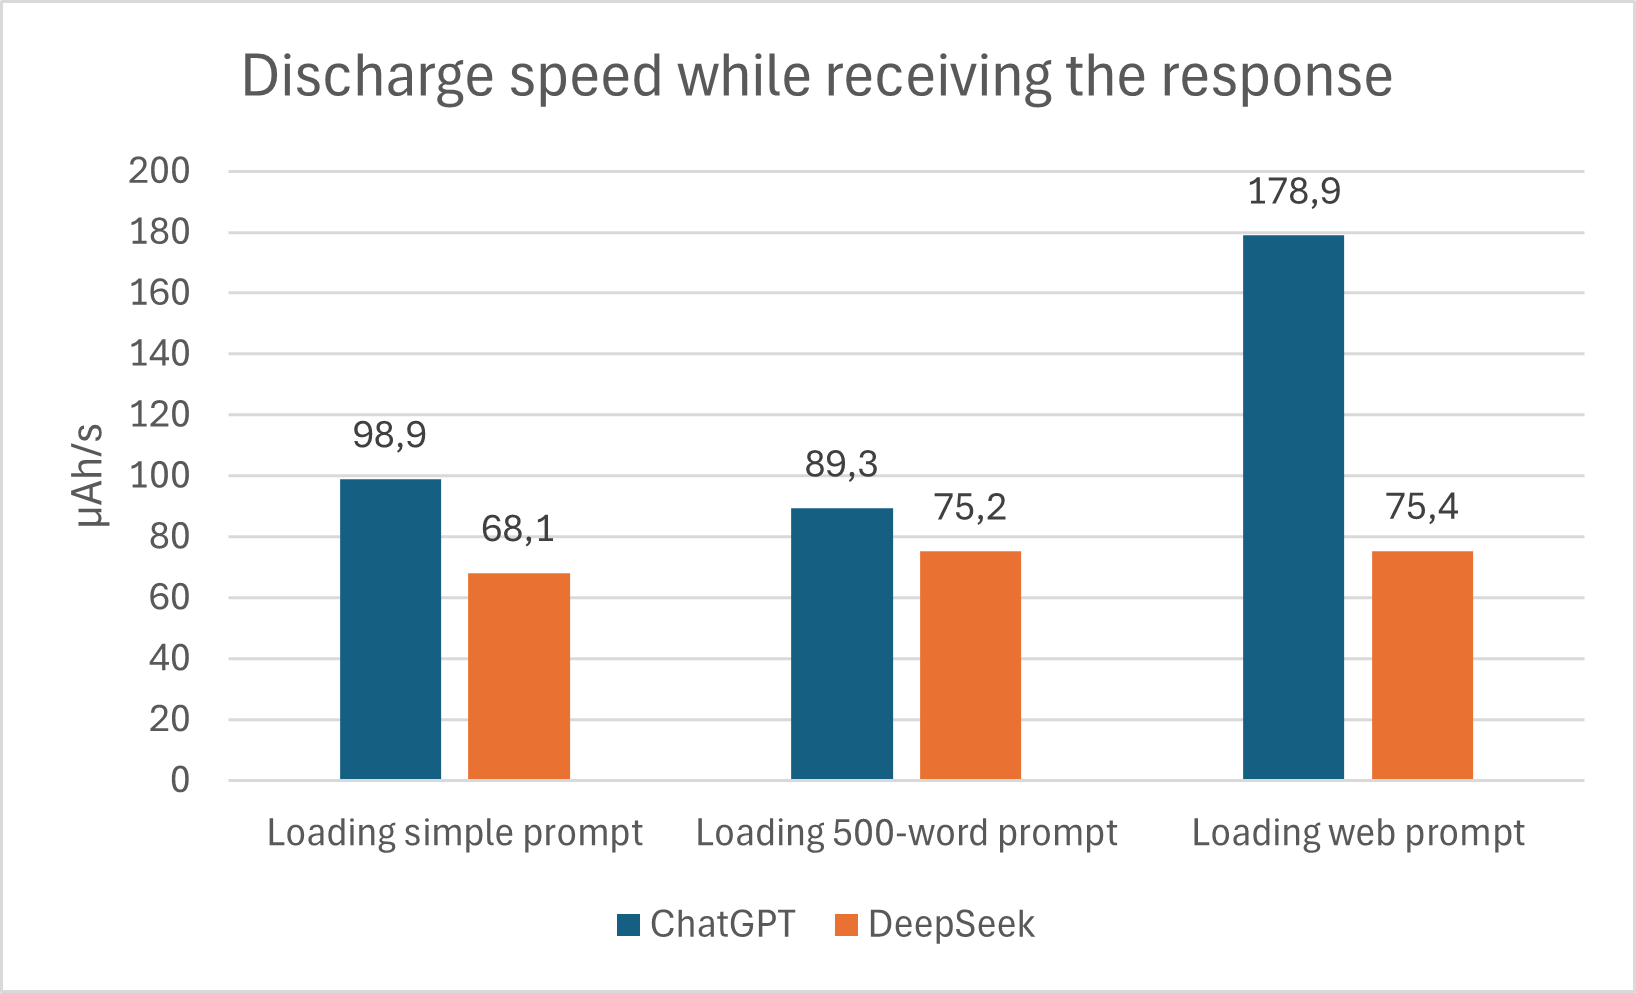
DeepSeek discharges the smartphone less quickly than ChatGPT when using the application. This is also confirmed in the prompt response, where on average DeepSeek unloads the smartphone 67% more slowly than its American counterpart. 

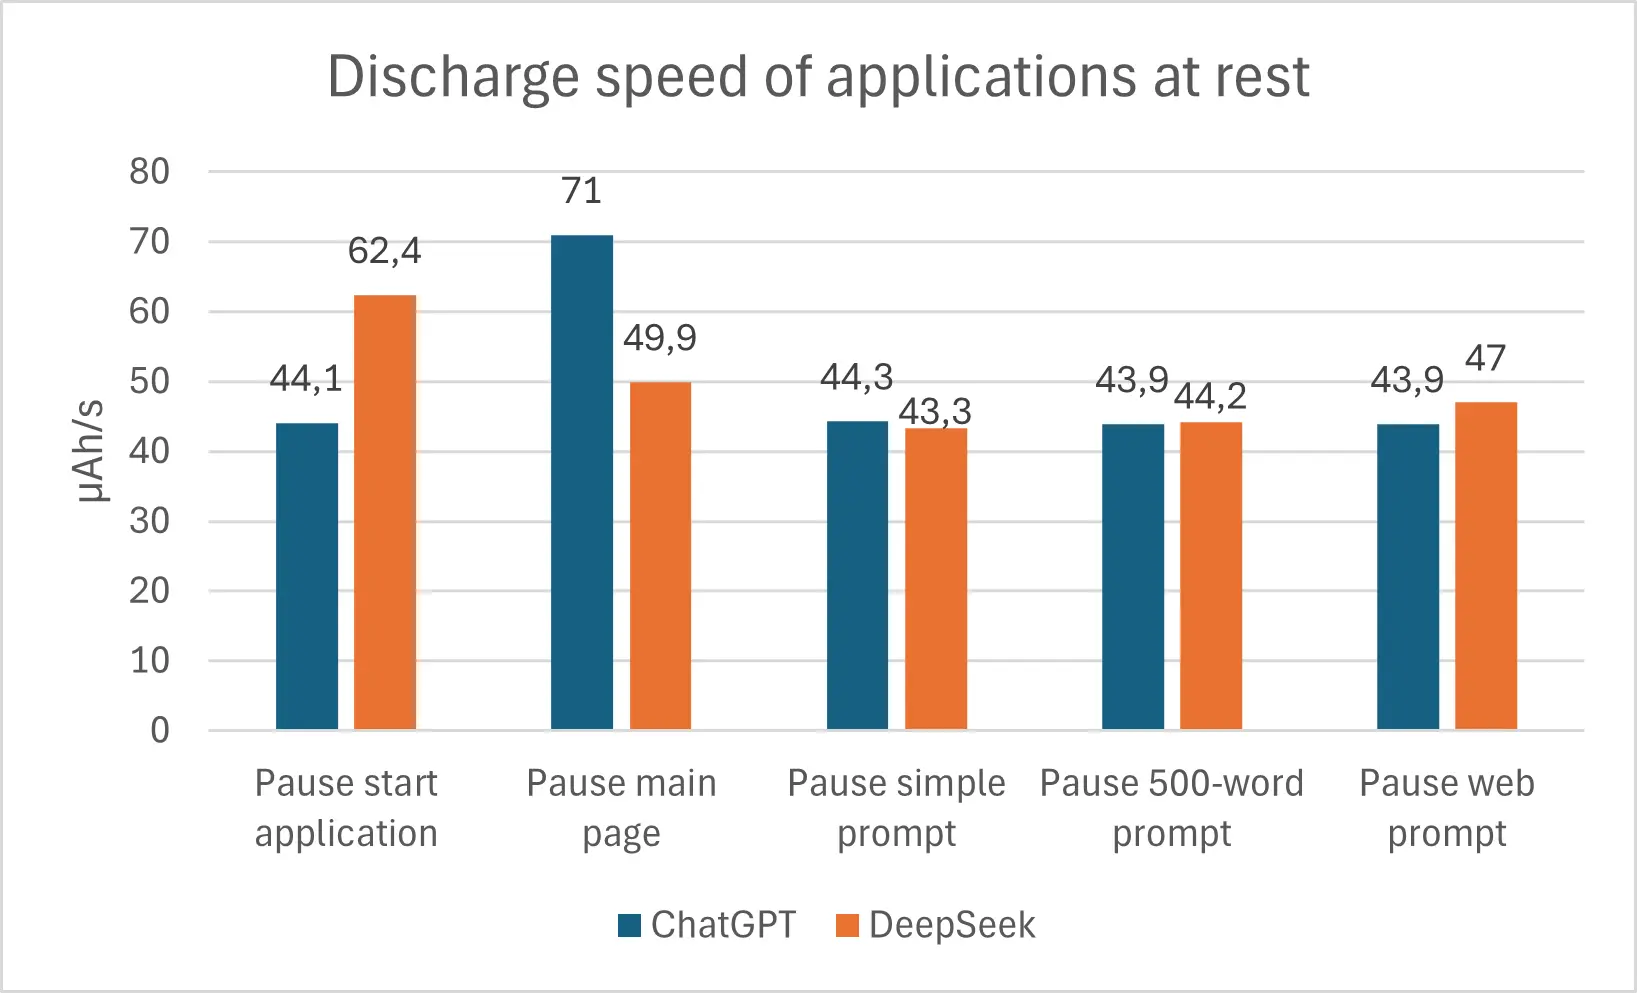
As is often the case, whether it’s a web or mobile application, one of the most power-hungry pages is the home page/screen, or at least the main page. As can be seen from the table above, when the application is opened, DeepSeek consumes around 42% more than ChatGPT. However, once on the main page, ChatGPT in turn consumes 42% more than DeepSeek.

For the other pauses, there is a variation of between 2% and 7% in favour of one or the other, so there is no significant difference there. 

c. Response delay

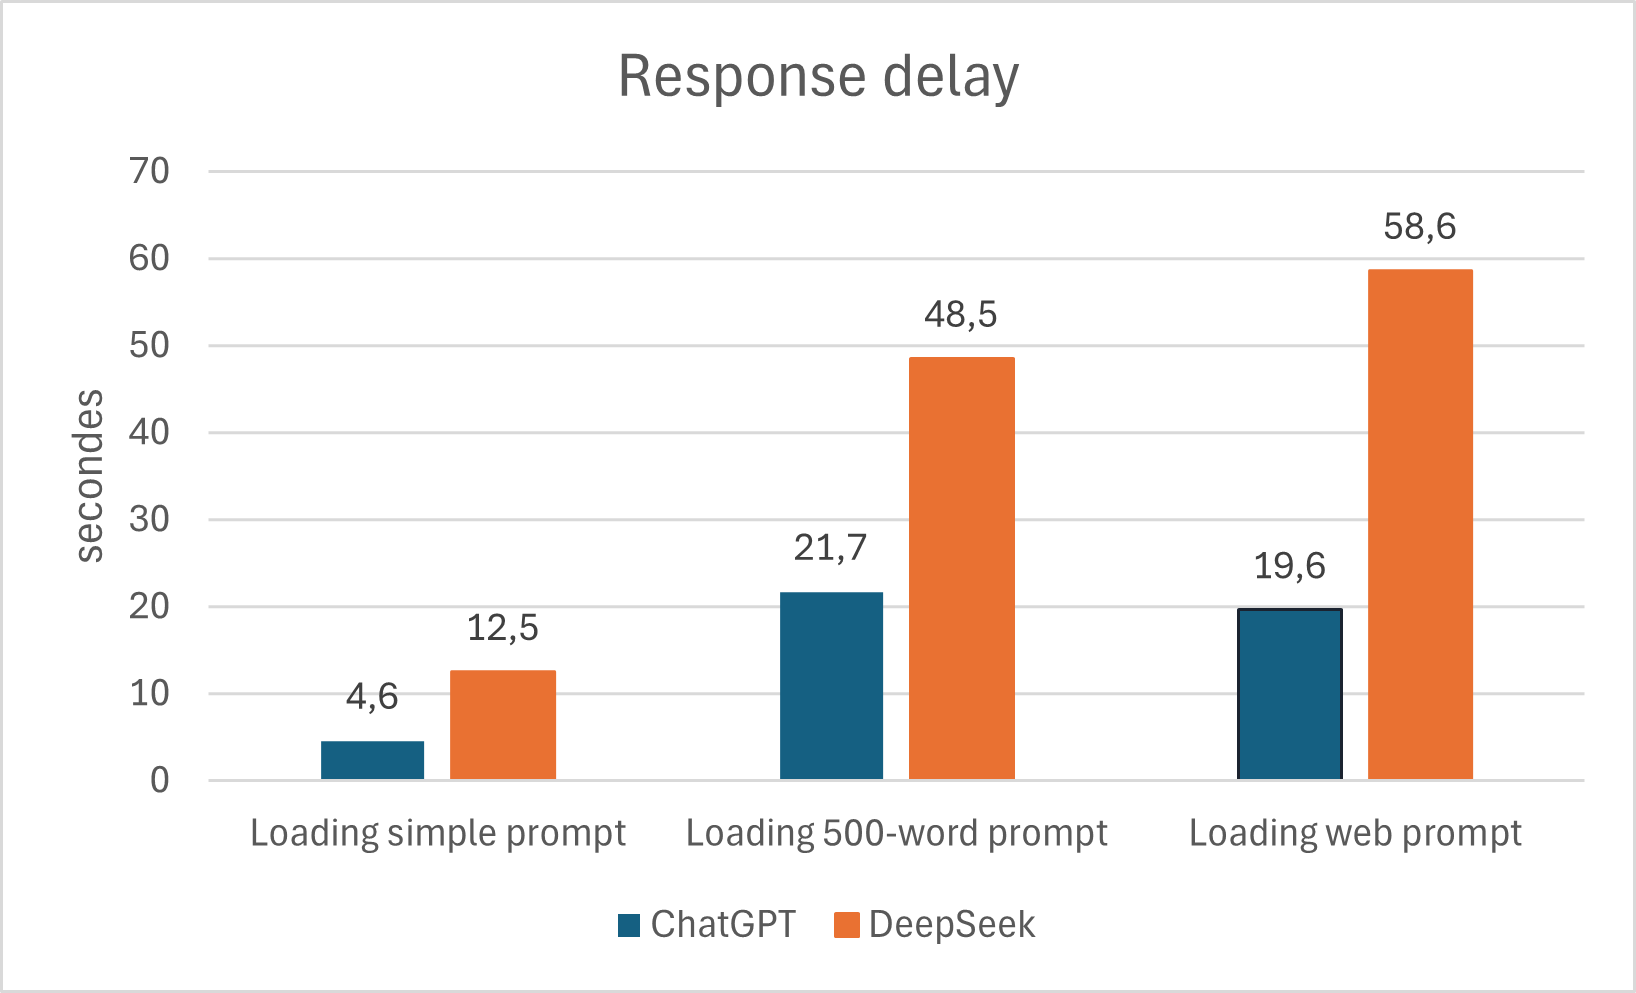
On both applications, the response time for the same prompt varies greatly from one iteration to the next. For example, on ChatGPT, the measurements range from 14.15s to 44.66s for loading the web prompt. DeepSeek, on the other hand, takes between 48.68s and 1m10s for the same prompt. In general, ChatGPT is significantly quicker to respond, whether for a simple prompt or one with more than 500 words. ChatGPT responds at least twice as quickly for a simple prompt.

We can therefore conclude that, on average, ChatGPT responds to our use cases 2.5 times faster than DeepSeek.

d. Energy consumption

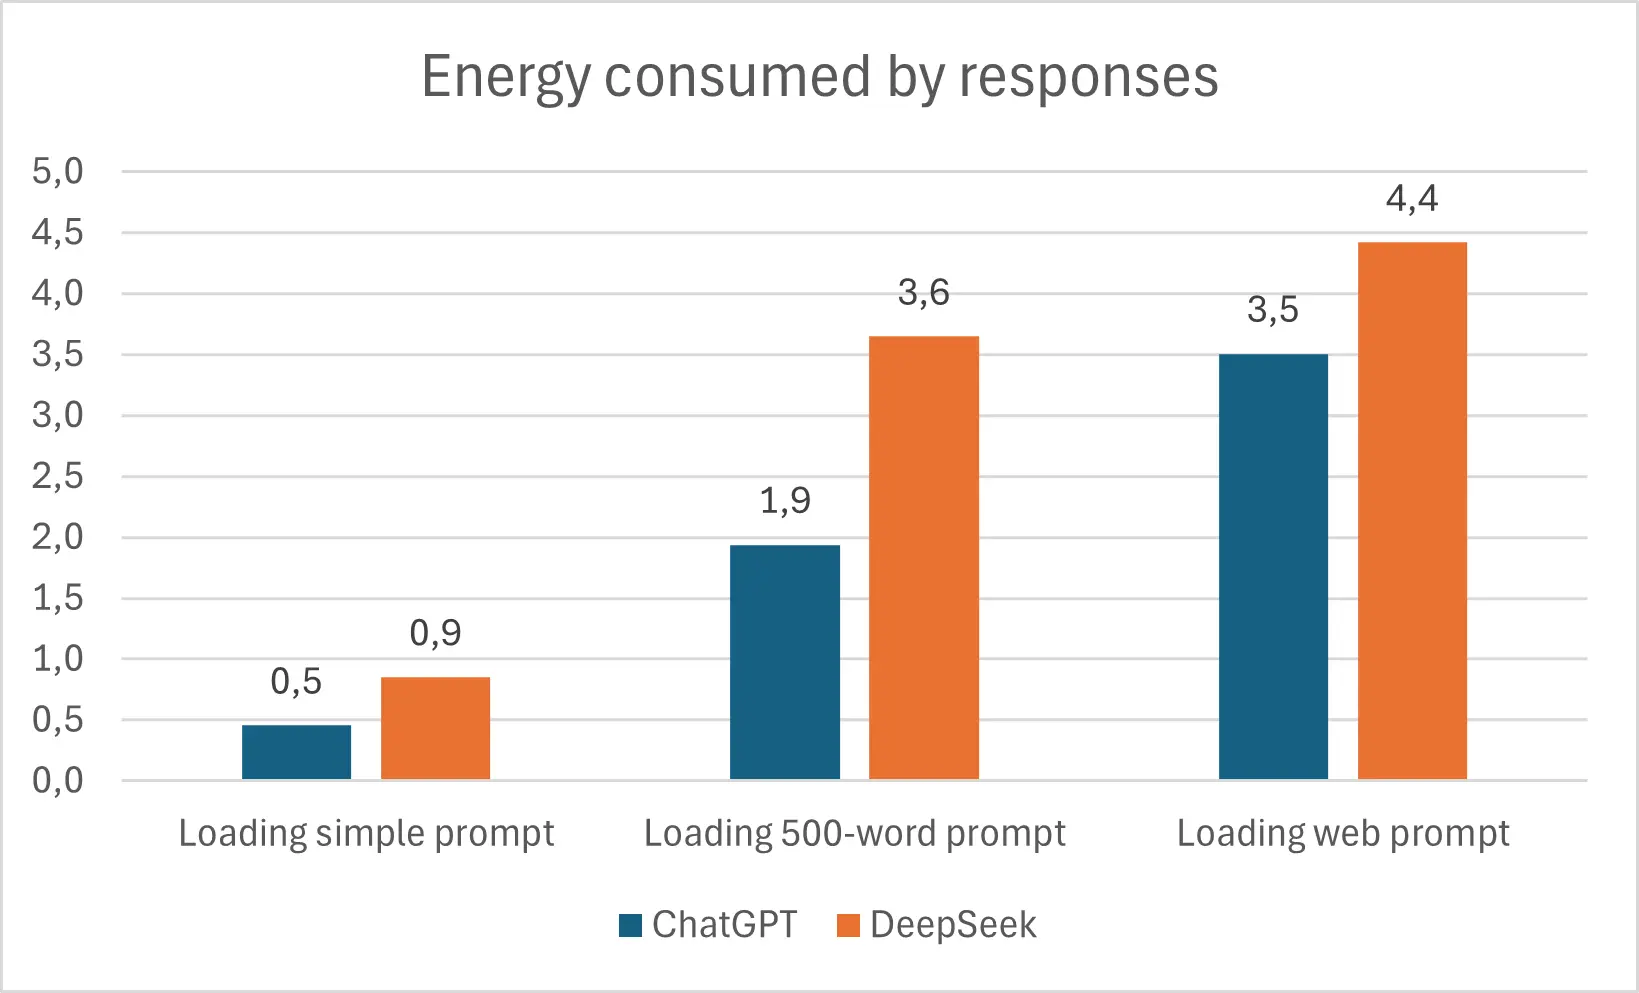
In terms of response time and download speed, the table above shows that in terms of pure energy, ChatGPT consumes less even though it consumes much more per unit of time. In fact, as the response times are significantly to its advantage, ChatGPT takes advantage of this to spend less energy than DeepSeek over the entire journey on the user device, i.e. on average 34% less than DeepSeek.

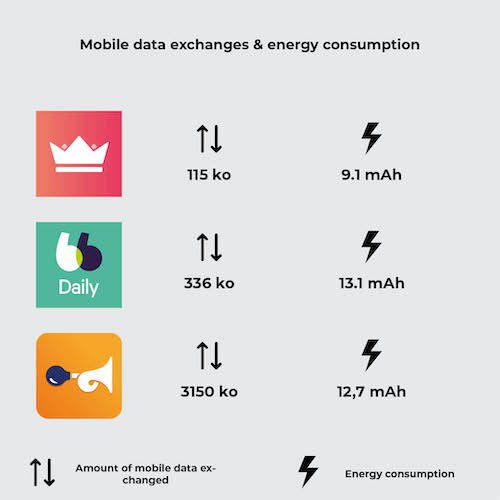
e. Data flow on the network 

ChatGPT has a zero data flow with the servers when the first prompt of a discussion is written. It then exchanges several kilobytes with the servers for 500-word prompts and file prompts. Finally, it is particularly datavorous when writing the web prompt, going up to 62kb.

DeepSeek, on the other hand, exchanges only a few kilobytes (5.2 KB) during the first prompt and then exchanges less data with the servers than ChatGPT, on average 90% less.

We can see from the measurements above that, in overall terms, DeepSeek uses more data to answer than ChatGPT. The Chinese AI tends to write longer answers than ChatGPT for the same question. The exception is the web prompt, where GPT uses more network data.

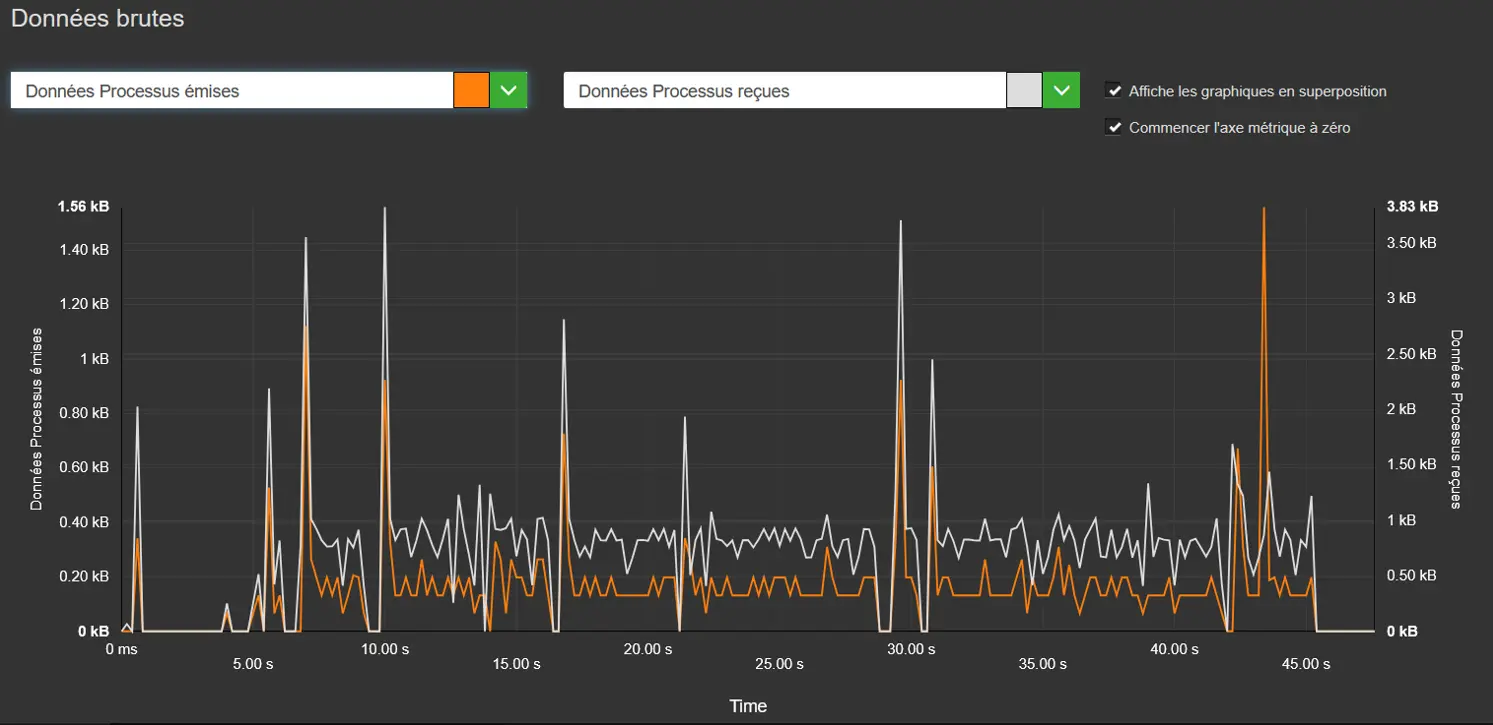
DeepSeek, prompt response 500 words, Data sent, Data received

ChatGPT, prompt response 500 words, Data sent, Data received

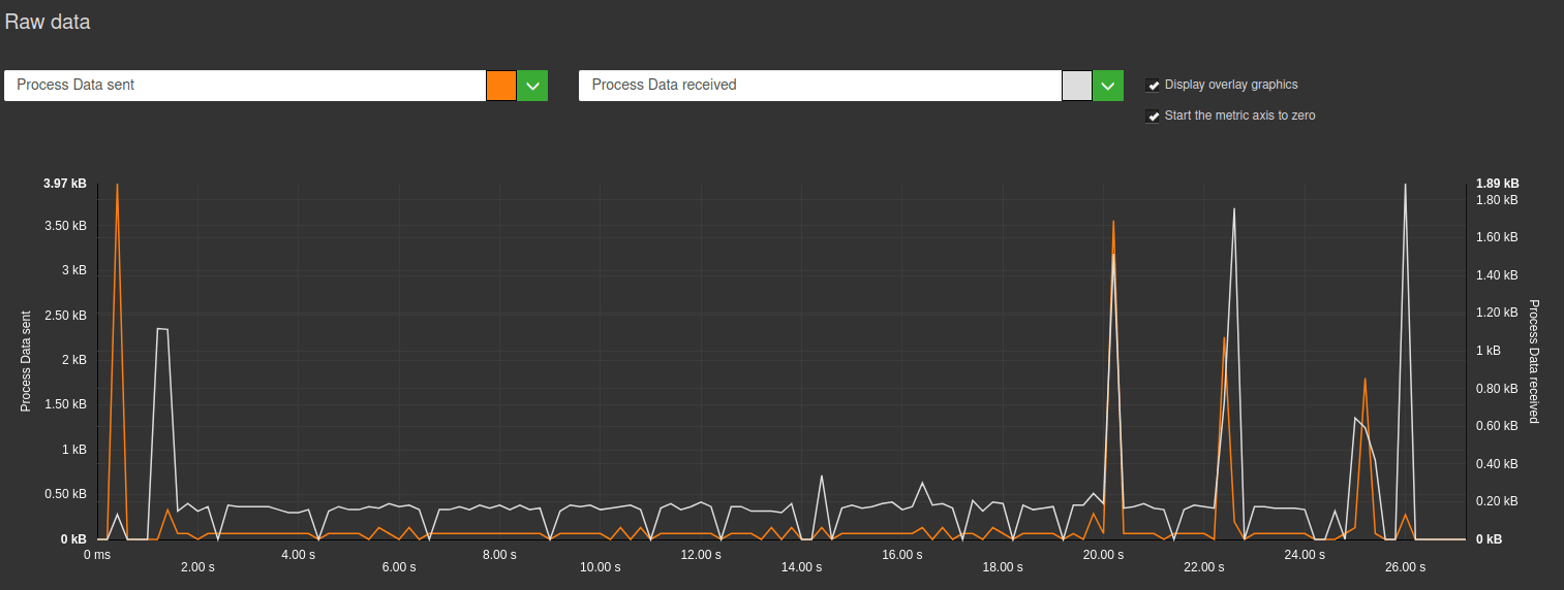
If we look a little more closely at how data is transmitted while a response is being received, we can see from the graph above that several packets arrive as the response is received, as it is displayed. Each time a packet is received, the application transmits one in turn to confirm that it has been received. This places regular demands on the smartphone’s radio cell and on the update mechanisms in the response page, which will consume a lot of energy.

If we study the JSON files of the packets received, we can see that ChatGPT’s JSONs are much lighter, due to the larger size of the tokens. Each token contains up to 42 characters, compared with a maximum of just 5 characters for DeepSeek.

For DeepSeek, launching the application requires more data than ChatGPT. However, once the application has been definitively launched, there are only small ‘reasonable’ data flows. DeepSeek therefore manages data flows better than ChatGPT.

ChatGPT is much more demanding in terms of data. It consumes less when the application is opened, but then during each pause (display without interaction) that follows a response, there is an abnormally high flow for a pause stage. 

f. CPU

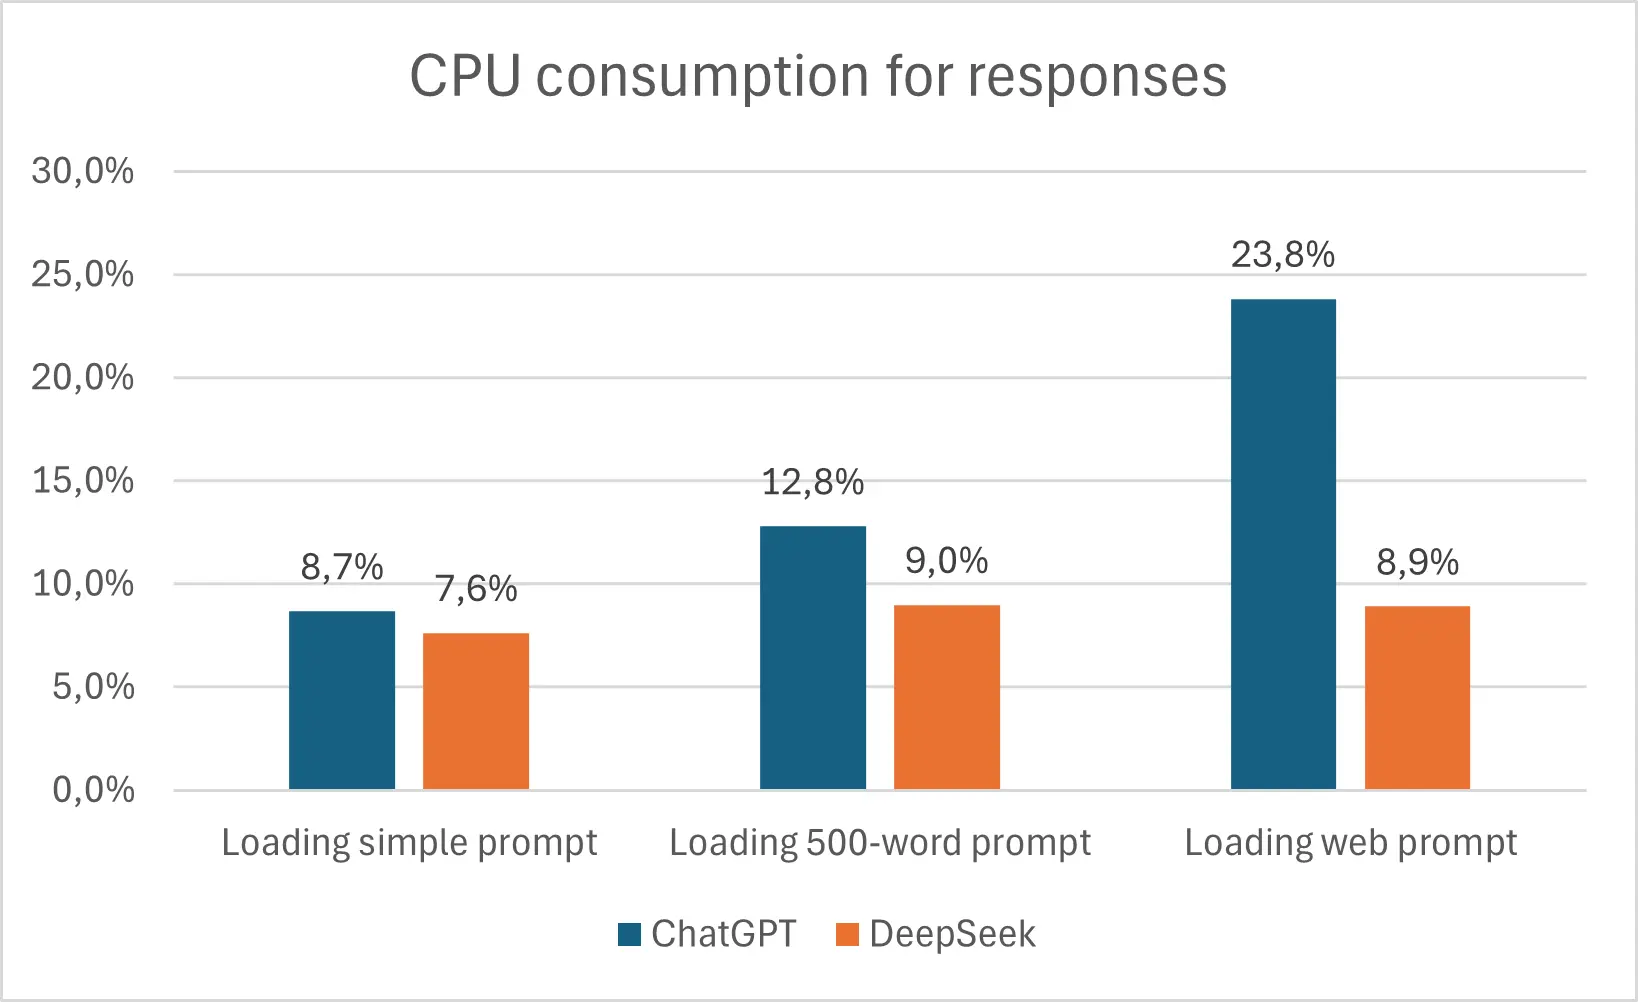
We’ve noticed that DeepSeek discharges its battery less quickly than ChatGPT, and we’ve also noticed that it consumes less CPU. As can be seen from the graph above for each response, ChatGPT is more CPU-intensive than DeepSeek, with in particular a very significant difference on the web prompt with 23.8% of the CPU used by ChatGPT whereas for the same action DeepSeek only uses 8.9%.

However, as explained earlier, ChatGPT uses this CPU for less time, which allows us to make the same conclusion as for energy. ChatGPT is more demanding in terms of CPU per unit of time, but over the whole response it consumes less than DeepSeek. In fact, using more CPU means higher battery consumption, so the two issues are linked.

g. Environment impact

In our case, around 8% of ChatGPT’s carbon footprint is on the client side.

Methodology for projecting environmental impacts

By projecting these flow metrics over a perimeter that does not consider the impact on the Datacenter side, but only the impact on the network and client workstations, we obtain the following data: 

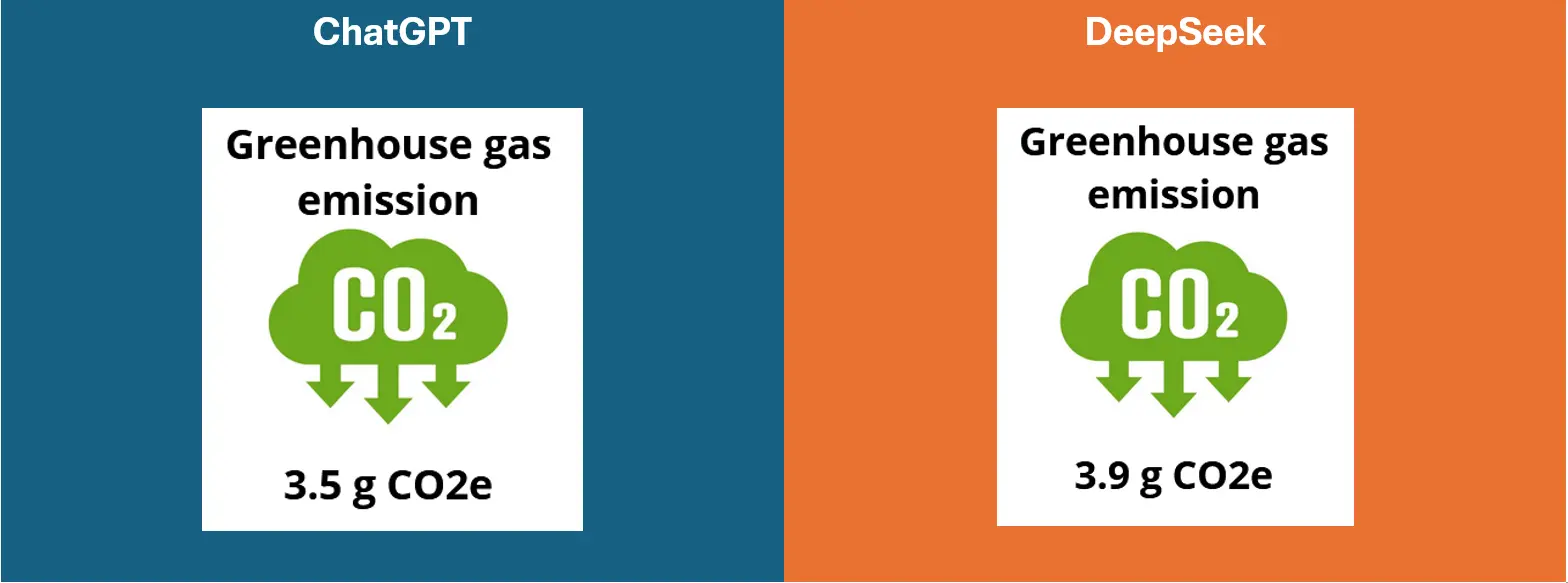
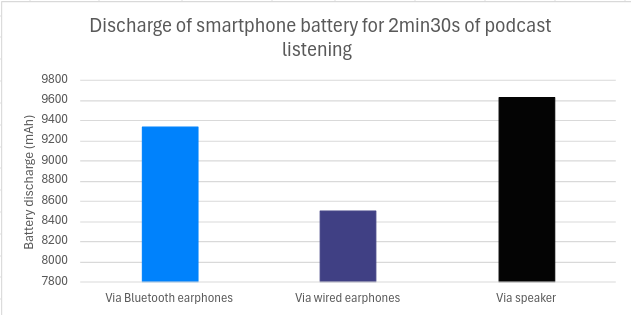
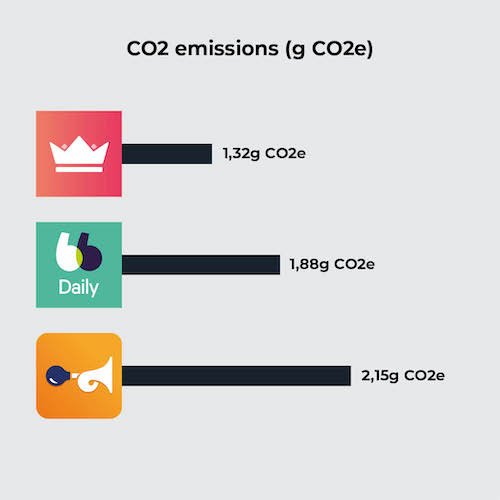
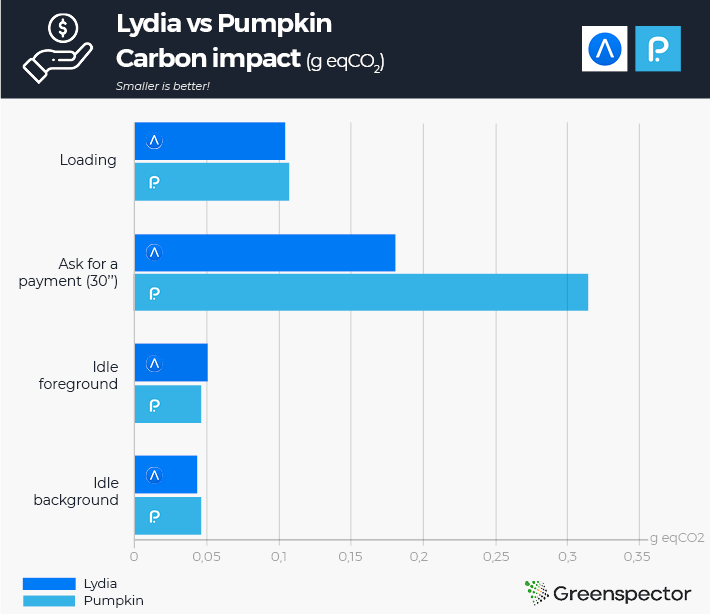
As we can see, the energy impact is to ChatGPT’s advantage (10%). However, whether for ChatGPT or DeepSeek, the impact remains very high for just three responses, with an average of more than one gram of CO2 per response. This corresponds to a video lasting around 2 minutes for ChatGPT and 2 minutes 30 seconds for DeepSeek.

Daily environmental impact on smartphones

However, on a large scale, ChatGPT is significantly less polluting. For example, for 100 million uses, i.e. 300 million responses, DeepSeek has an impact that is 40 tonnes greater on the customer side. According to OpenAI, ChatGPT receives 1 billion requests per day, 48% of which are on mobile phones. On average, therefore, ChatGPT consumes 560 tonnes of CO2 per day on the telephone side alone.

II. Accessibility and privacy

a. Accessibility and inclusion

Visually, the two applications are similar, with buttons of the same size and screens laid out in the same way. One criticism is that the contrasts are sometimes too blurred, and the click zones are sometimes too small.

The difference lies in accessibility for the visually impaired or blind. During the automation process, we noticed that the various elements of the DeepSeek layout did not yet have a description, identifier or any other element that would allow us to distinguish them when reading the page. As well as making it more difficult to automate the application, this is above all a problem for the visually impaired. Their assistive software relies on this content to provide a description of the page and enables them to use these applications. This is a bad practice that should be banned to enable the inclusion of as many people as possible.

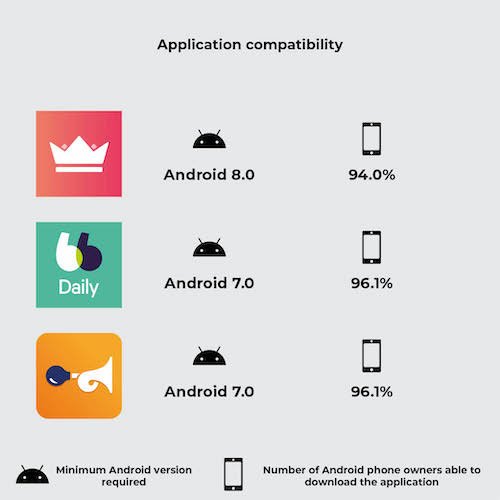
Regarding the inclusion of older versions of Android, DeepSeek requires at least version 5.0 of Android, which covers 99.7% of potential users worldwide, and ChatGPT requires version 6.0 of Android, which covers 98.4% of potential users.

In terms of accessibility, DeepSeek is less cumbersome and available for a few more uses than ChatGPT, but poses a major problem for the visually impaired. 

b. Suspicious authorisations

Smartphone applications require authorisation to carry out their functions using the device’s camera and microphone, which justifies the granting of these permissions.

More surprisingly, ChatGPT requires access to location, contacts and even the calendar. By exploring the application’s APK files, we can see that it also detects the taking of screenshots (when the application is open) and that it also requests access to the Bluetooth connection.

DeepSeek is more reasonable: apart from the camera and microphone, it doesn’t ask for any additional permission.

Conclusion

As we have seen throughout our analysis, DeepSeek discharges the battery less quickly, uses less CPU per unit of time and transmits less data, but has much higher response times. These response times are the main reason why it uses more energy than ChatGPT over the whole of the journey. DeepSeek’s lack of accessibility for the visually impaired is clearly a problem for its use.

In the observed use case, it is clear that the environmental impact of AI is greater on the server side. To give an order of magnitude, the value for Chat GPT for the route taken is 45.48 gEqCO2, according to the Ecologits site, whereas on the user terminals it is only 3.5 gEqCO2, or 8% of consumption.

We can therefore deduce that, at present, on a per-user terminal (and network) basis, ChatGPT has a lower environmental impact than DeepSeek in terms of greenhouse gas emissions. ChatGPT’s slight advantage is due to its lower energy consumption. However, we need to keep an eye on the development of DeepSeek’s response times, because if the Blue Whale application improves on this point, it could easily consume less energy than ChatGPT at the local device level and have less impact on the customer’s environment.
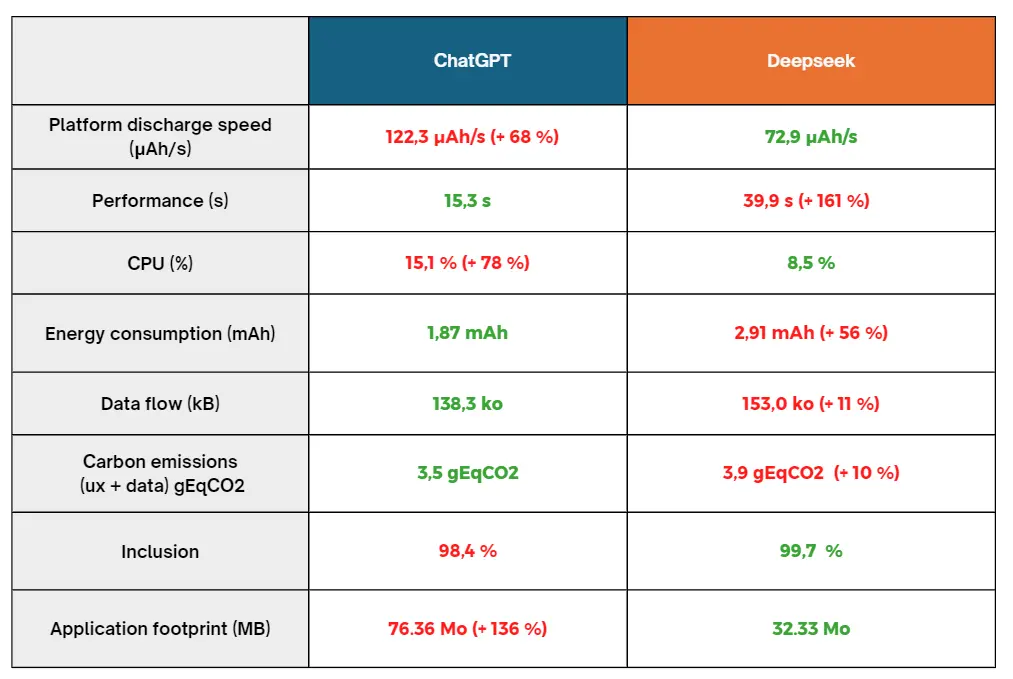
Summary of figures: 

French version : Quel impact environnemental de l’usage des LLM côté client ?  Battle ChatGPT vs DeepSeek

For more articles on AI : What is the environmental impact of local AI on our smartphones?

Coming soon: our Greenspector Studio SaaS Self-service offer to test and launch your first independent subscription to the service. Stay informed on Product Hunt

Which listening mode takes the most energy?

Reading Time: 4 minutes

Introduction

“The batteries in my Walkman are dead!”
Such a commonplace phrase in the mouth of a teenager in the 90s would seem totally ludicrous to us today.
Technologies have changed, but the problems remain the same:

  • “I’ve got to charge my phone”
  • “I need to plug in my computer”
  • “I hope there’s a plug on the train”

Energy is essential to keep our technologies running.
Without energy, there’s no sound!
But do you know which listening mode consumes the least energy, so you can enjoy your audio content for longer?

Lower energy consumption also means fewer charges/discharges of batteries, and therefore longer battery life. In this case, greater autonomy means less impact on the environment.

In this article, we propose to answer this question by measuring the energy consumption of 3 listening modes:

  • Phone speaker sound
  • Wired earphone sound
  • Sound with Bluetooth earphone

Methodology 

Measurement context

  •     Samsung Galaxy S10, Android 12  
  •     Network: Wi-Fi  
  •     Brightness: 50 %  
  •     Tests carried out over a minimum of 3 iterations to ensure reliability of results   

Selected earphones

  •     Phone speaker, Galaxy S10   
  •     Wired earphones: SAMSUNG Jack 3.5 In-ear EOIG955 
  •     Bluetooth earphones: Soundcore Life P2  

Please note that power consumption is measured on the phone battery only, and not on the Bluetooth headset battery. Both the smartphone and the earphones are Bluetooth 5.0 compatible.

Impact of connecting earphones

In this first part, we’re just going to look at the impact of having earphones plugged into our phone, without using them.

Measurement context

  • Three configurations:
    • The smartphone
    • The smartphone with Bluetooth earphone
    • The smartphone with wired earphone
  • On-screen elements: wallpaper (black image).
  • Measurement duration: 30 seconds.

Results

Discharge rate graph according to configuration: phone alone 33559 nAh/s, with Bluetooth headset 34797 nAh/s and with wired headset 38185 nAh/s

Here we can see that connecting earphones, whether Bluetooth or wired, does have an impact on the smartphone’s battery. This additional discharge is 4% for Bluetooth earphones and 14% for wired ones.

So, with a full battery on our Galaxy S10, with a capacity of 3,400 mAh, the phone will take around 28 h to discharge completely. With Bluetooth earphones, we lose 1 h of autonomy, compared with almost 3h30min with wired earphones.

To optimize your smartphone’s battery life, it’s a good idea to unplug the earphones when not in use.

Impact of listening at mid-power

Measurement context

  • Application: Radio France  
  • Podcast : cloud souverain 
  • Listening time: 2min30s
  • Listening volume: 47% (7/15)
  • On-screen elements: wallpaper (black image)

Results

Discharge graph according to configuration: listening via speaker 9628 mAh, with Bluetooth earphones 9338 mAh and with wired earphones 8501 mAh

We can see that listening via wired earphones is the one that will discharge the battery the least.

Save 1.5 hours of listening time by using wired earphones instead of Bluetooth!

If we take our phone with a full battery, we’ll be able to listen for over 16h30min with our wired earphones, compared with 15 h with Bluetooth earphones and 14h40min with the speakerphone.

If we deduct the basic energy consumption of the terminal (without playback, but with earphones plugged in or not, depending on the scenario) from our consumption with playback, we can estimate the energy impact of background playback at average volume.

Graph of energy impact by configuration: listening via loudspeaker 18929 nAh/s, with Bluetooth headphones 27420 nAh/s and with wired headphones 30903 nAh/s

The same results can be observed: listening at medium volume will have the greatest energy impact via speakerphones, and the least impact via wired earphones.

A quick look at Bluetooth earphones

The Bluetooth earphones we use have 55 mAh batteries, which the manufacturer claims will provide 5 h of continuous playback (varying according to volume level and content). This gives an average discharge rate of just over 3,000 nAh/s per earphone. Assuming that this value is obtained for an average listening volume, we can add to it.

Discharge graph according to configuration, with Bluetooth earphones: listening via loudspeaker 9628 mAh, with Bluetooth earphones 10071 mAh and with wired earphones 8501 mAh

The results then change: listening at average volume will have a greater impact on energy consumption via Bluetooth earphones than via the loudspeaker. Please note that these results are only estimates, based on assumptions.

Impact of listening volume

We were able to vary the listening volume to see the impact on the smartphone’s power consumption.

Listening volume tested: 0%, 7%, 27%, 47%, 73% and 93%.

Graph of discharge speed versus volume.

It can be seen that with both Bluetooth and wired earphones, the discharge rate remains constant regardless of volume, as long as the earphones are in use (i.e. other than 0%). On the other hand, listening with the speaker at maximum volume consumes 72% more than listening at medium volume.

To maximize your smartphone’s battery life and minimize energy consumption, we recommend using wired earphones.

A quick look at Bluetooth earphones

If we assume that our Bluetooth earphones consume the same amount of energy regardless of volume, we get the following results:

Graph of discharge speed versus volume with the estimated energy consumption of Bluetooth headphones

Here, we can see that below average volume, listening via Bluetooth earphones will consume more energy than the speaker. This trend is reversed at higher volumes. Please note that these results are only estimates, based on assumptions.

Conclusion 

Now you know which is the best way to ensure maximum autonomy and battery life: with wired earphones, unplugged when not in use.

There are currently no data on the environmental impact of manufacturing earphones, whether wired or Bluetooth, but we can advise you to keep the ones you have as long as possible. If they don’t work and can’t be repaired, then using wired earphones seems to be the best option, with no battery and a lower energy impact on your smartphone battery.

We therefore recommend you listen to these podcasts (with wired earphones, of course):

Which mobile carpooling application has the greatest environmental impact?

Reading Time: 8 minutes

Everyday car-sharing is a way of sharing the environmental impact of car travel. There are applications that put drivers and passengers in touch with each other. However, the savings made during a journey must not be outweighed by the impact of the IS of these services. In this article, we will look at the eco-design practices of three daily car-sharing applications: BlaBlaCarDaily, Karos and Klaxit.

Methodology 

This comparative study of mobile applications examines various aspects, such as the size of APK files (the installation files for Android applications), application compatibility and the greenhouse gas (GHG) emissions caused by their use. The results highlight significant differences between applications, underlining the importance of implementing an eco-design approach.

First of all, it’s important to remember that the vast majority of a smartphone’s environmental impact is due to its manufacturing phase. A great deal of energy and materials, some of them rare, are needed to manufacture the product. Therefore, to effectively reduce the impact of a mobile application, it is necessary to ensure that it does not force users to change phones in order to obtain a suitable user experience. This involves evaluating a number of criteria, including but not limited to the following:

Compatibility: an application must be compatible with all user terminals (OS, screen resolution, etc.). We found that some applications were designed exclusively for more recent versions, limiting access for users with older devices. This incompatibility often leads to frequent replacement of devices, which can waste natural resources and increase electronic waste.

Battery use: battery wear and tear is one of the material causes of the need to buy a new phone. One of the factors that wear out the battery is the number of charge/discharge cycles the phone goes through. It is therefore essential that using the application does not require too much energy so as not to accelerate the draining of the battery.

Performance: this criterion corresponds to the application’s response time. Firstly, the aim of an eco-design approach is to enable users who do not wish to renew their phone to have a pleasant user experience, even on older devices. Secondly, longer charging times mean faster battery wear. Finally, if the factor limiting performance is network quality, mobile users will be even more affected.

    – Taille de l’APK : cet indicateur provoque 2 impacts différents. Premièrement, une application avec une taille importante nécessite un échange de données plus important pour être installée ou mise à jour. Deuxièmement, un utilisateur qui souhaite conserver son téléphone longtemps peut être amené à devoir gérer des problèmes de manque de mémoire. En effet, la taille des logiciels et des applications va croissante (on parle d’obésiciel). Dans un objectif de l’encourager dans cette démarche, il est nécessaire que le stockage utilisé par l’application soit le plus réduit possible. Dans cet article, nous allons nous focaliser uniquement sur la taille de l’APK, mais une démarche d’éco-conception doit également être menée sur l’ensemble des données stockées sur le téléphone, comme le cache.

APK size: this indicator has 2 different impacts. Firstly, a large application requires more data to be exchanged in order to be installed or updated. Secondly, users who want to keep their phone for a long time may have to deal with memory shortages. This is because software and applications are becoming increasingly large (known as “bloatware“). To encourage this, the storage used by the application needs to be as small as possible. In this article, we will focus solely on the size of the APK, but an eco-design approach must also be applied to all the data stored on the phone, such as the cache.

During an environmental impact analysis at Greenspector, we examine all these points to provide recommendations that will enable our clients to gain an accurate picture of their situation and reduce their environmental impact.

APK size comparison

First of all, let’s assess the size of each app, once installed on a Samsung Galaxy S9 (Android 11). Given that they all fill the same functional areas, we’d expect them to be roughly similar in size. However, the Klaxit application stands out because of its size. There may be several reasons for this difference. For example, the application uses more external SDKs, or it embeds more uncompressed resources (images, videos, etc.).

Application APK size
Karos48.66 MB 
BlaBlaCarDaily55.70 MB 
Klaxit 84.23 MB 

Application compatibility comparison

Another essential criterion we studied was the compatibility of applications with different versions of Android. For example, an application that is not compatible with a version lower than Android 8 would prevent 7.1% of Android owners from using the application.

Application Minimum Android version requiredNumber of Android phone owners able to download the application
Karos Android 8.0 94.0% 
BlaBlaCarDailyAndroid 7.0 96.1% 
Klaxit Android 7.0 96.1% 

The Karos application therefore enables 2.1% less users to use their car-sharing service. This difference may not seem significant, but let’s calculate the emissions avoided by supporting Android 6.0 instead of just 7.0.

According to ARCEP, 37% of smartphone renewals are due to a partial malfunction (real or supposed), including breakage of non-essential components, battery wear, obsolescence and software obsolescence. 
Let’s assume a fair distribution of these four reasons. We arrive at a renewal rate due to the OS (software obsolescence) of 9.25%.

According to ARCEP, there will be an estimated 48.4 million smartphone owners in France in 2021. Let’s assume that each smartphone owner has just one device. Let’s also assume that 10% of French people need access to a daily car-sharing service (strong assumption). This is equivalent to saving on the manufacture of N smartphones:

N = 10% * 9.25% * 2.1% * 48.4 M 
N = 9.4 k 

According to our environmental assessment model, the entire life cycle of a smartphone, excluding the use phase, emits an average of 59 kgCO2eq. The emissions avoided represent:

Etot = 9.4 * 59 = 554 T CO2 eq 

Comparison of GHG emissions

a) Explanation of our methodology

Pour évaluer les émissions de gaz à effet de serre des applications, nous avons suivi une méthodologie rigoureuse basée sur la collecte de métriques pendant le parcours automatisé sur un téléphone réel : la consommation d’énergie de l’appareil, la quantité de données mobiles échangées et le nombre de requêtes HTTP effectuées. Grâce à ces données mesurées et le modèle d’évaluation d’impact environnemental Greenspector Studio, nous sommes en mesure de réaliser une estimation des émissions de CO2. Une explication plus précise du modèle utilisé est détaillée dans cet article : https://greenspector.com/fr/methodologie-calcul-empreinte-environnementale/ 

Assumptions used in the environmental assessment

  • Location of users: 100% in France
  • Location of servers: 100% in France
  • Devices used: smartphones only

b) Explanation of the route

These measurements have been carried out on the basis of user journeys that we have broken down into short stages. We are looking at the situation from the point of view of a passenger wishing to travel daily from the centre of Nantes to Carquefou. These routes have been set up in such a way that the same functionalities are evaluated, namely “listing available drivers” and “having details of a particular journey”. Each route is therefore made up of all or some of these stages:

  • Launching the application
  • Scroll to the home page
  • Load a list of available drivers
  • Load details of first journey

These different stages give us an overview of several elements generally present in a mobile application, such as a scrolling page or a complex element (integration of a route map). The launch stage is also very important because it can provide us with essential information, for example on the caching of data or the time taken to launch the application.

In order to obtain the most reliable measurement possible, we are writing a GDSL script to automate the execution of 5 identical series of tests. GDSL is a language developed by Greenspector that can be used to script test runs on Android and iOS smartphones. For more information, see our dedicated article.

Measurement context

  • Samsung Galaxy S10, Android 10
  • Network: Wi-Fi
  • Brightness: 50
  • Tests carried out over at least 3 iterations to ensure reliability of results

C) Results 

Once the measurements had been taken, the results were analysed to establish an assessment of the carbon footprint of the route chosen for the three car-sharing applications. A table comparing the results was drawn up. The following results are expressed in grams of CO2 equivalent.

Application CO2 emissions (g CO2e)
Karos 1,32
BlaBlaCarDaily 1,88
Klaxit 2,15

The results show a certain disparity between the different applications, which clearly demonstrates the impact that the design and development of an application can have on its greenhouse gas emissions. In this article, we will confine ourselves to a superficial analysis, including only comparative elements for the sake of brevity. For example, the choice of implementation of the interactive map will not be analysed. However, in the context of an application optimisation project, the analysis would be extended to provide more exhaustive recommendations.

In addition to our study on CO2 emissions, it should be emphasised that the environmental impact of applications goes beyond greenhouse gas emissions alone. The manufacture of a smartphone generates other pollution factors. Taking other environmental factors into account, such as aquatic eco-toxicity or the depletion of abiotic resources, would enable us to understand the issues linked to digital pollution in their entirety.

Analyse

Les résultats de l’évaluation environnementale ont montré que le parcours Klaxit était plus émetteur en GES que les deux autres, à hypothèses équivalentes. La cause de ses moins bonnes performances est double : la quantité de données échangée de Klaxit est très importante comparée aux consommations d’énergie et la consommation en énergie se démarque du meilleur parcours, Karos. 95% des consommations de données du parcours de Klaxit se font lors du lancement de l’application.

Application Amount of mobile data exchangedEnergy consumption
Karos 115 ko 9,1 mAh
BlaBlaDaily336 ko 13,1 mAh  
Klaxit 3150 ko 12,7 mAh 
Capture d'écran de l'application Klaxit

On inspecting the Klaxit screen, we noticed the presence of an image carousel, a practice we tend not to recommend to our customers: as well as making navigation unintuitive, the animation leads to continuous energy consumption. As it happens, none of the images in this carousel are cached, which leads to very large data exchanges from the very first screen of the application.

In terms of energy consumption, the Klaxit application is not really more intense than the others. In fact, it’s the number of steps required to complete the same functions that is greater, which lengthens the user journey and consequently increases energy consumption. In fact, compared with Karos, additional scrolling and loading are required. Reviewing the user path and proposing optimisations to shorten it would bring the Klaxit application up to the level of the other two.

So, by simply taking measurements on a rudimentary path, we find two fundamental levers for action in digital eco-design: upstream conception and design (optimisation of the user path, carousel), and development practices (image caching). These two areas for improvement need to be considered together, in order to bring together two key players in the design of digital services: designers and developers.

Conclusion

The analysis highlights the fact that some applications are lagging behind in terms of eco-design. However, there are ways of improving digital services. By better understanding every aspect of a mobile application, we can identify opportunities to reduce the ecological footprint while improving the user experience. For example, designers and developers need to work together to encourage more sustainable and responsible use to ensure the environmental benefits of using a virtuous service. We are ready to support any company wishing to improve its approach to application design.

From Green Pitch to Green IT: are the Champions League finalists’ apps in the game?

Reading Time: 8 minutes

The world of football is one of the most popular and influential sectors of our society. Millions of fans come together every week to support their favourite team and experience moments of passion and excitement. However, it’s time to be aware of the environmental consequences of this all-consuming passion. In this article, we will look at the eco-design practices of the applications of the 4 semi-finalist clubs in the 2022-2023 Champions League.

Calculation methodology

In our comparative study of the mobile applications of the 4 semi-finalists in the Champions League, we examined various aspects, such as the size of the applications, their compatibility and the greenhouse gas (GHG) emissions caused by their use. The results highlight significant differences between the applications, underlining the importance of implementing an eco-design approach.

First of all, the vast majority of a smartphone’s environmental impact is due to its manufacturing phase. A great deal of energy and materials, some of them rare, have to be used in the manufacture of the product. Consequently, to effectively reduce the impact of a mobile application, it is necessary to ensure that it does not force users to change phones in order to obtain a suitable user experience. This involves a number of criteria, including but not limited to the following:

  • Battery use: battery wear and tear is one of the main causes of the need to buy a new phone. One of the factors that wear out the battery is the number of charge/discharge cycles the phone goes through. It is therefore essential that using the application does not require too much energy so as not to accelerate the draining of the battery.
  • Performance: this criterion corresponds to the application’s response time. There are 2 reasons why this criterion needs to be taken into account. Firstly, the aim of an eco-design approach is to enable users who do not wish to renew their phone to have a pleasant user experience, even on older devices. Secondly, longer loading times mean more electricity used, and therefore faster wear and tear on the battery.
  • Application size: this indicator has 2 different impacts. Firstly, when the application is downloaded, a large application requires more data to be exchanged. Secondly, users who want to keep their phone for a long time may have to deal with problems of memory shortage. In order to encourage this sobriety approach, the amount of memory used by the application needs to be as small as possible. In this article we will focus solely on the size of the application, but a sober approach must also be taken to all the data stored on the phone, such as good cache memory management.

During an environmental impact analysis at Greenspector, we examine all these points to provide recommendations that will enable our clients to gain an accurate picture of their situation and reduce their environmental impact.

Analysis of results

Comparison of application sizes

First of all, we evaluated the size of the APK files of the selected applications. We found considerable variations in their size, ranging from light, space-saving applications such as Inter Milan to larger ones such as Real Madrid. These differences can have an impact on mobile device storage memory and data consumption when downloading and updating applications.

The size of the application may vary depending on the phone. The following results were obtained with a Samsung S10 running Android 12.

Application compatibility comparison

Another key criterion we looked at was the compatibility of applications with different versions of Android. We found that some applications were designed exclusively for more recent versions, limiting access for users with older devices. This incompatibility often leads to frequent replacement of devices, which can waste natural resources and increase electronic waste.

ClubMinimum Android version requiredPercentage of Android phone owners able to download the application
Real MadridAndroid 6.097,9%
Manchester CityAndroid 6.097,9%
Inter MilanAndroid 7.096,2%
AC MilanAndroid 5.099,3%

Comparison of greenhouse gas emissions

Explanation of our methodology

To assess the greenhouse gas emissions of applications, we have followed a rigorous methodology based on data measured on real phones concerning the energy consumption of mobile devices, execution time and the quantity of mobile data exchanged. Using this measured data and a model developed by our teams, we are able to estimate CO2 emissions. For a more detailed explanation of the methodology, please see our dedicated article.

Defining the journey

These measurements were carried out on the basis of a user journey that we divided into short steps. The criterion for choosing this journey was that it could be carried out on all 4 applications so that a comparison could be made:

These different steps give us a view of several elements that are typically present in a mobile application, such as a scrollable page, a complex element (a calendar in this case) and a video. The launch steps is also very important, as it can provide us with essential elements of understanding, such as data caching or the time taken to launch the application.

In order to obtain the most reliable measurement possible, we are creating a script to automate the execution of 3 identical series of tests.

The results

After carrying out a detailed analysis, we drew up a comparative table of the results, highlighting the applications with the lowest GHG emissions and those with the largest environmental footprint.

The following results are expressed in tonnes of CO2 equivalent.

The results obtained show a wide disparity between applications, demonstrating the extent to which the way in which an application is designed and developed has an impact on greenhouse gas emissions. In order to keep this article succinct, we are only going to analyse one element that explains this difference. But bear in mind that the analysis can (and should) be taken further to highlight all the critical points of the applications.

In addition to our study on CO2 emissions, it should be emphasised that the environmental impact of applications goes beyond greenhouse gas emissions alone. Experts such as mining geologist Aurore Stéphant have highlighted other aspects to consider when assessing the ecological footprint of the digital sector. In a recent conference entitled “Mining rush in the 21st century: how far will the limits be pushed?“, she addresses crucial issues such as the consumption of natural resources in the production of smartphones, the extraction of the minerals needed to manufacture them, and all the waste resulting from mining. There are many ethical issues to consider in our use of digital tools.

Video impact

During our comparative analysis, we identified a subject that largely explains the differences in environmental impact: video. Videos have become a central element in many applications, and their growing consumption is contributing to the increase in greenhouse gas emissions from the digital sector. The growing popularity of high-resolution video is leading to intensive use of hardware resources on mobile devices. Smartphones need to be equipped with more powerful processors and batteries to process and display this content, which can lead to more frequent replacement of devices. What’s more, they need servers to store and distribute the content, as well as solid network infrastructures to enable smooth streaming. These servers and infrastructures have material and energy requirements at the time of manufacture, and consume a significant amount of electricity.

In this case, we see the following results for the amount of mobile data exchanged for each application:

ClubAmount of mobile data exchangedTest execution time
Real Madrid12.4 MB3min 52s
Manchester City73.3 MB4min 08s
Inter Milan211.3 MB3min 57sec
AC Milan5.8 MB4min 01s

If we take the case of Inter Milan, we can see that this application consumes much more data than its competitors. There are several reasons for this:

  • Non-optimisation of the video: the results of the 30s video viewing steps are very interesting because they allow us to compare the data exchanged by the applications for a single video.
  • Autoplay: feature commonly used on websites and streaming platforms to automatically launch videos or multimedia content as soon as the user accesses a page or application. This practice has a significant environmental impact. Autoplay leads to increased energy consumption, as videos are launched and loaded automatically, even if the user is not actually watching them. The case of the Inter Milan application is quite striking in this respect, as autoplay is activated on all pages containing video. This is particularly the case on the home page, which means that a lot of data is exchanged each time the application is used, even if the user only wants to watch the score of a match.

Video consumption plays a major role in the differences in environmental impact between applications. Mobile developers can help to reduce this impact by optimising video compression, favouring low-resolution delivery by default and encouraging responsible use of video functionalities. Users, for their part, can adopt more conscious viewing practices and limit their video consumption wherever possible. A combination of efforts from all the players involved can contribute to a more sustainable and responsible use of mobile applications.

Video optimisation solutions

Fortunately, solutions do exist and a more in-depth analysis can drastically reduce the impact of videos on the environment.

One approach is to optimise video compression. By using efficient codecs and advanced compression algorithms, it is possible to reduce the size of video files while maintaining acceptable visual quality. This reduces the demand for bandwidth when broadcasting videos, thereby reducing the CO2 emissions associated with their transmission. Intelligent management of video resolution can also help to reduce the carbon footprint of applications.

Alongside these technical measures, it is also important to encourage responsible use of video. Making users aware of the environmental impact of excessive video broadcasting, and encouraging them to adopt practices such as limiting background streaming and reducing resolution when high quality is not required, can have a significant effect on reducing CO2 emissions.

Finally, by combining technical solutions with responsible practices on the part of users, it is possible to considerably reduce the environmental impact of videos in mobile applications. It is essential that developers, content providers and users work together to encourage more sustainable and responsible use of this popular and ubiquitous feature. By acting collectively, we can preserve the quality of our digital experiences while minimising our impact on the environment.

Conclusion

The 2023 Champions League semi-finalists, Real Madrid, AC Milan, Inter Milan and Manchester City, need to consider the environmental impact of their operations. While these clubs enjoy a global reputation and a passionate fan base, it is essential to recognise the environmental footprint associated with their operations, including the use of mobile applications. However, it is encouraging to see that solutions exist to improve this situation. By better understanding these aspects, we can identify opportunities to reduce the ecological footprint while improving the user experience. We are ready to support these clubs as they move towards greater environmental sustainability. Together, we can develop appropriate strategies, implement innovative practices and promote environmental awareness among fans. The aim is to create a genuine synergy between sport and the protection of our planet.

Players in the world of sport, measure the ecological footprint of your application now and take concrete steps to reduce your environmental impact. Together, let’s score goals for sustainability and protect our sport and our planet.

For each site and each application, measured on a Samsung Galaxy S10 (Android 12), the measurements were carried out using scripts based on GDSL (Greenspector Domain-Specific Language). This language is used to automate actions to be carried out on a phone. The measurements were carried out between 3 and 5 May 2023.

Each measurement is the average of 3 homogeneous measurements (with a small standard deviation). The power consumption measured on a given smartphone using a wifi network may be different on a laptop using a wired network, for example. For each iteration on the websites, the cache is emptied beforehand.

On the footprint projection side, the parameters taken into account for these rankings are :

  • Viewing ratio: 100% Smartphone
  • Viewing ratio: 100% Worldwide
  • Server location: 100% Worldwide

The number of users considered for the calculation is 100,000 per day.

Lydia vs Pumpkin

Reading Time: 3 minutes

For this first battle of 2021, we compare two payment applications between relatives: Lydia and Pumpkin. The advantage of these applications? Immediate repayment between friends in just a few clicks via a phone number. No more need to go through the traditional tedious steps of collecting an IBAN, adding it to a list of beneficiaries and the action of a transfer order (which will sometimes be received within 48 hours). Let’s find out together which application has the least carbon impact and the least consumption for your smartphone.

About Lydia: Created in 2011 this French fintech specializes in mobile payment and allows its users to pay and manage their money from the application.

About Pumpkin: Created in 2014 the French application offers payment between relatives and recently allows its users to take advantage of cashback.

The fight

All the spotlights are on the fighters, and the match can finally begin.

In the first part of the battle to measure the impact of the launch phase of the application, on this side, Lydia (0,104 g eqCO2) wins the first round by impacting 2% less than the Pumpkin application (0,106 g eqCO2).

During the second round which corresponds to the usage scenario, collecting a payment, Lydia takes the lead (0.181 g eqCO2) which leads against Pumpkin (0.314 g eqCO2) with a 42% lower carbon impact.

To put an end to this confrontation, we have set up two decisive rounds of observation of the rest phases of each opponent. If the Pumpkin application earns points by showing an 8% lower carbon impact for the foreground inactivity phase compared to Lydia, it is the most impacting on the background inactivity phase by 4%.

The bell rings, end of the match!

The winner

The Lydia app wins this match.

If we add the Carbon Impacts of all the scenarios measured, the Lydia application leads with a 26% lower carbon impact than the Pumpkin application.

Several answers can explain the differences in impact and energy and data consumption: Pumpkin presents several additional screens compared to Lydia:

  • Security screen at launch (pin code)
  • Contact directory synchronization pop-up during payment collection scenario
  • Animation during the confirmation of validation of the transaction
  • The news feed on the home page

For those who like numbers

ApplicationsVersionDownloadsPlaystore GradeApp weight
Lydia10.101 000 000+3,8112MB
Pumpkin5.19.0500 000+4,5119MB

For each of these applications, measured on an S7 smartphone (Android 8), the measurements were carried out through our GREENSPECTOR Benchmark Runner, allowing automated tests to be carried out.

Details of the scenarios:

  • Loading the application
  • Foreground application inactivity
  • Background application inactivity
  • User scenario: collecting a payment (30 seconds)

Each measurement is the average of 5 homogeneous measurements (with a low standard deviation). The consumption measured on the given smartphone according to a Wi-Fi type network can be different on a laptop PC with a wired network. For each of the iterations, the cache is first emptied.

To assess the impacts of infrastructures (datacenter, network) in the carbon projection calculations, we relied on the Greenspector methodology based on real data measured from the volume of data exchanged. This evaluation methodology takes into account the consumption of resources and energy in use for the requested equipment. As this is a very macroscopic approach, it is subject to uncertainty and could be refined to adapt to a given context, to a given tool. For the Carbon projection, we assumed a 50% projection via a Wi-Fi network and 50% via a mobile network.

To assess the impacts of the mobile in the carbon projection calculations, we measure the energy consumption of the user scenario on a real device and to integrate the material impact share, we rely on the theoretical wear rate generated by the user scenario on the battery, the first wearing part of a smartphone. 500 full charge and discharge cycles, therefore, cause a change of smartphone in our model. This methodology and method of calculation have been validated by the consulting firm specializing in eco-design, Evea.

Facebook app vs Facebook web

Reading Time: 3 minutes

For this week’s battle, we are comparing the Facebook application with its web version on Chrome. Note that the measurements were taken from an account connected to the social network.

L’application Facebook created in 2014 and founded by Mark Zuckerberg is an online social network that allows its users to post images, photos, videos, files and documents, exchange messages, join and create groups and use a variety of applications. In 2017, the social network had more than 2.1 billion subscribers.

The fight

All the lights are now turned on the fighters and the match can finally begin.

In the first part of the battle to measure the impact of the launch phase of the application, on this side it is the web version of Facebook (2.48 mAh) which wins the first round by consuming 30% less than the application (3,28 mAh). During the second round which corresponds to the usage scenario, it is the application version (10.13 mAh) which leads to that of the web (21.52 mAh) with a energy consumption lower than 53%. To put an end to this confrontation, we have set up two decisive rounds of observation of the rest phases of each opponent. The web version displays a consumption of less than 30% for the inactivity phase in the foreground but is the most consuming side of the inactivity phase in the background with 3% more than the application version.

The bell rings, end of the match!

The winner

It’s the web version of Facebook that wins this match. The Facebook application is the best in terms of energy consumption, with an overall score of 14.06 mAh to 26.33 mAh, i.e. 39% less battery consumption compared to its web version. However, the web version on Chrome displaying Facebook consumes 71% less data on the user scenario side.

If we project the journey for one minute in carbon impact, the Facebook application consumes 1.42 gEqCO2 or the equivalent of 12.71 meters made in a light vehicle against 1.06 gEqCO2 for the web version or the equivalent 9.48 meters. It is therefore the web version of Facebook that should be preferred!

For those who like numbers

ApplicationVersionDownloadsPlaystore gradeApp weighting (MB)Exchanged data (MB)Memory consumption (MB)Energy consumption (mAh)Carbon Impact (gEqCO2)
Facebook269.0.0.50.1275 000 000 000+4.322712.56321.4516.061.42
Facebook via Chrome81.0.4044.1385 000 000 000+4.32207.35781.8126.331.06

The measurements were carried out by our laboratory on the basis of a standardized protocol, respecting a specific user scenario (launch of the app, timeline scrolling). The other scenarios are the launch of the application (20”), inactivity in the foreground (20”) and inactivity in the background (20”). This methodology makes it possible to estimate the embedded application complexity and its energy impact during the use phase.

The Carbon Impact calculation is based on a projection according to the OneByte methodology of the Shift Project for the server and network part. Assumption calculated according to network and datacenter impact in France, for network connectivity 50% Wi-Fi, 50% mobile network, device life based on 500 full charge / discharge cycles.


Retrouvez la battle de la semaine dernière : Petit Bamboo vs Meditopia Des idées de battles ? Contactez-nous !

Petit Bamboo vs Meditopia

Reading Time: 3 minutes

For this special stay-at-home battle, two online meditation apps will oppose: Petit Bamboo vs Meditopia.

In the left corner Petit Bamboo, application created in 2014 which has more than 5 million active users and which is also a French leader app in meditation. The app is also available in German or Spanish.

In the right corner Meditopia, a French meditation and mental well-being application with more than 3 million users worldwide. The company was created in 2017 and claims to be the best French meditation application.

The weighting

At weighing Meditopia is the heavier application with a weight of 61,7 MB. Its opponent Petit Bamboo is lighter with a weight of 51,3 MB, or 17% less.

The fight

All the lights are now turned on the fighters and the match can finally begin.

In the first part of the battle to measure the impact of the launch phase of the application,  Petit Bamboo (2,5 mAh) wins the first round by consuming 34% less than his opponent Meditopia (3,8 mAh). In the second round that corresponds to the use scenario,  Petit Bamboo (6,1 mAh) still leads to Meditopia (7,6 mAh) with a 20% lower consumption. To end this confrontation, we have set up two decisive rounds of observation of the rest phases of each opponent.  Petit Bamboo is still the leader of the battle with a consumption of less than 23% for the background inactivity phase and 3% for the foreground inactivity phase.

The bell rings, end of the match!

The winner

The Petit Bamboo application won this match with an overall score of 11.4 mAh to 14.8 mAh, or 23% less battery consumption compared to its opponent Meditopia. If we project the journey for one minute in carbon impact, the Petit Bamboo application consumes 0.11 gEqCO2 or the equivalent of 1 meter made in a light vehicle against 3.82 gEqCO2 for Meditopia, or the equivalent of 34 meters.

However, the two applications are different in regard to the data management. Indeed, Petit Bamboo forces downloading programs for listening while Meditopia does not. Thus, Meditopia consumes 36.5 MB of data during the user scenario, where Petit Bamboo consumes only 222 KB. When downloading programs on the Petit Bamboo side, the storage space suffers.

The choice is difficult: if your priority is to consume less battery, opt for Petit Bamboo application especially if you are one of the users who have an expensive data plan or a bad network connection. Prefer Meditopia if your storage space is precious to you.

For those who like numbers

ApplicationVersionDownloadsPlaystore gradeApp weight (MB)Exchanged data scenario (MB)Memory consumption scenario (MB)Energy consumption (mAh)
Petit Bamboo3.7.51 000 000+4.751.30.22230311.4
Meditopia3.10.41 000 000+4.561.736.556914.8

On a 1-minute usage scenario, Meditopia has a consumption equivalent to that of a video games app such as Clash of Clan. As for Petit Bamboo, its consumption is similar to a social app app such as Snapchat. (Source: Study Consumption of top 30 most popular mobile applications)

The measurements were carried out by our laboratory on the basis of a standardized protocol, respecting a specific user scenario (launch of the app, first meditation program). The other scenarios are the launch of the application (20”), inactivity in the foreground (20”) and inactivity in the background (20”). This methodology makes it possible to estimate the embedded application complexity and its energy impact during the use phase.


Read the previous battle : 7 Minutes Workout vs Home Workout. Any battle ideas? Contact-us!

7 Minutes Workout vs Home Workout

Reading Time: 3 minutes

For this special “stay at home” battle, two applications offering full-body workout will oppose:  7 Minutes Workout vs Home Workout.

In the left corner 7 Minutes Workout, the application, which has more than 3,000,000 users, offers sports training lasting 7 minutes based on the HICT (high intensity training circuit).

In the right corner  Home Workout, app part of the Leap Fitness Group which offers daily exercise routines for all major muscle groups.

The weighting

At weighing Home Workout is the most caloric application with a weight of 43 MB. The  7 Minutes Workout application is 14% lighter with a weight of 37 MB.

The fight

The athletes are getting ready to compete on a full-app challenge program!

The first part of the program naturally consists of observing the launch phase (or warm-up) of the application. 7 Minutes Workout (1,71 mAh) wins the first round by consuming 24% less than its opponent Home Workout (2,25 mAh). During the second round which corresponds to the scenario of the user journey (carrying out a beginner sports program), it is always 7 Minutes Workout (5,61 mAh) which leads to Home Workout (6,92 mAh) with lower consumption by 19%. To put an end to this confrontation, we have set up two decisive rounds to observe the rest phases of each opponent. While we are at the stretching stage, Home Workout takes over on 7 Minutes Workout by consuming 18% less in the inactivity stage in the foreground. The applications are neck and neck for the inactive phase in the background, however 7 Minutes Workout takes over by consuming 6% less than its opponent!

The bell rings! End of training!

The winner

Without any surprie, the 7 Minutes Workout app won this match with an overall score of 9,48 mAh to 11,19 mAh, or 15% less battery consumption compared to its opponent Home Workout. Note that 7 Minutes Workout is also less consumer in terms of data exchanged, 16 KB against 2,8 MB for Home Workout.

If we project the journey for one minute in carbon impact, the 7 Minutes Workout application consumes 0,10 gEqCO2 or the equivalent of 0.88 meters performed in a light vehicle against 0,39 gEqCO2 for Home Workout or the equivalent of 3.51 meters.

For those who like numbers

ApplicationVersionDownloadsPlaystore Grade Application weight (MB) Exchanged data scenario (KB) Memory consumption scenario (MB)Energy consumption (mAh)
7 Minutes Workout1.363.111 10 000 000+4,8370.0162799,48
Exercices à la maison1.0.42 50 000 000+4,8432.837711,19

On a 1-minute usage scenario, 7 Minutes Workout’s energy consumption is equivalent to a direct messaging application such as Line. As for Home Workout, its consumption is similar to an application such as a social network such as Facebook Like. (Source: Study Consumption of top 30 most popular mobile applications) .

The measurements were carried out by our laboratory on the basis of a standardized protocol, respecting a specific user scenario (launch of the app, search for a workout, workout exercices). The other scenarios are the launch of the application (20”), inactivity in the foreground (20”) and inactivity in the background (20”). This methodology makes it possible to estimate the embedded application complexity and its energy impact during the use phase.

The Carbon Impact calculation is based on a projection according to the OneByte methodology of the Shift Project for the server and network part. Assumption calculated according to network and datacenter impact in France, for network connectivity 50% Wi-Fi, 50% mobile network, device life based on 500 full charge / discharge cycles.

Marmiton vs 750g

Reading Time: 3 minutes

For this special “stay at home” battle, two applications offering cooking recipes will oppose: Marmiton et 750g.

In the left corner  Marmiton, a French application launched in 2000 which lists more than 71,000 cooking recipes. Marmiton also has 12.8 million unique visitors each month.

In the right corner 750g, created in 2010, is the second site offering recipes and culinary advice the most visited in France (8 million unique visitors each month). This site and application offers more than 80,000 recipes.

The weighting

At weighing 750g is the most caloric application with a weight of 90 MB. The Marmiton application is 61% lighter with a weight of 56 MB, which makes it still a relatively heavy application.

The fight

The fighters are getting ready to go on the grill!

In the first part of the match which naturally consists in observing the launch phase of the application, 750g (2.75 mAh) wins the first round by consuming 7% less than its opponent Marmiton (2.93 mAh). In the second round that corresponds to the use scenario (search for a chocolate fondant recipe), it is always 750g (7.69 mAh) which leads to Marmiton (10.48 mAh) with a lower consumption of 36%. To end this confrontation, we have set up two decisive rounds of observation of the rest phases of each opponent. While we are at the tableware stage, the two applications consume in an equivalent manner for the observation phase in the foreground (1.24 mAh). Nevertheless, in the observation phase in the background, Marmiton is in the lead with 14% less consumption.

The timer sounds, end of cooking for our two applications!

The winner

Without any surprise, the 750g application wins this match with an overall score of 12.6 mAh to 15.4 mAh, i.e. 18% less battery consumption compared to its opponent Marmiton, for whom the check is salty… Note that 750g is also less consumer in terms of data exchanged, 286 KB against 693 KB on the side of Marmiton.

Note that these two applications are particularly rich in elements listed by Exodus Privacy as falling under tracking and analytics tools: 11 for Marmiton, 17 for 750g… It makes people squint on your plate.

For those who like numbers

ApplicationVersionDownloadsPlaystore GradeApplication weight (MB)Exchanged data (KB)Memory consumption (MB)Energy Consumption(mAh)
Marmiton5.2.43 5 000 000+4,59069364215,47
750g4.2.6 1 000 000+4,45628633912,63

On a 1-minute usage scenario, Marmiton’s energy consumption is equivalent to a navigation application such as Google Chrome. As for 750g, its consumption is similar to an application such as a social network such as Instagram. (Source: Study Consumption of top 30 most popular mobile applications)

The measurements were carried out by our laboratory on the basis of a standardized protocol, respecting a specific user scenario (launch of the app, search for a recipe). The other scenarios are the launch of the application (20”), inactivity in the foreground (20”) and inactivity in the background (20”). This methodology makes it possible to estimate the embedded application complexity and its energy impact during the use phase.

Babbel vs Duolingo

Reading Time: 3 minutes

For this week’s battle, two online language learning apps will oppose: Babbel vs Duolingo.

In the left corner Babbel, a paid online language learning app created in 2007 in Berlin. When it was founded, the german startup was the first company to offer an online language learning service. Today, Babbel offers learning 14 languages.

In the right corner Duolingo, created in 2011, the application also offers language learning, but it is free of charge. Duolingo offers a richer catalog than Babbel’s: 37 languages.

The weighting

At weighing Babbel is the heavier application with a weight of 90 MB. Its opponent Duolingo is lighter with a weight of 56 MB, or 61% less.

The fight

All the lights are now turned on the fighters and the match can finally begin.

In the first part of the battle to measure the impact of the launch phase of the application, Babbel (1.5 mAh) wins the first round by consuming 25% less than his opponent Duolingo (2 mAh). In the second round that corresponds to the use scenario, Babbel (13.5 mAh) still leads to Duolingo (19.5 mAh) with a 31% lower consumption. To end this confrontation, we have set up two decisive rounds of observation of the rest phases of each opponent. Babbel is still the leader of the battle with a consumption of less than 34% for the background inactivity phase and 54% for the foreground inactivity phase.

The bell rings, end of the match!

The winner

Without any surprise, the app Babbel wins this game on a global score of 17.2 mAh at 25.5 mAh, or 32% less battery consumed compared to his opponent Duolingo. Note that Babbel is also much less consumer in terms of data exchanged, 224 KB against 4.9 MB on the side of Duolingo.

For those who like numbers

ApplicationVersionDownloadsPlaystore GradeApp weight (MB)Exchanged data (KB)Memory consumption (MB)Energy consumption (mAh)
Babbel20.36.010 000 000+4.5900.224147.917.2
Duolingo4.37.1100 000 000+4.7564.9230.725.5

On a 1-minute usage scenario, Babbel has a consumption equivalent to that of a video games app such as Candy Crush Saga. As for Duolingo, its consumption is similar to a browser app such as Opera Mini.(Source: Study Consumption of top 30 most popular mobile applications)

The measurements were carried out by our laboratory on the basis of a standardized protocol, respecting a specific user scenario (launch of the app, first lesson). The other scenarios are the launch of the application (20”), inactivity in the foreground (20”) and inactivity in the background (20”). This methodology makes it possible to estimate the embedded application complexity and its energy impact during the use phase.

Find the battle of last week : RocketChat vs Slack
Battles ideas? Contact us!