Category: Battles

The battle of the week: United Wardrobe vs Vinted

Reading Time: 3 minutes

“Second-hand” clothing applications are a hit with fashion lovers and platforms, and platforms have proliferated in recent years. Today we compare two competing apps: United Wardrobe and Vinted on their mobile energy consumption.

In the left corner United Wardrobe, created in the Netherlands, a real community market designed to buy and sell items from the world of fashion. Their mission is to “democratize used clothes”.

In the right corner Vinted, created in 2012 in Lithuania and which landed in France in 2013, is also a community online market whose purpose is to buy, sell and / or exchange used clothes. 1.4 million users in the hexagon.

The weighting

At weighing United Wardrobe is the heavier application with a weight of 81 MB. Its opponent Vinted is lighter with a weight of 71 MB, or 13% less.

The fight

All the lights are now turned on the fighters and the match can finally begin.

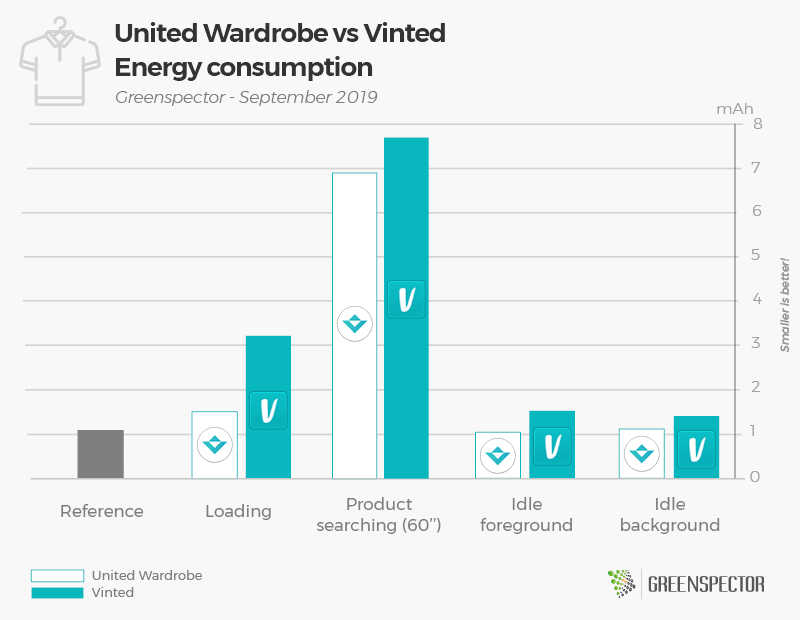
In the first part of the battle to measure the impact of the launch phase of the application, United Wardrobe (1.5 mAh) wins the first round by consuming 52% less than his opponent Vinted (3.2 mAh). In the second round that corresponds to the use scenario, United Wardrobe (6.9 mAh) still leads to Vinted (7.7 mAh) with a 10% lower consumption. To end this confrontation, we have set up two decisive rounds of observation of the rest phases of each opponent. United Wardrobe is still the leader of the game with a consumption of less than 30% for the foreground inactivity phase and 18% for the background inactivity phase.

The bell rings, end of the match!

The winner

Without any surprise, it’s the United Wardrobe app that wins this game with an overall score of 10.6 mAh at 13.8 mAh, a 23% difference in consumption against its opponent Vinted. For the data exchanged and memory consumption, it is the same observation, the application United Wardrobe is less consuming.

For those who like numbers

ApplicationVersionDownloadsPlaystore GradeApp weight (MB)Exchanged data (KB)Memory consumption (MB)Energy consumption (mAh)
United Wardrobe3.9.01 000 000+3.3811.57010.6
Vinted8.41.1.25 000 000+4.5716.313713.8

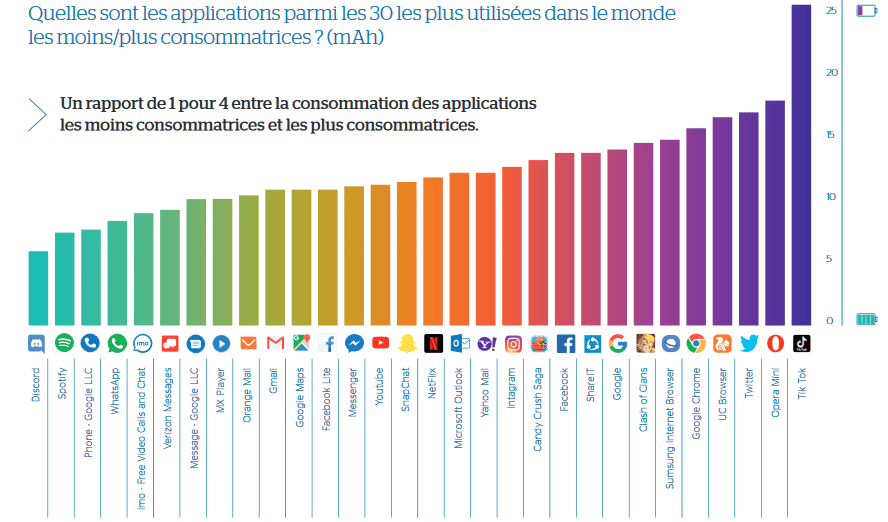
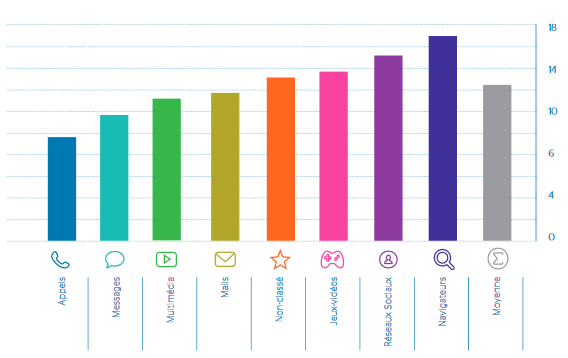
On a 1-minute usage scenario, Vinted has a consumption equivalent to that of an application like ShareIt. While United Wardrobe is getting closer to consuming an video games app such as PUBG. (Source: Study Consumption of top 30 most popular mobile applications)

The measurements were carried out by our laboratory on the basis of a standardized protocol, respecting a specific user scenario (launch of the app, product searching, product overview). The other scenarios are the launch of the application (20”), inactivity in the foreground (20”) and inactivity in the background (20”). This methodology makes it possible to estimate the embedded application complexity and its energy impact during the use phase.

Find the battle of last week : Leboncoin vs Locanto
Battles ideas? Contact us!

The battle of the week Twitter special: video vs image vs gif

Reading Time: 2 minutes

A special battle for this new season: different media on Twitter: video, image and gif. Which one is the most energy and resource consuming media when viewing a tweet?

The fight

All the lights are now turned on the fighters and the match can finally begin.

In terms of energy consumption, a tweet with video consumes 63% more than tweet with image, and 25% more than tweet with gif . The consumption of the tweet with image is equivalent to that of a tweet without media since the images remain relatively small. Nevertheless the consumption increases when the user clicks on an image and displays it in real size.
On the data side exchanged, without any surprise, the tweet with video is the most consuming media with 1.91 MB, unlike tweets with image (112 KB) and gif (92 KB), a ratio of 20 between the heaviest and the lightest. On the occupied memory side, no significant difference in consumption, the values oscillate between 244 and 228 MB.

The bell rings, end of the match!

The winner

The winning media of this match remains the tweet with image, 63% less consumer than a video and 23% than tweet with GIF. So focus on the image to the video for your tweets. In our study on the energy consumption of the 30 most popular apps in the world , we found that the category of social networks was among the most consuming. Video is the new medium favored by users. Application publishers must be vigilant and optimize their use.

For those who like numbers

ApplicationVersionDownloadsPlaystore GradeApp weight (MB)Exchanged data (KB)Memory (MB)Energy consumption (mAh)
Twitter with video8.10.0500 000 000+4.51001.912448.5
Twitter with image8.10.0500 000 000+4.51000.112228.35.2
Twitter with gif8.10.0500 000 000+4.51000.092231.26.8
Twitter without média8.10.0500 000 000+4.51000.042239.85.3

The measurements were carried out by our laboratory on the basis of a standardized protocol, respecting a specific user scenario: displaying a tweet containing a media (image, video or gif)
Kapten vs Uber

Find the battle of last week: Mixer vs Twitch
Battles ideas? Contact us!

You may also like:

Twitter vs Twitter Lite

L’impact des services tiers comme Twitter sur l’autonomie des batteries

WEBP vs PNG vs JPEG

The battle of the week: Mixer vs Twitch

Reading Time: 3 minutes

A few weeks ago, the famous American streamer under the pseudonym of Ninja announced that he left the streaming platform Twitch for its competitor: Mixer. In just a few days, the milestone of one million paid subscribers had been reached and the platform was the top spot for the most downloaded free apps in the United States. Today’s match is between these two competing applications: Mixer vs. Twitch.

In the left corner Mixer, (formerly Beam) the video game streaming service launched by Microsoft in January 2016.

In the right corner Twitch, leading platform for streaming video games (and other broadcasts) launched in June 2011. It has more than 35 million unique visitors per month.

The weighting

At weighing Mixer is the heavier application with a weight of 114 MB. Its opponent Twitch is lighter with a weight of 95 MB, or 16% less .

The fight

All the lights are now turned on the fighters and the match can finally begin.

In the first part of the battle to measure the impact of the launch phase of the application, Twitch assom Mixer in consumption more than 3x less energy. The difference in consumption is quite marked also on the streaming phase. Indeed, Twitch (11.6 mAh) dishes Mixer (15.4 mAh) K.O with a lower consumption of 24%. To end this confrontation, we have set up two decisive rounds of observation of the rest phases of each opponent. During the foreground phase, Twitch is still the master of the game, consuming 60% less. For the inactivity phase in the background it is a perfect draw!

The bell rings, end of the match!

The winner

Without any surprise, it’s a knockout victory for the Twitch app, declared victorious against its opponent Mixer on an overall score of 15.3 mAh at 23.9 mAh, either by consuming overall 56% less energy. Note that the Twitch power consumption is still very high. Twitch also dominates its competitor Mixer on memory consumption (-45%) and storage space. Mixer is doing well on data exchanged (-9%).

For those who like numbers

ApplicationVersionDownloadsPlaystore GradeApp weight (MB)Exchanged data (KB)Memory (MB)Energy consumption (mAh)
Mixer4.7.310 000 000+4.111444.5427.923.9
Twitch7.13.450 000 000+4.69549.1231.315.3

On a 1 minute usage scenario, Twitch has a consumption equivalent to a browser app such as Google Chrome. (Source: Study Consumption of top 30 most popular mobile applications)

The measurements were carried out by our laboratory on the basis of a standardized protocol, respecting a specific user scenario (launch of the app, live streaming). The other scenarios are the launch of the application (20”), inactivity in the foreground (20”) and inactivity in the background (20”). This methodology makes it possible to estimate the embedded application complexity and its energy impact during the use phase.

Find the battle of last week : Kapten vs Uber
Battles ideas? Contact us!

The battle of the week: Kapten vs Uber

Reading Time: 3 minutes

Today’s match will oppose the two VFH (Vehicle for Hire) leaders of the French market: Kapten (formerly Chauffeur Privé) vs Uber.

In the left corner Kapten, formerly Chauffeur Privé, the French VFH company founded in 2011, quickly established itself as number 2 of the French market. The company renamed Kapten early 2019, wants to conquer more users internationally.

In the right corner Uber, the American giant founded in 2009 of the VFH which has more than 100 million users internationally. Find the battle opposing UberEats vs Deliveroo.

The weighting

At weighing Uber is the heavier application with a weight of 255 MB. Its opponent Kapten is lighter with a weight of 73 MB, or 71% less.

The fight

All the lights are now turned on the fighters and the match can finally begin.

In the first part of the race which consists of measuring the impact of the launch phase of the application, it is Uber which is heading by consuming 10% less than Kapten. On the itinerary and driver research phase, Kapten (11.7 mAh) takes the advantage over Uber (11.8 mAh). To end this confrontation, we have set up two decisive rounds of observation of the rest phases of each opponent. During these periods of inactivity in the foreground and in the background, it is Kapten which is headed with a lower consumption of 7% and 3.7% compared to Uber.

The bell rings, end of the match!

The winner

The race was tight nevertheless it is Kapten which is declared victorious against the American giant Uber on a score very close to 15.4 mAh at 15.5 mAh by consuming globally 1% less energy. Let us note here that these two applications are nevertheless very energy consuming. We can decide between those two apps with the amount of data exchanged because Kapten consumes 21% less than Uber! This is the same finding with the memory consumption, where Kapten is much less consumer (-40%). Finally, if the storage space of your smartphone is precious for you, also prefer the Kapten application.

For those who like numbers

ApplicationVersionDownloadsPlaystore GradeApp weight (MB)Exchanged data (KB)Memory (MB)Energy consumption (mAh)
Kapten3.66.01 000 000+4.37310.4185.415.4
Uber4.272.10001500 000 000+4.225513.2309.415.5

On a 1 minute usage scenario, Kapten and Uber have a consumption equivalent to a web browser app such as Google Chrome. (Source: Study Consumption of top 30 most popular mobile applications)

The measurements were carried out by our laboratory on the basis of a standardized protocol, respecting a specific user scenario (launch of the app, car ordering). The other scenarios are the launch of the application (20”), inactivity in the foreground (20”) and inactivity in the background (20”). This methodology makes it possible to estimate the embedded application complexity and its energy impact during the use phase.

Find the battle of last week : Drivy vs Ouicar
Battles ideas? Contact us!

The battle of the week: Drivy vs Ouicar

Reading Time: 2 minutes

Today’s match will oppose two carsharing apps: Drivy vs Ouicar. True concept of collaborative economy launched a little over a decade ago, those applications allow car owners to rent their vehicle to individuals or professionals.

In the left corner Drivy, a French car-sharing company founded in 2010. The service is available in 6 European countries and brings together more than 2 million users.

In the right corner Ouicar, application and collaborative platform launched in 2007 by SNCF. It connects car owners with their future tenants and it too, brings together more than 2 million users.

The weighing

At weighing Ouicar is the heavier application with a weight of 65 MB. Its opponent Drivy is much lighter with a weight of 42 MB, or 35% less.

The fight

All the lights are now turned on the fighters and the match can finally begin.

In the first part of the fight which consists of measuring the impact of the launch phase of the application, it’s a draw for the two apps. The second round corresponding to the order of a car is a bit different. Indeed, Ouicar (9.3 mAh) puts Drivy (10.5 mAh) by the side of the road with a consumption lower by almost 11%. To end this confrontation, we have set up two decisive rounds of idle observation for each opponent. During the inactivity phase in the foreground, the two applications are once again at the same speed, however Ouicar go ahead Drivy during the phase of inactivity background, with a lower consumption of 9%.

The bell rings, end of the match!

The winner

The race was tight nevertheless it is Ouicar who is declared victorious against its opponent Drivy on a global score of 12.7 mAh at 14 mAh by consuming overall 9% less energy.

For those who like numbers

ApplicationVersionDownloadsPlaystore GradeApp weight (MB)Exchanged data (KB)Memory (MB)Energy consumption (mAh)
Drivy7.7.2500 000+4.2423.621814
Ouicar7.0.3100 000+4.3651.719212.7

On a 1 minute usage scenario, Ouicar has a consumption equivalent to a direct messaging application such as Line. (Source: Study Consumption of top 30 most popular mobile applications)

The measurements were carried out by our laboratory on the basis of a standardized protocol, respecting a specific user scenario (launch of the app, car ordering). The other scenarios are the launch of the application (20”), inactivity in the foreground (20”) and inactivity in the background (20”). This methodology makes it possible to estimate the embedded application complexity and its energy impact during the use phase.

Find the battle of last week : Happn vs Tinder
Battles ideas? Contact us!

The battle of the week: Happn vs Tinder

Reading Time: 2 minutes

Today’s match will oppose two social and dating apps: Happn vs. Tinder. Based on the same geographical proximity asset, where contact is created after validation of the two people via their profile, the two applications are a real current social phenomenon.

In the left corner, Happn, a French dating application created in 2014. It allows its users to find people they crossed in the day.

In the right corner, Tinder, American giant created in 2012, Happn’s competing application for networking and dating.

The weighing

At weighing Tinder is the heavier application with a weight of 170 MB. Its opponent Happn is much lighter with a weight of 79 MB, or 53% less.

The fight

All the lights are now turned on the fighters and the match can finally begin.

In the first part of the match which consists in measuring the impact of the launch phase of the application, it’s Happn that wins the first round by consumming 35% less than Tinder. The difference in consumption is very marked on the swiping profiles phase. Indeed, Happn (8.7 mAh) puts Tinder (18.6 mAh) K.O with a lower consumption of 53%. To end this confrontation, we have set up two decisive rounds of idle observation for each opponent. During the inactivity phases in foreground and background, Happn still leads with a 65% lower consumption compared to Tinder for this foreground phase and 8% for the background phase.

The bell rings, end of the match!

And the winner is…

Without any surprise, it’s a victory by knockout for Happn app, declared victorious against its opponent Tinder on an overall score of 13.5 mAh at 27 mAh, by consuming 50 % less energy.

For those who like numbers

ApplicationVersionDownloadsPlaystore GradeApp weight (MB)Exchanged data (KB)Memory (MB)Energy consumption (mAh)
Happn24.10.050 000 000+4.3794.525213.5
Tinder10.20.0100 000 000+41704.5310.527

On a 1 minute usage scenario, Happn has a consumption equivalent to an application like WhatsApp. (Source: Study Consumption of top 30 most popular mobile applications)

The measurements were carried out by our laboratory on the basis of a standardized protocol, respecting a specific user scenario (launch of the app, profiles swiping). The other scenarios are the launch of the application (20”), inactivity in the foreground (20”) and inactivity in the background (20”). This methodology makes it possible to estimate the embedded application complexity and its energy impact during the use phase.

Find the battle of last week : Bankin vs Linxo
Battles ideas? Contact us!

The battle of the week: ADA vs Europcar

Reading Time: 2 minutes

In this period of departure on vacation, we are interested in rental vehicle applications with ADA and Europcar. These two applications make it possible to select and reserve a vehicle for rental for a specified period.

In the left corner ADA, created in 1984, is a French car rental company, a subsidiary of the Rousselet group.

In the right corner Europcar, created in 1949, is also a French company, the European leader in car rental.

The weighing

At weighing ADA is the heavier application with a weight of 94.5 MB. Its opponent Europcar is much lighter with a weight of 55.7 MB, or 41% less.

The fight

All the lights are now turned on the fighters and the match can finally begin.

In the first part of the match which consists in measuring the impact of the launch phase of the application, Europcar takes the advantage, consuming 26% less than ADA. The second part aims to find and choose a rental vehicle by going to the booking phase. Once again, Europcar wins this round by consuming 22.4% less. To end this confrontation, we have set up two decisive rounds of idle observation for each opponent. During the idle background Europcar consumes less than 6%. Finally it is also Europcar who wins the last run by consuming 3% less than ADA on the idle foreground phase.

The bell rings, end of the match! The match went one way with Europcar domination for each round.

The winner is…

Without any surprise, the Europcar application is declared victorious against ADA on a score of 14.5 mAh at 18.3 mAh, by consuming 21% less energy.

For those who like numbers

ApplicationVersionDownloadsPlaystore GradeApp weight (MB)Exchanged data (MB)Memory (MB)Energy consumption (mAh)
ADA5.13.010 000+3.094.51.9828918.3
Europcar2.7.01 000 000+3.755.70.96322714.5

On a scenario of a reservation during 1 minute, Europcar consumes 40% more than an application like Discord. ADA‘s consumption is equal to Instagram‘s one. (Source: Study Consumption of top 30 most popular mobile applications)

The measurements were carried out by our laboratory on the basis of a standardized protocol, respecting a specific user scenario (launch of the app, search for a new car available, selection of a car, reservation during 1 minute). The other scenarios are the launch of the application (20”), inactivity in the foreground (20”) and inactivity in the background (20”).

Find the battle of last week : Deezer vs Spotify
Battles ideas? Contact us!

The battle of the week: Deezer vs Spotify

Reading Time: 2 minutes

Today we are interested in two streaming music platforms : the pioneer and Swedish leader Spotify and the French Deezer. Audio services have invaded our daily lives and the market share of streaming music is becoming more and more important. While it is sometimes difficult to choose from so many possibilities, we have chosen to study these two actors in order to compare their energy consumption.

In the left corner Deezer, created in 2007, is a french service of streaming music.

In the right corner Spotify, created in 2006, is a swedish service of streaming music, and one of the main competitors of Deezer.

The weighing

At the weighing Spotify is the heaviest application with 115 Mb. It’s opponent Deezer is lighter with 89.5 Mb.

The fight

All the lights are now turned on the fighters and the match can finally begin.

In the first part of the match which consists in measuring the impact of the launch phase of the application, Spotify takes the advantage, consuming 11.6% less than Deezer. The second part aims to search a music in the app and listen to it for a minute. Once again, it is Spotify which dominates its opponent consuming 4.6% less. To end this confrontation, we have set up two decisive rounds of idle observation for each opponent. During the idle background Spotify is consuming 6.25% less, while in the foreground it is Deezer which wins consuming also 6.25% less energy.

The bell rings, end of the match ! Spotify app has been better overall and has won 3 of the 4 rounds of the duel.

The winner

On a unanimous decision, Spotify wins against Deezer on a score of 13.2 mAh to 13.9 mAh, then consuming 5% less energy than its rival.

For those who like numbers

ApplicationVersionDownloadsPlaystore GradeApp weight (MB)Exchanged data (MB)Memory (MB)Energy consumption (mAh)
Deezer6.1.5.104100 000 000+4.189.5246.3204.613.9
Spotify8.5.13.637500 000 000+4.6115148.8179.113.2

On a scenario of listening music during 1 minute, the last version of Spotify is more consuming than the one before. The consumption of Deezer is almost equal to the one of an app like Whatsapp Messenger. (Source: Study Consumption of top 30 most popular mobile applications)

The measurements were carried out by our laboratory on the basis of a standardized protocol, respecting a specific user scenario (launch of the app, search for a music, select a music, listen for 1 minute). The other scenarios are the launch of the application (20”), inactivity in the foreground (20”) and inactivity in the background (20”).

Find the battle of last week : AirBnb vs Booking
Battles ideas? Contact us!

The battle of the day: AirBnb vs Booking

Reading Time: 2 minutes

Today’s match will oppose two applications of the travel and local informations category. Indeed, the fighters are AirBnb and Booking.

In the left corner AirBnb, created in 2007, is a community platform for renting and booking accomodations between individuals.

In the right corner Booking, created in 1996, is an online accommodations booking platform.

The weighing

At the weighing AirBnb is the heaviest application with 202 Mb. It’s opponent Booking is almost two times lighter with 104 Mb.

The fight

All the lights are now turned on the fighters and the match can finally begin.

The first part of the match consists in mesuring the launch of the application, and it is Booking which takes an advantage consuming two times less battery than AirBnb. For the second part we search for an accommodation according to different criterias and we start a booking. This time again the winner is Booking, but only slightly, consuming only 1% less than its rival. So far Booking is dominating the fight. The duel ends with two decisive rounds of idle observation. During the idle background and foreground Booking wins once again by consuming 18% and 10% less energy.

The bell rings, end of the match ! Booking seems to be the winner after a very controlled fight.

The winner

On a unanimous decision, Booking is declared winner. The score is 14.9 mAh to 16.7 mAh which represents 12% less energy than AirBnb.

For those who love numbers

ApplicationVersionDownloadsPlaystore GradeApp weight (MB)Exchanged data (MB)Memory (MB)Energy consumption (mAh)
AirBnb19.2750 000 000+4.52026.8274.616.7
Booking18.3100 000 000+4.71043.6226.914.9

Booking app is consuming two times more energy than an app such as Spotify. It’s consumption is almost equal to Clash Of Clans. The consumption of AirBnb is equal to an app such as UC Browser (https://play.google.com/store/apps/details?id=com.UCMobile.intl). (Source: Study Consumption of top 30 most popular mobile applications)

The measurements were carried out by our laboratory on the basis of a standardized protocol, respecting a specific user scenario (launch of the app, looking for an accommodation, choice of an accomodation, booking). The other scenarios are the launch of the application (20”), inactivity in the foreground (20”) and inactivity in the background (20”).

Find the battle of last week : Amazon Prime vs Netflix)
Battles ideas? Contact us!

Energy consumption of the 30 most popular mobile apps in the world

Reading Time: 3 minutes

All our digital uses have an impact of energy consumption and in a more global way in technical resources (RAM, CPU, Data, …). The environmental impact of digital is today important and especially in strong progression. Today, according to the project shift * report, the impact of digital in terms of greenhouse gas represents 3.7% of total emissions (GHG) on the planet and could represent, according to the assumptions, between 7 and 8.5% in 2025, the equivalent of the GHG emissions of light vehicles on the planet (8% of GHG). This is reinforced by an annual growth of 8% which remains and will remain sustained despite technological progress.

Access to information, content and services is now predominantly done on smartphones, which has become the flagship of digital activity. We connect more and more, from everywhere, and at any time.
Today, the consumption of smartphones (including the use phase and the manufacturing phase) represents 11% of the digital energy consumption. Sensitive point of this energy consumption for the smartphone that is at the battery and is the focus of all our attention and those of smartphone manufacturers. We often accuse our smartphones of lack and / or loss of autonomy … Yet it is the applications installed on the smartphone that consume! … and which also degrade its battery capacity over time. Mobile applications are now used, for the most deployed, by billions of people (more than 5 billion mobile users). Today, an application like Facebook, the most popular, is used by more than 2 billion active users per month on smartphone. The impact of these applications is therefore considerable and a significant improvement in the sobriety of one of them can have rapidly very positive consequences on the ecological impacts.

As part of the Vivatech 2019, with our partner ATOS, we wanted to raise the awareness of major digital players by benchmarking the consumption of resources and energy of the 30 most popular applications.

5 key points of this study

  • The pre-loading of the time line data is consumption factor. The fact that this content is video type like TikTok makes it a consumer application for the device but even more so on the network and the datacenter. An ecological heresy when you know that this application is used by millions of people around the world..
  • Web browsing consumes a lot of energy because the pages include many scripts, more and more (trackers, advertisements, differentiating features, …) that are not well managed by the hardware of the smartphone. Calling consumes half the average on average than surfing.
  • In each category of applications large discrepancies exist for near functionalities which can translate avoidable mess and thus gains of accessible optimizations. 30-40%?
  • Yes, listening to music on Youtube is an ecological “mistake” when you know the consumption of a Spotify. Features “listening music without image” favored on video players are expected.
  • The global electricity consumption of digital is at the scale of a continent (Russia + Japan combined), that of the use of applications on smartphones is that of a European country (equivalent to Ireland). 1/3 of gain conceivable when positioning the average of the category on the lowest consumption of the category (equivalent functionality). On a global scale, a nuclear slice avoided. For our smartphones, 2 to 3 hours of autonomy and more!