Category: Battles

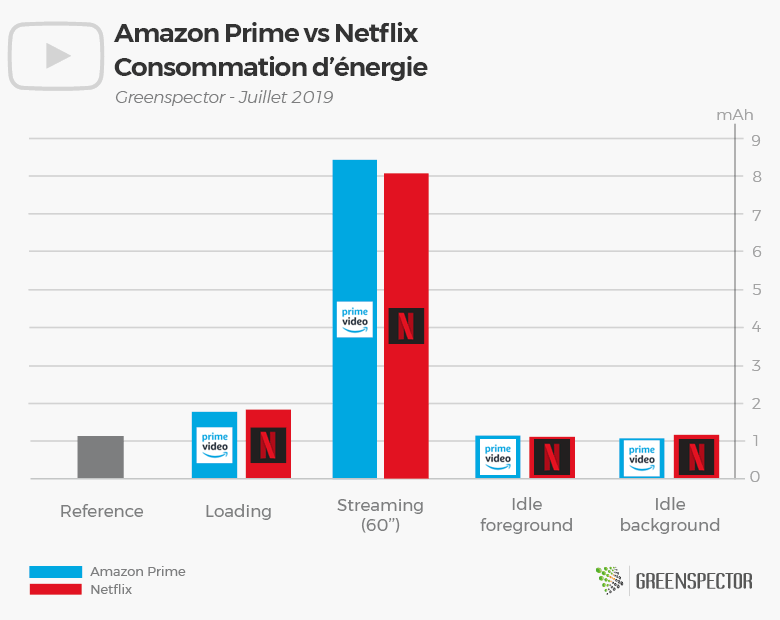
The battle of the week: Amazon Prime Video vs Netflix

Reading Time: 2 minutes

Today’s match will oppose two applications of the video services on demand category. Indeed, the fighters are Amazon Prime Video and Netflix.

In the left corner Amazon Prime Video, created in 2006, is the video service on demand created by the giant Amazon, Netflix’s first competitor on the market.

In the right corner Netflix, created in 1997, is today the most used application to watch a serie or a movie on a smarthpone.

The weighing

At the weighing Amazon Prime Video is the heaviest application with 107 Mb. It’s opponent Netflix is clearly lighter with 77 Mb.

The fight

All the lights are now turned on the fighters and the match can finally begin.

The start of the match is pretty tight but Amazon Prime Video take a small advantage, consuming 0.8% less battery. The fight goes on, with the movie watching scenario during a minute, and this time Netflix reacts and overturn the situation consuming 4.3% less than Amazon Prime Video. For now the suspens is still here since none of the competitors seems to be really better than the other. The fight ends with two decisive rounds of idle observation. During the idle background, Amazon Prime vidéo dominates its opponent consuming 8% less energy. However, during the idle foreground, Netflix consumes 3.5% less.

The bell rings, end of the match ! The fighters having both won 2 rounds, the final decision will be a points decision.

The winner

After counting the points and despite an extremely tight score it is Netflix which is declared winner by the judges, 12.1 mAh to 12.4 mAh.

For those who like numers

ApplicationVersionDownloadsPlaystore GradeApp weight (MB)Exchanged data (MB)Memory (MB)Energy consumption (mAh)
Amazon Prime Video3.0.253.182041100 000 000+4.310773.9414.612.4
Netflix7.16.1500 000 000+4.577192.1286.712.1

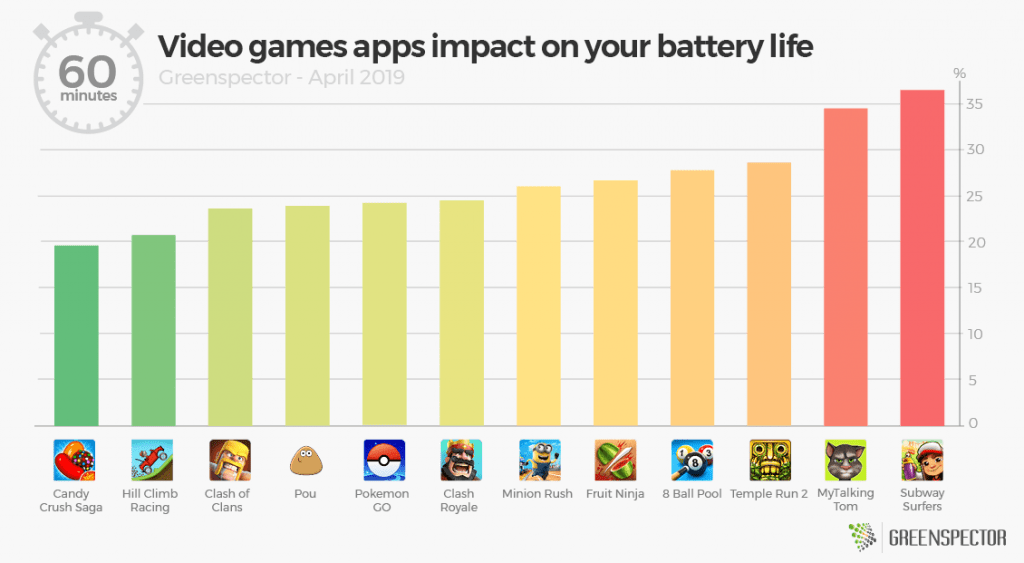
Netflix app is consuming two times more than an app as Discord. Their consumption is almost equal to Microsoft outlook or Yahoo Mail. (Source: Study Consumption of top 30 most popular mobile applications)

The measurements were carried out by our laboratory on the basis of a standardized protocol, respecting a specific user scenario (launch of the app, looking for a movie, watching the movie). The other scenarios are the launch of the application (20”), inactivity in the foreground (20”) and inactivity in the background (20”).

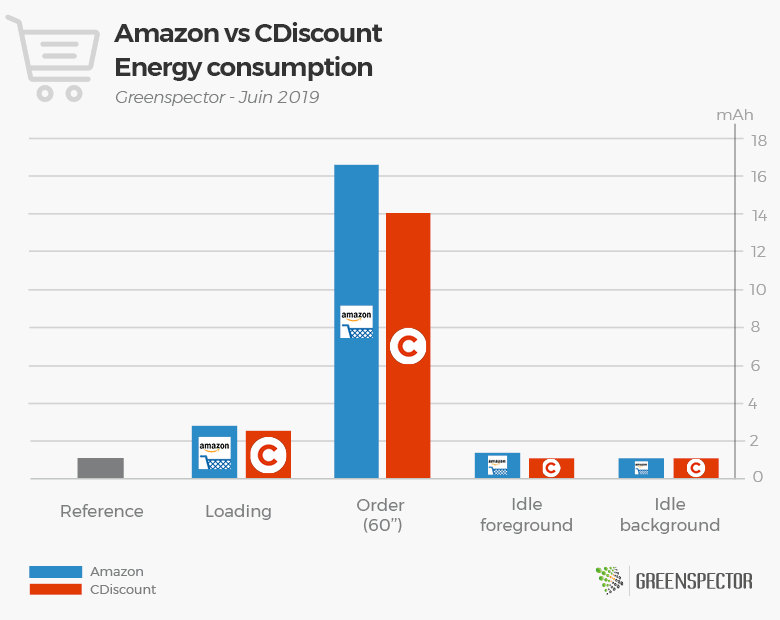
Find the battle of last week : Amazon vs Cdiscount)
Battles ideas? Contact us!

The battle of the week: Bankin vs Linxo

Reading Time: 3 minutes

We are interested this week in budget management applications: Bankin et Linxo. Created by startups and the real new success of fintechs, budget management applications are recent in the banking market. Based on a system of accounts aggregation, they simplify the banking plurality of consumers by displaying on the same screen the accounts held in different institutions. They also allow users to manage their finances and budget by categorizing expenses. They also alert if necessary using forecasting statistics.

In the left corner Bankin, created in 2011 and with more than 3.2 million users, Bankin is proud to be the only independent bank player in Europe.

In the right corner Linxo, Bankin’s main competitor, it was created in 2010 and has more than 2.8 million users.

The weighing

At weighing Linxo is the heavier application with a weight of 70 MB. Its opponent Bankin is much lighter with a weight of 65 MB, or 7% less.

The fight

All the lights are now turned on the fighters and the match can finally begin.

In the first part of the match which consists in measuring the impact of the launch phase of the application, Linxo takes the advantage, consuming 13% less than Bankin. The difference in consumption is very important on the accounts’ consultation phase. Indeed, it is Bankin (6.4 mAh) which takes the advantage and put Linxo (11 mAh) K.O with a lower consumption of 41%. To end this confrontation, we have set up two decisive rounds of idle observation for each opponent. During the inactivity phase in the background, it is a perfect match, both opponents consume 1.1 mAh. It’s Linxo who wins the last round by consuming 49% less than Bankin on the inactivity phase in the foreground.

The bell rings, end of the match!

And the winner is…

After a hard fight, the Bankin application is declared victorious against its opponent Linxo on an overall score of 10.8 mAh at 14.7 mAh by consuming 26% less energy.

For those who like numbers

ApplicationVersionDownloadsPlaystore GradeApp weight (MB)Exchanged data (KB)Memory (MB)Energy consumption (mAh)
Bankin3.12.41 000 000+4.565136160.510.8
Linxo6.6.1500 000+4.470296.3121.114.7

On a scenario of consultation during 1 minute, Bankin consume 8% more than an application like Discord. Linxo‘s energy consumption is equal to Snapchatone’s. (Source: Study Consumption of top 30 most popular mobile applications)

The measurements were carried out by our laboratory on the basis of a standardized protocol, respecting a specific user scenario (launch of the app, consultation of the lastest banking operations). The other scenarios are the launch of the application (20”), inactivity in the foreground (20”) and inactivity in the background (20”).

Find the battle of last week : ADA vs Europcar
Battles ideas? Contact us!

2019 Mobile video games ranking : 12 apps measured

Reading Time: 3 minutes

The 2018 year was a record year for the mobile application market, with more than 113 billion downloads worldwide, up 10% from 2017. These are video sharing and “casual games” applications which have been the most downloaded (Source: AppAnnie). If the carbon footprint of storage servers increases and has a strong impact on the environment, mobile applications are also becoming more and more energy intensive because they are demanding technical resources (RAM, CPU, Data, etc.). GREENSPECTOR has measured the energy consumption of mobile casual games apps. At the top of this ranking, Candy Crush Saga is the most energy efficient one.

Digital power consumption is up 9% a year, according to the Digital Environmental Impact Report released Oct. 4 by The Shift Project , think tank of the carbon transition. The share of digital in global greenhouse gas emissions has increased from 2, 5% in 2013 to 3.7% in 2018, representing an increase of 450 million tonnes in the OECD. These are the data centers that host softs and data, but also the use of terminals and networks. “The energy impact of watching video is about 1,500 times greater than the simple power consumption of the smartphone itself, the report.

In the study conducted in partnership with Atos, on the top 30 most energy-consuming applications, we have also identified that video game applications are among the most demanding applications, after those of social networks and browsers. This consumption has a significant impact on the battery life and therefore on the user experience: the drop in the battery level affects the remaining playing time before recharging.

Results

  • Subway Surfers, last in the ranking, consumes almost twice as much as Candy Crush Saga;
  • if Candy Crush Saga was running continuously on a smartphone for 60 minutes, the app would consume 19% battery, against nearly 40% for Subway Surfers.

The high energy and resource consumption of some applications can be explained by:

  • 3D games such as : Temple Run 2, My Talking Tom or Subway Surfers tend to be more consumer than 2D games like Candy Crush Saga, Hill Climb Racing or Pou;
  • some applications include unwanted ads that disrupt the user experience and increase energy consumption, aurtres offer to visualize advertising videos to win rewards in the game.

If we compare the energy consumption of these mobile video game applications to a heavier platform game (like Rayman Adventures for example, developed by Ubisoft), this one would be in the average consumption: it would only consume 24% battery and the average is 26%. Only the storage capacity of the device (weight of the installed application) would be more impacted.

For those who like numbers

ApplicationVersionDownloadsPlaystore GradeApp weight (MB)Exchanged data (KB)Memory (MB)In game Energy consumption (mAh)
8 Ball Pool4.3.1100 000 000+4.51650.77189.416.3
Candy Crush Saga1.147.0.2500 000 000+4.51320.22254.812.2
Clash of Clans11.446.11500 000 000+4.61350.8488.814.3
Clash Royale2.6.1100 000 000+4.51280.126261.914.9
Fruit Ninja2.7.2.504834100 000 000+4.31406.03294.414.8
Hill Climb Racing1.41.0500 000 000+4.41078.59211.111.7
Minion Rush6.4.1100 000 000+4.52101.51182.118.2
MyTalkingTom5.2.3.326500 000 000+4.51882.0345020.7
Pokemon Go0.137.2100 000 000+4.12180.27145015.4
Pou1.4.77500 000 000+4.3430.83139.813.9
Temple Run 21.55.3500 000 000+4.112016.65280.516.3
Subway Surfers1.100.01 000 000 000+4.516535.75320.923
Rayman Adventures3.9.010 000 000+4.65241.34326.615.5

The measurements were carried out by our laboratory on the basis of a standardized protocol, respecting a specific user scenario (launch of the app, launch of the game). The other scenarios are the launch of the application (20”), inactivity in the foreground (20”) and inactivity in the background (20”). This methodology makes it possible to estimate the embedded application complexity and its energy impact during the use phase.

Note: Find our other comparative applications articles:

SNCF vs Trainline

Reading Time: 2 minutes

Today we attend a match in a new category: Train ticket booking applications. The duel is opposing the OuiSNCF app to the Trainline app.

In the left corner OuiSNCF (formerly known as voyages-sncf.com), created in 2000, is the SNCF distributor and an online travel agency.

In the right corner Trainline (Formerly known as Captain Train) which was created in 2009. It is a travel agency and a trade intermediary dedicated to the online sale of train and bus tickets in Europe.

The weighing

At the weighing OuiSNCF is the heaviest app with 54.2 Mb. With 41.9 Mb TrainLine is 1.3 times lighter than his opponent and appears as the lightweight of the fight.

The fight

All the lights are now turned on the fighters and the match can finally begin.

In the first seconds of the fight TrainLine put some pressure on his opponent with a loading phase consuming 20% less battery. The fight goes on with the train ticket purchase scenario, and one more time TrainLine is consuming 10% less than OuiSNCF which completely derails and is now in the ropes. The match ends with two rounds of idle observation for each opponent in which OuiSNCF will fight equaly with TrainLine.

The gong sounds, the match is over! With an unanimous decision from the judges TrainLine is declared the winner of this fight.

The winner

For this second battle, the two opponents fought well but TrainLine wins 10.35 mAh to 11.48 mAh against OuiSNCF, consuming overall almost 10% less energy.

For those who love numbers

ApplicationVersionDownloadsPlaystore GradeApp weight (MB)Exchanged data (MB)Memory (MB)Energy consumption (mAh)
OuiSNCF61.045 000 000+4.254.21278.0211.48
TrainLine481 000 000+4.441.90.11150.3310.35

OuiSncf app is consuming two times more than an app such as Discord. Their consumption is equal to Snapchat or Orange Mail. (Source: Study Consumption of top 30 most popular mobile applications)

The measurements were carried out by our laboratory on the basis of a standardized protocol, respecting a specific user scenario (launch of the app, selection of a destination, scroll on the results page, choice of a ticket, scroll on the ticket options page, add to the cart). The other scenarios are the launch of the application (20”), inactivity in the foreground (20”) and inactivity in the background (20”).

Find the battle of last week : UberEats vs Deliveroo
Battles ideas? Contact us!

The fight of the week: Amazon vs Cdiscount

Reading Time: 2 minutes

The battle of the week opposes this time two m-commerce applications. Indeed, it is a duel between the french app Cdiscount and the american app Amazon.

In the left corner Amazon, created in 1994, is an american company, e-commerce world leader.

In the right corner Cdiscount, created in 1998, is a french company, main Amazon challenger in France.

The weighing

At the weighing Amazon is the heaviest app with 156 Mb. With 117 Mb Cdiscount is 1.3 times lighter.

The fight

All the lights are now turned on the fighters and the match can finally begin.

Early in the match Cdiscount shows that it did not come to fill the blanks, with a loading phase consuming 9% less energy. The fight goes on, with a buying item scenario, and one more time Cdiscount is consuming 16% less than it’s opponent. It’s a big blow for the american which is hurt but doesn’t admit to be defeated yet. The match ends with two rounds of idle observation for each opponent in which Cdiscount give the final blow to Amazon consuming each time less energy… KO!

The bell rings, the match is over ! With no surprise, Cdiscount is declared winner of this fight.

The winner

For this third battle, we attended to a fight dominated from the begining to the end by Cdiscount who wins 19.8 mAh to 23 mAh against Amazon, by consuming almost 14% less energy overall.

For those who like Numbers

ApplicationVersionDownloadsPlaystore GradeApp weight (MB)Exchanged data (MB)Memory (MB)Energy consumption (mAh)
Amazon61.04100 000 000+4.315615.57334.4923.06
Cdiscount485 000 000+4.11172.12522.3019.84

Amazon app is consuming 3 times more than an app as Spotify. Their consumption is almost equal to Opera Mini or Tik Tok. (Source: Study Consumption of top 30 most popular mobile applications)

The measurements were carried out by our laboratory on the basis of a standardized protocol, respecting a specific user scenario (launch of the app, looking for of an item, scroll on the results page, selection of an item, add to the cart). The other scenarios are the launch of the application (20”), inactivity in the foreground (20”) and inactivity in the background (20”).

Find the battle of last week : OuiSncf vs Trainline
Battles ideas? Contact us!

Fight of the week: UberEats vs Deliveroo

Reading Time: 3 minutes

Today we will study food delivery applications. These applications have multiplied in the last three years. In France, two leaders share the majority of the market:UberEats and Deliveroo. We decided to compare these two challengers to confront them on the following criteria: their energy consumption, their amount of exchanged data as well as their busy memory.

Deliveroo is a British company, created in 2013 and the main competitor of UberEats in France, covering more than 45 French cities.

UberEats was designed by the creators of Uber in August 2014 and is available in several countries of the world, and in more than 70 cities in France and this 24/24.

These two applications allow you to order and receive meals delivered from restaurants near you.

Weighing

From the point of view of the app weight, Deliveroo is the featherweight. Indeed, its weight (22 MB) is 1.4 times lower than that of UberEats (31 MB).

Match

From the beginning of the match, UberEats takes a clear advantage over his opponent with a launch that consumes 13% less battery. He manages to maintain his advantage during the decisive phase of this match, which consists of ordering a meal (-2.5%). The confrontation ends with two rounds of observation of the rest phases of each opponent, during which the two competitors are tied.

Over the whole match, UberEats wins on the points against Deliveroo that resists well.

Note that we are dealing here with two “heavyweights” who will both mark your battery their footprint!

And the winner is…

For this very first fight, the match is tight but UberEats wins 15.7 mAh at 16.2 mAh in front of Deliveroo, consuming nearly 3.5% less energy.
Note however that the Deliveroo app is lighter to download and consumes less data – so if you have a small data package or unstable connection, it can be interesting.

These two applications can be compared on a one-minute scenario to the energy consumption of a Netflix, they are also 1.6 times more consuming than an application such as Spotify. (Source: Study Consumption of top 30 most popular mobile applications)

For those who like numbers

ApplicationVersionDownloadsPlaystore GradeApp weight (MB)Exchanged data (MB)Memory (MB)Energy consumption (mAh)
Deliveroo3.4.15 000 000+4.2223.35218.8512.02
UberEats1.201.1000250 000 000+4.2313.66227.7411.72

The measurements were carried out by our laboratory on the basis of a standardized protocol, respecting a specific user scenario (launch of the application, selection of a delivery address, scroll on the pages of choice of restaurants and selection of a restaurant, scroll on the page of the dishes and add in the basket). The other scenarios are the launch of the application (20”), inactivity in the foreground (20”) and inactivity in the background (20”).

GREENSPECTOR integrates Crosscall brand into its Power Test Cloud

Reading Time: 2 minutes

Two new CrossCall smartphones are available on the GREENSPECTOR Power Test Cloud.

Continue reading “GREENSPECTOR integrates Crosscall brand into its Power Test Cloud”

Is the Messenger Lite app really lighter?

Reading Time: 3 minutes

Note: Find our other comparative articles of lightened apps: Facebook vs Facebook Lite or Instagram vs Instagram Lite.

Messenger’s parent company Facebook launched its lightweight Messenger Lite version in 2016, originally intended for developing countries that don’t have stable, powerful connectivity or state-of-the-art smartphones. Nevertheless, success is also evident in developed countries where the connection in some regions is low. Facebook has made the choice to deploy Facebook Lite and Messenger Lite in other countries including countries of Europe.

If the first version offered only few possibilities in terms of functionality, it was enriched during the year while maintaining its promise of a lighter version: less data exchanged on the network, less memory occupied, fewer resources engaged on the smartphone. This is what we will check in this article comparing the traditional version of Messenger to its light Messenger Lite version.

Messenger is an instant messaging app launched in 2011 incorporated into the Facebook social network. It’s the most popular messaging application in the world with nearly 1,500 million monthly active users. It allows you to send messages, photos, videos, gifs, but also to make audio and video calls.

Results

ApplicationVersionDownloadsPlaystore gradeApp weight (MB)Process data (KB)Memory (MB)Autonomy impact (mAh)
Messenger201.0.0.12.991 000 000 000+4.14525.46276.738.08
Messenger Lite51.0.1.12.216100 000 000+4.424.3841.9482.667.76

From the point of view of the weight of the application, the promise of Messenger Lite is respected. Indeed, the weight of Messenger Lite (24.38 MB) is 1.8 times lower than that of the traditional version of Messenger (45 MB).

Data consumption comparison

The amount of data exchanged on the network is less important on the traditional version of Messenger than that Lite one, a difference of almost 1.6 times lower for launch and inactivity phases. For the conversion phase, Messenger Lite has a volume of 25.62 KB against 21.79 KB for the traditional version (+ 15%).

We note that the data management isn’t good for Messenger Lite and the promise isn’t held at that level. In addition, the two applications could improve their cache management.

Memory consumption comparison

Concerning the volume of memory, here Messenger Lite stands out with its busy memory of 82.66 MB against 276.73 MB for the traditional application. The promise of lower occupied memory is therefore respected.

Energy consumption comparison

Messenger Lite’s power consumption is lower than Messenger. Regarding the launch phase, Messenger Lite (2.79 mAh) displays a consumption 13% lower than the traditional version (3.22 mAh).

The difference is more obvious during the chat phase (which here lasts 60 seconds), where Messenger Lite (10.91 mAh) consumes 10% less than Messenger (12.11 mAh).

It’s the same for the phase of inactivity in the foreground (2.73 mAh against 2.84 mAh) and the phase of inactivity in the background (1.76 mAh against 1.87 mAh).

Conclusion

The promise of the lightened version is only partially respected, indeed an effort is to be made concerning the volume of data exchanged. By using Messenger Lite you will use less battery but will consume more data on the network. The choice is difficult: prefer to consume less battery or less data? With the Lite version you will consume less storage space, less memory, if your priority is to consume less battery, download the lite version. However, if you are one of the users who have an expensive data plan or a bad network connection, prefer the traditional version which will save you in terms of data exchanged. This choice between energy and data surely comes from the fact that the designers of applications don’t take energy as an important criterion. Too bad because it would be possible for the user to consume both less data AND less energy.

Qwant vs Google: Which search engine is better for battery life?

Reading Time: 3 minutes

Discover our lastest 2020 benchmark on search engines: the environmental impact of search engines applications

Today we look into mobile search engines. These everyday gateways to the internet are now mostly used on our mobile devices. We chose to compare two of the most popular but very different search engines.

One is a French search engine launched in 2013 whose values are the protection of the neutrality of the results as well as your private life: Qwant. The other is the most used search engine in the world, holding nearly 90% market share, having the ability to process a very large amount of data, you guessed it, we are talking about Google.

Browser searching consumption

We performed our measurements on a Samsung Galaxy S7 running Android 8 Oreo, using a Chrome browser, the most used browser in the world. Nevertheless, we advise you to opt for a browser more respectful of your device’s battery life like Brave or Firefox Focus.

The Qwant home page consumes slightly more energy than Google‘s (+ 6%). This is easily explained by the fact that an image is displayed by Qwant, as well as a quote at the bottom of the search bar, unlike Google which displays only the search bar.

However when you run a search, Qwant is the less consuming: its search results page consumes 3.30 mAh against 3.90 mAh for Google. This is a non-negligible difference of 15%.

What about the dark theme?

We have already wondered about the effectiveness of dark themes in a previous article focusing on Twitter app’s dark mode. Let’s check the impact of Qwant’s new dark theme.

Note: Google also has a dark theme available, but it’s pretty difficult to find, and much less obvious to configure by the user. Whereas Qwant offers an immediately accessible icon, in the case of the Google page, you have to perform a manipulation way too complicated, if you don’t know about it. This is why we chose not to test this configuration that seems reserved to advanced users.

Please note that we measured on a Samsung Galaxy S7 with AMOLED screen like most recent devices. This type of screen consumes a lot less battery when it displays dark colors.

Qwant’s dark theme reduces its home page consumption by almost 27% compared to its white-background “day” theme, and 24% for search results.

Conclusion

Qwant is an interesting alternative to Google in many ways. Our measurements show that it is also interesting if you seek to spare your battery power. If your smartphone is fitted with an AMOLED display, you’ll save your battery even more by activating Qwant‘s brand new dark theme. This will make a real difference on the battery life of your smartphone, especially if you’re the kind of user who searches the web a lot.

Is the Instagram Lite app really lighter?

Reading Time: 4 minutes

Last June, without any announcement, Instagram launched a lite version of its application on the stores : Instagram Lite. A lighter version that fits in the logic initiated by its parent company Facebook with its Facebook Lite app (that we had evaluated at the time) and Messenger Lite app.

Continue reading “Is the Instagram Lite app really lighter?”