Category: Digital sobriety

Reading grid for environmental commitments of web hosting offers

Reading Time: 7 minutes

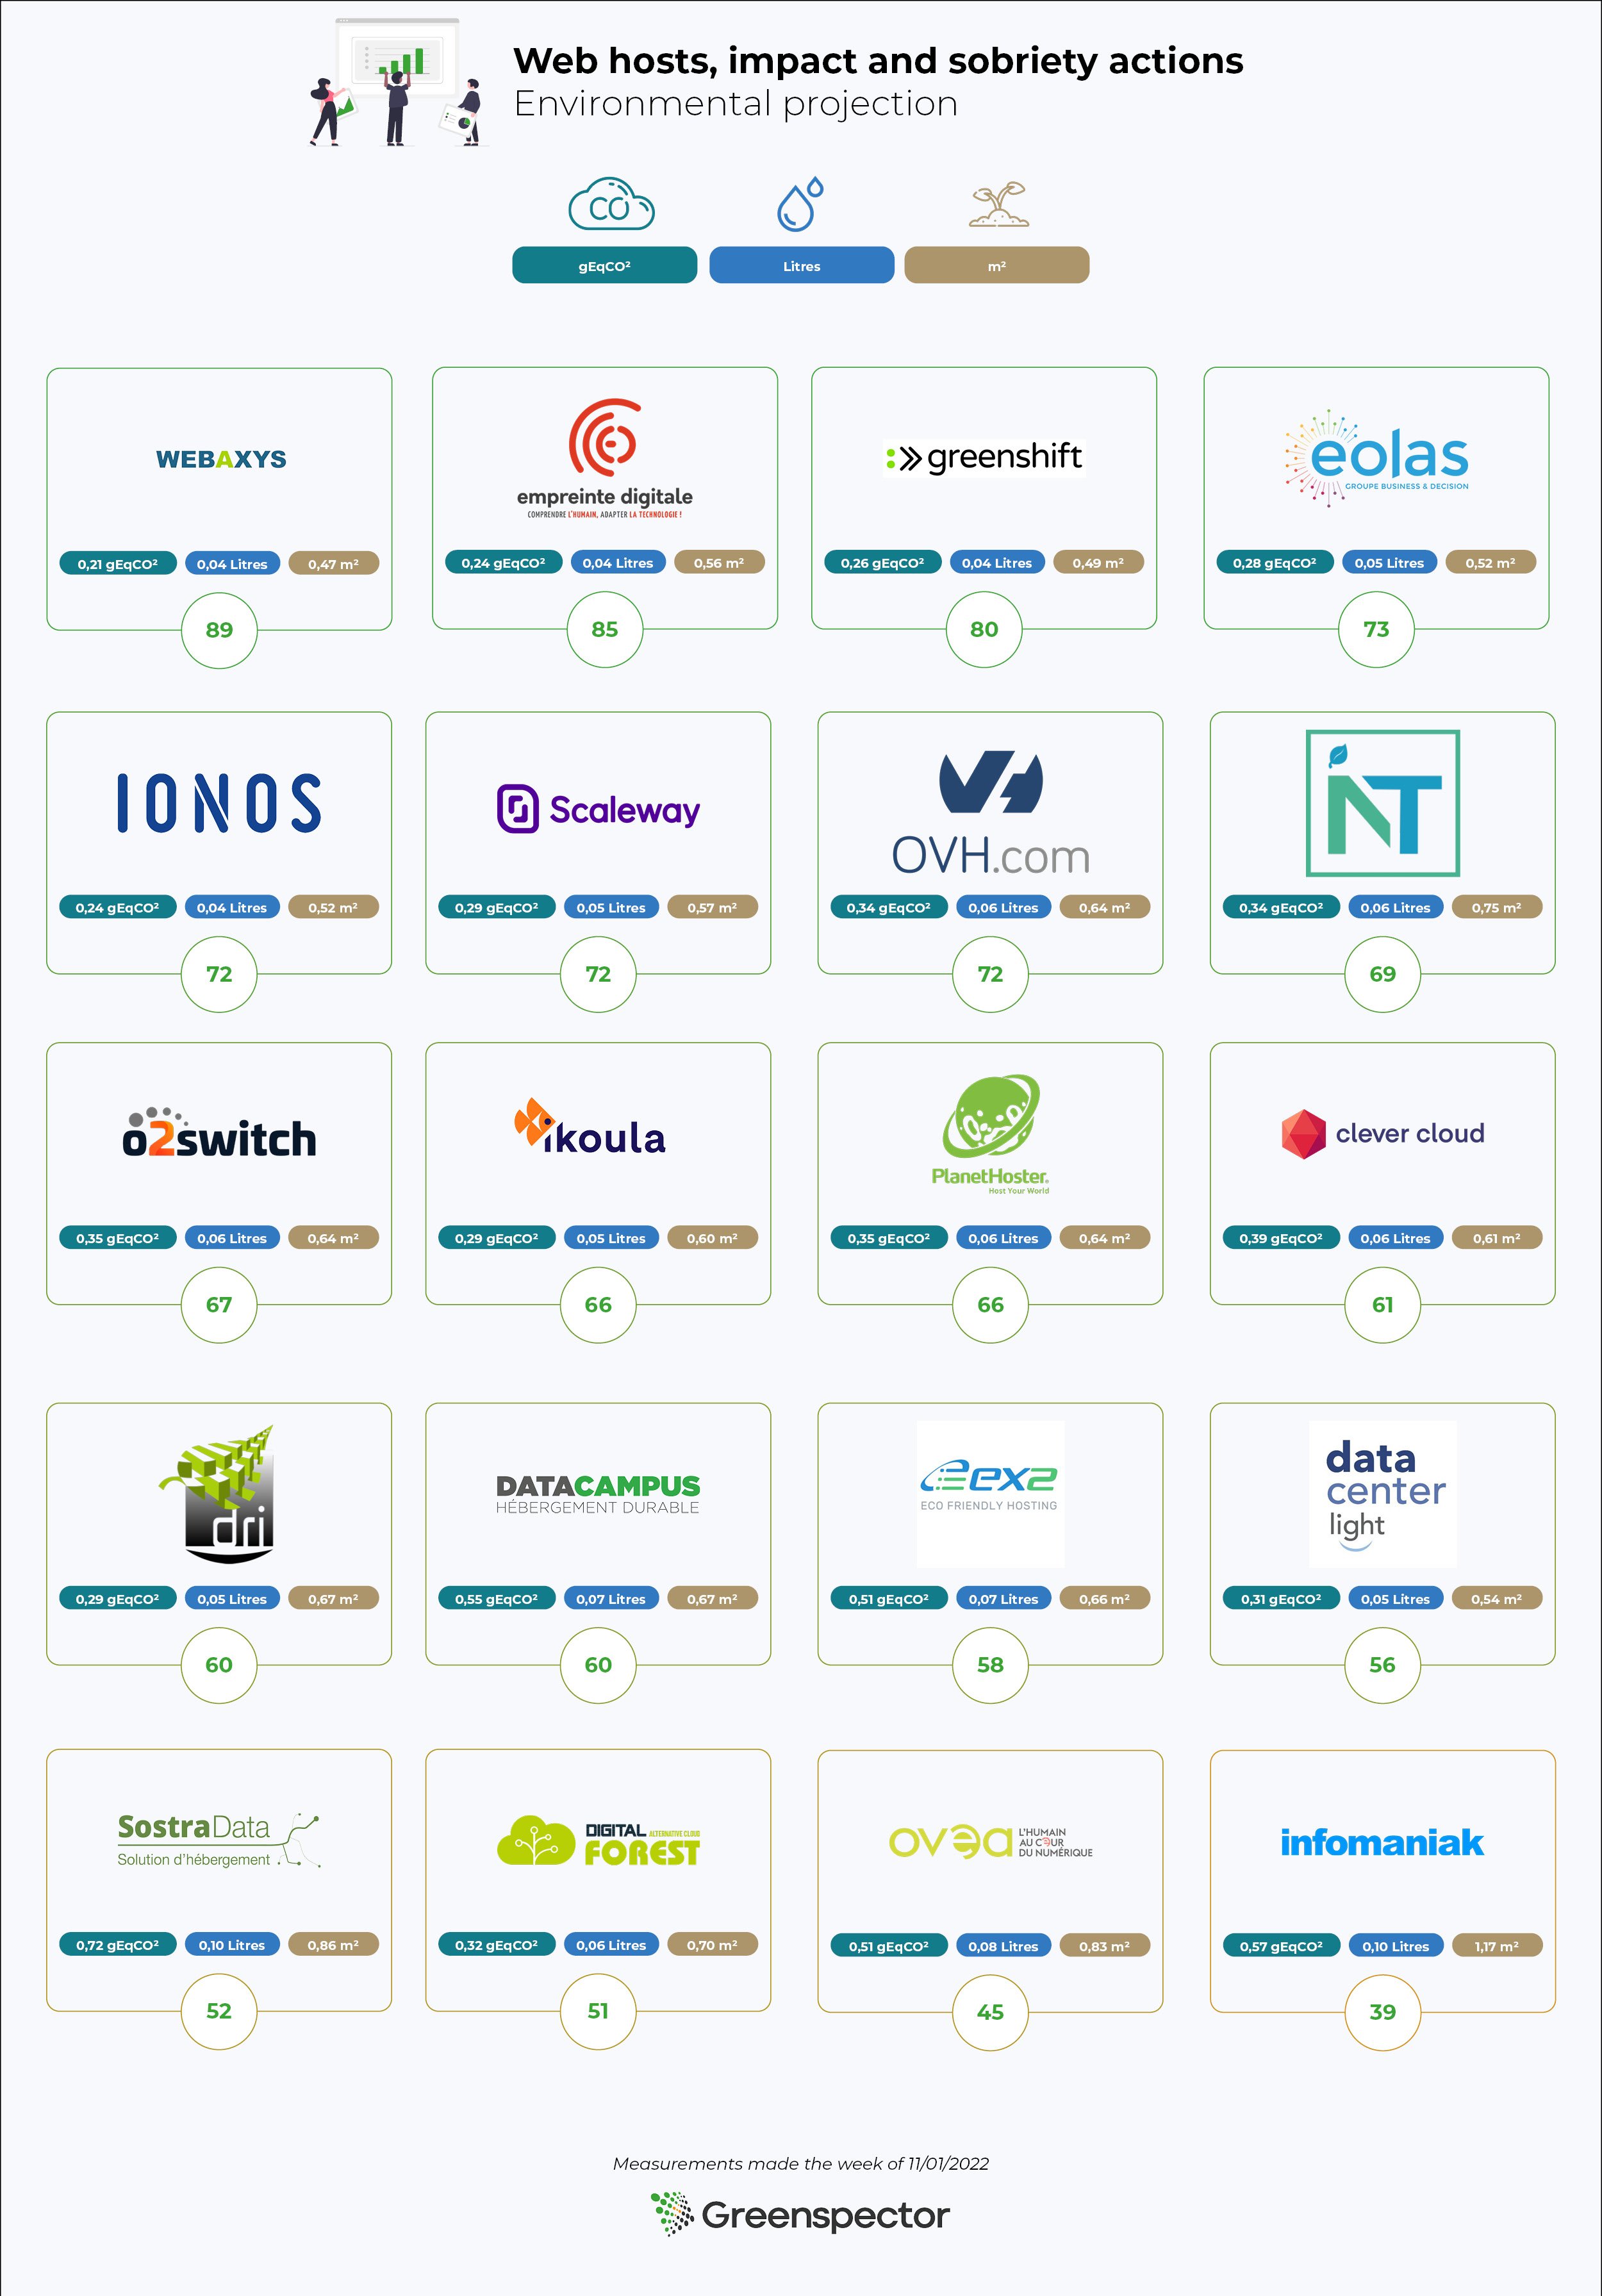
After a first article where we based ourselves on the websites of the hosting companies to compare the hosting companies proposing “eco-responsible” offers, let’s take a closer look at the offers in question. 

The choice of a web hosting service is often complex because of the many factors to be taken into account (security, availability, storage capacity, sovereignty, etc.). If you also want to choose an offer based on its environmental impact, the choice becomes even more complex.

The main objective of this article is to present some criteria to be taken into account when choosing a web hosting offer.

We first look at the existing good practice guidelines.

Once the list of environmental criteria has been established, we will go into more detail on each of the criteria in order to better understand them but also to have the right information to understand the available criteria or even discuss them directly with the hosts.

Indirectly, this reading grid can also be useful for accommodation providers who are concerned about their environmental impact.

Our objective here is to propose a simple reading grid, allowing anyone to understand what to base their choice of an “eco-responsible” host on. However, all this information will not necessarily be on the websites of the hosting companies. The easiest way is to contact these companies directly to get the missing data.

We obviously welcome feedback and constructive comments in order to improve this reading grid and to know how it is used.

Existing benchmarks

In order to better understand how the environmental impacts of accommodation offers are translated, we started by looking at what the existing standards suggest on this subject.

In order to choose an eco-responsible host, the 115 good web design practices propose the following items (see below for details of each):

The RGESN (Référentiel général d’écoconception de services numériques) proposes a dozen good practices relating to hosting. Among other things, it deals with :

Note: most of these criteria can be found in those selected for this comparison, with the exception of those relating to the location of servers (mentioned in the social commitments) or to data management (which depend on usage, in particular according to the criticality of the service and the data).

As usual, the GR491 (Reference Guide to Responsible Digital Service Design) offers many recommendations on the subject. If we stick to the essentials, we find :

  • Waste management
  • PUE
  • Sizing of the physical fleet
  • End of life of equipment
  • Indicators on the software used

In addition, DINUM (Direction Interministérielle du Numérique) offers a practical guide to responsible digital purchasing, with in particular a sheet on IT infrastructure equipment and hosting services (and hosted solutions). The AGIT (Alliance GreenIT), for its part, updated a white paper in March 2023 on the control and optimisation of the environmental impact of a data centre.

By cross-referencing all these elements, we have drawn up a list of criteria to be checked, which is intended to be complete but not exhaustive.

Note 1: Currently, a working group within W3C is building a set of guidelines for website sustainability. One of the areas of work concerns hosting and infrastructure.

Note 2: In January 2023, the ADEME (Agence de l’Environnement et de la Maîtrise de l’Énergie) published a methodological reference framework for the environmental assessment of hosting and cloud services. This document defines the information to be gathered and displayed. At the time of publication of this article, the companies concerned have not adopted it, but it is hoped that this will be the case in the near future.

Reading grid for the environmental commitments of accommodation providers

Let us now look at what constitutes the reading grid in question.

The criteria used

On the basis of the benchmarks seen above and in order to better evaluate the accommodation offers, the choice was made to base ourselves on several criteria (which we will detail below):

  • WEEE Management
  • PUE
  • WUE
  • CUE
  • Purchasing policy
  • Social commitments
  • Management of the heat produced
  • Renewable energy supply
  • Carbon offsetting
  • ISO standards, labels, certificates

Description of the criteria

Management of WEEE (Waste Electrical and Electronic Equipment)

How electronic and electrical waste is dealt with. To date, most of this waste is trafficked (What is the status of recycling?).

WEEE management is about extending the life of electronic equipment through recycling or upcycling and reuse. For example, servers used for hosting can sometimes be reused in other contexts.

PUE  

The PUE (Power Usage Effectiveness) represents the proportion of energy used to power IT equipment (servers, storage and network) in relation to the total electricity consumed (for cooling, UPS, etc.). It is always greater than 1 and should be as close to 1 as possible. It is estimated that the oldest data centres have a PUE of around 2, whereas the most efficient ones are more like 1.1.

Many structures advertise very low PUE. Here again, it would be important to see how this is calculated. See the Scaleway website: https://www.scaleway.com/fr/leadership-environnemental/

WUE  

Following a similar reasoning as for the PUE, the WUE (Water Usage Effectiveness) evaluates the efficient use of water, especially for cooling equipment, by comparing it to the amount of electricity used for the equipment. Indeed, the amount of water used by hosts is very high, which increases the risk of water stress.

The aim is to get as close as possible to zero water consumption per kWh.

Few organisations today report CUE or WUE. However, this type of information is an essential complement to the PUE in order to ensure, for example, that a low PUE is not explained by higher water use.

CUE 

Carbon Usage Effectiveness (CUE) compares the amount of greenhouse gas emissions to the amount of electricity used. In order to improve it, technologies with lower CO2 emissions should be selected (which may be the case when a generator is used to produce the electricity rather than using the electricity grid directly). The objective may be to have a UEC of less than 0.1 kg of CO2.

Purchasing policy

The manufacture of equipment remains the most impactful stage in its life cycle, notably because of the many resources (including metals and rare earths) required. The purchasing policy is therefore an essential element in limiting the environmental impact of a hosting company, even if the manufacture of data centre equipment has less impact than its electricity consumption. Thus, some opt for reconditioned equipment or manufacture their own equipment and all must keep in mind the efficiency and durability of the equipment purchased.

Social commitments

It is impossible to make it an objective and directly measurable criterion. However, this category includes what some companies do to reduce the impact of their activity or to contribute to society, which is an essential component of responsible digital. Global elements such as a CSR plan or the Lucie label can testify to this. It may also be interesting to consider the location of buildings as well as local actions, choice of service providers, etc. 

Gestion de la chaleur produite  

Due to its activity and the demand on its equipment, a hosting company can produce a lot of heat. In order to keep the equipment in working order, it is necessary to cool it down, most often by using electricity via air conditioning for example (hence the notion of PUE seen above) or water. When released directly, this heat can have a negative impact on the environment (sometimes referred to as waste heat or energy). Some accommodation providers therefore use it to heat neighbouring buildings. This can be measured by the Energy Reuse Factor (ERF).

Renewable energy supply

Data centres are often criticised for their electricity consumption. While the priority is to ensure that as little electricity as possible is used, it is important to rely on renewable energy as much as possible to limit the environmental impact. This can be measured by the Renewable Energy Factor (REF).

Most hosting companies are focusing on renewable energy. We have based our analysis on the companies’ statements on the proportion of renewable energy used. By way of comparison, the Green Software Foundation’s approach to this (for their Green Hosting Directory which is mentioned by several of the organisations compared here) is rather simple. They distinguish between but take into account organisations that :

  • Use only renewable energy
  • Invest in renewable energy to offset their own use of non-renewable energy
  • Use carbon offsetting

This choice may be debatable (particularly with regard to the inclusion of carbon offsetting). It is up to each individual to see what he or she deems necessary (in terms of procedures and evidence).

It is also important to distinguish between decarbonised energy (e.g. nuclear) and renewable energy.

Finally, claims of “100% renewable energy” can be misleading. It is therefore up to each individual to find out more directly from the companies.

Carbon offsetting

Carbon offsetting is the final step in the process of reducing environmental impacts. It should only be used when emissions have first been reduced as much as possible through sobriety and efficiency. Moreover, the effectiveness of some carbon offsetting solutions is regularly questioned. As there are several ways of offsetting, it is advisable to approach companies to find out more about the precise nature of their approach. In accordance with the recommendations of ADEME and EcoInfo, the notion of carbon neutrality should be approached with caution and avoided as much as possible.

ISO standards, labels, certificates

We look at a number of elements as a matter of priority. These include ISO50001 (energy management), ISO27001 (information security) and ISO14001 (environmental management). In addition to this, we sometimes find the HDS (Health Data Hosting, which includes ISO27001 and ISO50001 among other standards). Finally, the Code of Conduct on Data Centre Energy Efficiency includes many good practices. Greenethiquette is sometimes mentioned, but has disappeared in favour of more detailed standards (such as the European Code of Conduct).

Conclusion 

The notion of an eco-responsible host has been around for several years (notably via the Greenethiquette), but the precise criteria are still under consideration (not to mention what one is entitled to expect from it). Even if some companies are very transparent on their websites (notably via dedicated pages), this cannot replace a more in-depth discussion, both to find out about missing criteria and to better understand the actions already taken. It is therefore to be hoped that hosting companies will move towards concrete criteria to demonstrate their environmental impacts and communicate them in a transparent manner.

For the time being, it is to be hoped that this reading grid will be useful for those who wish to move towards more environmentally friendly accommodation offers, but also so that everyone can be in a position to push companies towards more virtuous actions.

Web hosts, impact and sobriety actions

Reading Time: 8 minutes

The article is based on measurements taken in November 2022. It is possible that some companies have since redesigned their websites.


Summary of the article

More and more web hosting providers are claiming to be environmentally friendly.

– We measured the homepage of 21 web hosting providers.
– We analysed the homepage of the first ranked provider, which is Digital Footprint.
– We then analysed the homepage of the last one in the ranking which is Infomaniak.
– We then took a look at Greenshift’s site by exposing an extract of the HTTP requests of the homepage.

Finally, we reviewed the good practices of sobriety and accessibility which reveal that Eolas and Empreinte Digitale have the fewest accessibility errors unlike Infomaniak which has the most.

In the next article, we will look at the criteria needed to assess the environmental friendliness of a hosting company.

When we are interested in digital sobriety, the question of the host comes up very often. Indeed, this is a very interesting and cross-cutting lever for reducing the environmental impact of digital services. Things get more complicated when you try to sort out the real from the fake in order to choose the best possible host according to the project’s business constraints. Some providers go so far as to talk about carbon neutrality or even carbon negativity.

Claims of carbon neutrality are most often based on the source of the electricity used according to a market-based (supplier’s claims) or location-based (geographical energy mix) approach. Given that some of the scopes 1, 2 and 3 are often neglected, all of this makes these claims invalid. The purpose of this article is not necessarily to go into this point in detail, but you will find some initial answers here:

Today, in all cases, the claims of eco-responsibility of hosting providers are mostly based on PUE (Power Usage Effectiveness) and the source of the electricity used. This does not seem to be enough. At Greenspector, we decided to look into the subject, to see what was being offered today and to base ourselves on the existing literature in order to determine what criteria to use to choose a hosting company. We were then able to classify several French (or nearby) hosts.

In this first article, we decided to evaluate the homepage of their sites from the point of view of digital sobriety, in order to check whether they reflect their environmental claims. This approach is of course biased and unrepresentative, but it already gives an idea of where each of them stands from this point of view.

It is only with the second article that we will really be able to decide between the hosts, by sifting through the criteria we have chosen.

Comparison of home pages

Based on their intentions regarding environmental impacts, 21 accommodation providers were selected. We have selected as a priority those that show efforts to reduce the environmental impacts of the services they offer. We may have missed some. If so, please let us know!

Based on this list, we measured the homepage of each with the Greenspector tool in order to compare them.

NomURLEcoscoreEnergie (mAh)Données transférées (Mo)Requêtes HTTP
Webaxyshttps://webaxys.fr/894,1731920,4791321
Empreinte Digitalehttps://cloud.empreintedigitale.fr/855,0098830,31311166718
Greenshifthttps://www.greenshift.co/fr/804,2531081,07974166751
Eolashttps://www.eolas.fr/734,4498221,41620333359
IONOShttps://www.ionos.fr724,5860760,996712727
Scalewayhttps://www.scaleway.com/725,0837582,24784966329
OVHhttps://www.ovhcloud.com/fr/725,5531751,83202033464
Neutral IThttps://neutral-it.com/696,622361,28623949
o2switchhttps://www.o2switch.fr/675,38240,97976366790
Ikoulahttps://www.ikoula.com/665,3153841,5460696733
PlanetHosterhttps://www.planethoster.com/665,4691591,77847476
DRIhttps://www.dri.fr/605,989070,45114833327
Datacampushttps://datacampus.fr/605,69127513,1412466764
EX2https://www.ex2.com/585,4742029,75604991
Data Center Lighthttps://datacenterlight.ch/564,6863412,8627603751
Sostradatahttps://www.sostradata.fr/527,23515317,1943103389
Digital Foresthttps://digitalforest.fr/516,2256420,89760235
OVEAhttps://www.ovea.com/457,012554,253318032111
Infomaniakhttps://www.infomaniak.com/3910,300433,09277299772

Résultats des mesures sur les pages d’accueil


Results of the environmental projection

Now let’s look in more detail

In terms of the Ecoscore (whose calculation methodology can be found on the Greenspector blog), the Webaxys home page does best and Infomaniak does worst. For Infomaniak, this can be explained by the fact that the energy impact of the site is very high. It is even the highest in the sample. On the other hand, from this point of view, it is once again Webaxys that comes out on top. Empreinte Digitale presents the lowest volume of transferred data while Sostradata transfers the most (more than 17 MB!). Concerning HTTP requests, the home page of Empreinte Digitale uses the least while the one of OVEA has the most (at first sight, some optimizations would be quite easy to implement by avoiding duplicates and by delaying the loading of the chat or even by questioning its relevance).

The home pages of the Webaxys and Empreinte Digitale sites clearly stand out and we will now analyze them in more detail. We will then complete our analysis with a quick look at the elements of the Infomaniak site that make it more impactful. We’ll finish with a brief overview of the other sites.

Empreinte Digitale

This homepage is particularly light, which is an opportunity to note the application of several good practices:

  • Optimised and lazy-loaded images
  • Third-party services mastered and, in principle, all self-hosted
  • Very little JS and CSS
  • Use of system fonts only

The site is pleasant and attractive. The score could be even better without the animation but this is absent on mobile. The choice of dithering for some images highlights the desire to produce a site as light as possible but is not necessarily necessary.

Webaxys

We find here light and lazy-loaded images, with a simple and attractive service.

On this type of very optimized and light site, some flaws stand out even more, especially the use of Google fonts.

Here we see 7 requests only for these fonts whereas a system font would probably have been suitable. It should also be remembered that their use from Google servers may pose a problem with respect to the RGPD. A variable font could limit the number of files and a subset (limit to useful characters) could reduce the size. But the priority would be to use a system font.

Finally, the last request of the list is probably FontAwesome. So here we get an icon font while only a few icons are useful (and could be integrated in optimized SVG, maybe even directly in the HTML).

Infomaniak

The Infomaniak site stands out for its low Ecoscore and high energy impact.

If you take a closer look, you’ll notice that most of the weight of the page is due to numerous JS files (about forty in all!).

In addition, the animation at the top of the page (for the search of a domain name) seems to be one of the causes of the overconsumption of energy, highlighted in the Greenspector tool:

Sollicitation du CPU pour l’affichage de la page

Other possible explanations for this over-consumption may be found in JS processing. In any case, it should be analysed and limited.

Other websites

Greenshift’s homepage shows a low energy impact, despite the inclusion of animations when the page is loaded. However, in terms of usability, the presence of horizontal scrolling on mobile phones is not ideal.

For the Sostradata site, which has the highest volume of data transferred in the sample, a quick glance reveals the first areas of improvement:

  • Avoid including a Google Maps component directly on the homepage
  • Optimise images (size, format, quality, lazy-loading)
Extrait des requêtes HTTP de la page (via les DevTools de Firefox)

Good practice in digital sobriety

In terms of good practice, it is worth noting that the Neutral IT homepage meets the most criteria.

From this point of view, we found that some good practices are almost never implemented on the pages in our sample. To improve impact, one should systematically consider :

  • Do not let the browser resize images, this limits the consumption of terminal resources
  • Only download the necessary images and do lazy loading
  • As far as possible, do not integrate css and js code into HTML files; this will avoid systematically reloading the whole file if necessary
  • And of course, once the css and js files are independent, they should be minified to save space

Best practices for accessibility

In addition to measurements and verification of good practices (two complementary approaches that are difficult to separate), we were curious to briefly evaluate the selected sites from the perspective of accessibility. While it is important to reduce the environmental impact of digital services, this cannot be done without ensuring that the site adapts to all contexts of use so as not to exclude anyone. What is the point of having the least impactful site possible if it is unusable for a part of the population?

As we do not wish to be exhaustive, we have relied on the aXe tool (it should be remembered that this type of tool is not intended to cover all the WCAG or RGAA criteria) and on the manual verification of certain criteria (200% zoom, content linearisation, textual alternatives, etc.) In accessibility as in digital sobriety, there is no magic wand!

In the end, our findings are as follows:

  • The Eolas and Empreinte Digitale websites have the fewest accessibility errors
  • Despite its reduced environmental impact, the Webaxys site has several errors that are fairly easy to fix.
  • The Infomaniak site is among the sites with the most errors
  • Among the most frequent errors, we find mainly those highlighted by the WebAIM Million study (which is consistent):
étude WebAIM Million

So here we see (once again) that accessibility and digital sobriety are linked. It would be difficult to say that those who do not take care of the sobriety of their websites do not care about accessibility (and vice versa). On the other hand, it is important to remember that it will be all the easier to apply accessibility criteria to a sober site, and even more so when the two approaches are carried out jointly throughout the project’s life cycle.

Conclusion

A first quick analysis of the websites of the selected hosting providers allows us to distinguish those who make the effort to create a sober (and accessible) site. While this does not indicate that they are paying attention to reducing the environmental impact of their hosting offers, it will be interesting to see if the trends noted here are confirmed later.

In the next article in this series, we will look at the criteria needed to assess the environmental responsibility of a web host. We will return to the websites of the selected hosts to see how each one measures up against the criteria in question.

For each of these websites and applications, measured on an S9 smartphone (Android 10), the measurements were performed using our Greenspector Benchmark Runner, which allows automated testing. Only the homepage of the websites was measured.

Scenario details:

  • Loading the application
  • Inactivity of the website in the foreground
  • Scrolling
  • Website inactivity in background

Each measurement is the average of 5 homogeneous measurements (with a small standard deviation). The consumption measured on a given smartphone with a wifi network can be different on a laptop with a wired network for example. For each iteration, the cache is emptied beforehand.

Learn how Greenspector assesses the ecological footprint of a digital service.

Reducing the impact of autocompletion 

Reading Time: 4 minutes

When we browse the web, autocompletion is almost everywhere. In particular, this functionality is implemented on search engines, whether they are website-specific or not. So, when the user types in the words they are looking for, suggestions are made dynamically, whether to complete the words or phrases they type in or to display the search results as characters are added. 

In the case of Google, these suggestions are often derided as incongruous.  Not to mention the SEO chestnut about the death of the search engine.

Take the example of the Google search engine: 

Here, the blue arrows represent character inputs and the black rectangles represent autocomplete queries.  

We arrive at a total of 16 XHR type queries for 5.1 kb transferred.  

The number of queries remains the same whether the input is fast (input in 2 seconds for the whole search) or longer (7 seconds in total for the input). 

Autocompletion can also be found in some input forms, to ensure that the text entered corresponds to what is expected (city, country, etc).   

While this mechanism can be an aid to the user, the environmental impact of the queries generated should not be overlooked. Let’s see how to limit them.

First recommendations 

If sobriety is a priority, the best thing to do is not to integrate an autocomplete mechanism. However, input help is a definite advantage for users in most cases. 

In the case of forms, the GreenIT.fr collective’s collection of 115 good practices in web ecodesign recommends input assistance. In this way, less strain is placed on the server while ensuring that the text entered remains consistent with what is expected. 

On the GR491 side, there are two recommendations:   

Rather than systematically implementing autocompletion and search, it is sometimes possible to make filters (and sorting mechanisms) available to the user.   

With these initial elements in mind, let’s look at how we can go even further.

Recommendations  

Ensure that requests are as light as possible   

When the client sends a request to the server, ensure that it contains only the elements necessary to provide a relevant response.   

When the server sends a response, again ensure that :   

  • Only relevant fields are returned. For example, it is not always necessary to display an image for each result  
  • Only the necessary elements are returned (relevance of responses and pagination of results)

Do not offer autocompletion before a few characters  

Before launching the first query, it is preferable to wait until 5 characters have been entered or at least 2 seconds have elapsed since the last entry by the user.   

This avoids returning results for a request that is too vague (when the number of characters entered is insufficient), while taking into account the case where the term searched for is deliberately short (“summer”, etc).

Spacing out the queries in time  

After the initial query, wait until 3 new characters have been entered or at least 2 seconds have elapsed since the last query. 

Limit the number of queries for fast entries  

In addition to the previous rule, in the case of fast input, wait at least one second between each request. Indeed, some particularly fast users can enter a character every 200 ms. 

Measuring local relevance  

When a user adds characters to his search, the results become more precise and their number decreases. It is possible to perform this filtering directly locally, without additional requests to the server. For example, if results were obtained for “housing assistance”, it is possible to filter on the client side if the user continues by typing “housing assistance”.   

This good practice is particularly relevant in the case of an input field in a form. For example, when entering a city or country, the elements of an initial query can be refined locally as the user continues to type.  

Be aware that if a space is entered and new terms are added, the logic chosen for the search results must be taken into account. In particular, should a result contain all the terms entered or only some of them?  

Be careful also to take into account the case where the user deletes some of the characters entered. You may also want to temporarily store the queries you have already made so that you can use them again if necessary.

Back to the example of the Google search engine  

Taking the case of the Google search engine mentioned at the beginning of the article (16 queries, 5.1 KB transferred), we arrive at 3 queries in total for 1 KB transferred.

  • A first query only performed when at least 5 characters have been entered.   
  • A second query when 3 more characters have been entered.   
  • A third query when 3 more characters have been entered.   
  • The local evaluation of the results to be returned at the end of the input, since it is only a question of filtering the results obtained following the third query.

Conclusion  

If autocompletion is a necessity and assisted input is not possible, the following good practices should be implemented:   

  • Ensure that queries are as light as possible  
  • Do not offer autocompletion before a few characters  
  • Spacing out queries over time  
  • Limit the number of queries for quick entries
  • Measure relevance locally

Finally, although this input help may be beneficial to many users, do not neglect its accessibility

Deleting emails is useless, working on sober email solutions is mandatory  

Reading Time: 2 minutes

The discovery that digital technology was not so virtual and that it could have an impact on the environment brought a multitude of injunctions followed by a multitude of criticisms and counter-injunctions. “You have to delete your e-mails”, “No, it’s like peeing in the shower, it’s useless”… The criticism of these actions by the digital actors is quite strong relative to the large part of the “non-technical” population that took this to heart (and increased its eco-anxiety!). 

These discussions have also led to a decision on which is the most polluting between use and manufacture. Use of the mail versus manufacture of the terminal on which the mail was read. The latter being announced as more impacting, this was in the sense of uselessness to optimize the mail part!  

Yes, the impact is concentrated on the manufacturing of the terminals. Yes, the unit impact of an email is low, especially compared to a raclette (this is a private joke, a joke that circulates among the detractors of digital sobriety). These are quite reassuring messages in a binary world. Reassuring to limit eco-anxiety. But mostly reassuring for the digital actors to not deal with the problem and continue business-as-usual.

Because yes, there is a potential problem. Because of the scale effect, a low unit impact can lead to a high global impact with a large number of users and more and more uses. The 4% impact of digital technology does not just happen. Especially when you list and observe what happens on the internet every minute https://www.allaccess.com/merge/archive/32972/infographic-what-happens-in-an-internet-minute. A diversity and a frequency much more important than raclette (for information, we should eat raclette 12 times a year https://journal-des-etudes.com/selon-la-science-il-faudrait-manger-de-la-raclette-12-fois-par-an/

The plastic packaging of our food, taken individually, does not have a huge impact. A few milligrams of plastic. But plastic is indeed a global environmental problem. As Gerry McGovern would say, plastic is an environmental plague but if you have a plastic bag, use it! https://gerrymcgovern.com/books/world-wide-waste/exploding-plastic-inevitable/ 

“Avoid plastic packaging. Bring your own bag and avoid the barcodes. Whenever you can replace plastic with another material, do, but don’t replace it simply for the sake of it. If you have a plastic bag, use the hell out of it.” 

As a digital player, we need to work on impacts because the effect of scale means that our solutions have a significant global impact. Using the “order of magnitude” argument by taking only the unit impact is not valid.  

Behind an email, there is a solution provider. Behind a social network, too. Each digital actor contributes to a brick that is ultimately used by a user.  

It is therefore necessary to optimize our solutions, to offer better management of solutions. What about smart email deletion options that would be proposed in email solutions? What about providing solutions to help writing sober emails (attachments, signatures…)? It is possible, editors have done it for spam management, why not go further? 

As for user awareness, it is necessary but it must be less anxiety-provoking, without becoming whataboutism (https://fr.wikipedia.org/wiki/Whataboutism).  

Digital Sobriety Requirements for Cities and Communities – Ranking

Reading Time: 7 minutes

In 2020, we published a study on digital sobriety requirements in public procurement. With the publication this summer of the decree n° 2022-1084 of July 29, 2022, we thought it would be a good idea to take stock of the sites of cities and communities.  
This decree concerns municipalities and communities of more than 50,000 inhabitants, requiring them to develop a responsible digital strategy focusing in particular on reducing the environmental footprint of digital.  
We therefore remeasured the sites of the 29 cities and 17 metropolises already discussed in order to compare the results obtained.
The measurements here only concern the first page of each site. Ideally, a larger sample of pages should be taken into account, or even compared on the basis of a user path common to all these sites. However, this approach already allows us to establish points of comparison and to identify some good practices. 

Metropolitan sites

The Ecoscore as defined by Greenspector allows a good overview of each site. We will therefore start by looking at its evolution between the initial measurements and the re-measurements.

metropolises website ecoscore

In most cases, there is an improvement (even slight) in the EcoScore. The cities of Brest, Grenoble, Nice, Orleans and Strasbourg stand out with a very strong increase. For some cities, the trend is downward.  

While Nancy had the best EcoScore (74), Rennes takes the lead with an EcoScore of 80. 
However, it can be estimated that it would be important for each city to obtain an EcoScore of at least 50/100, which is still not the case for some.  

Estimating the environmental impacts of different sites is another good basis for comparison.

metropolises website carbon impact

We note here that the trend is globally upward for the measured sites with sometimes a strong difference between the initial measurement and the remeasurement. The case of the Saint-Etienne metropolis illustrates this very well.

Further analysis of selected sites

Rennes metropolises website
Métropole de Rennes

This site appears very light.  The images, even if they are rather numerous, are light but should be lazy-loaded (load them only when they are displayed).  The use of a variable font would limit the requests. The carousel on the home page does not bring much. The fact that it is in autoplay may lead to overconsumption in addition to potentially causing accessibility problems.  The Accessibility page would be more relevant if it stated the compliance with the RGAA (Référentiel Général d’Amélioration de l’Accessibilité) and presented the multi-year accessibility plan for the site.  The few animations, even if they are not intrusive, seem superfluous and can lead to overconsumption.

montpellier metropolises website
Métropole de Montpellier

Following the remeasurement, the site of the metropolis of Montpellier is the least well placed. Leaving the site open, we quickly observe more than 300 HTTP requests for more than 30 MB of transferred data. Even after the site is loaded, the requests continue to accumulate.  

The homepage is particularly heavy, especially in terms of content: lots of images, autoplay carousels, lots of third-party services.  

If quick gains are possible through technical optimization, in-depth work is required, particularly through a more sober approach to design.

Summary of measures for metropolitan websites

versionMétropolesecoscoreEnergieCPUDonnéesMémoireRequêtesCarbonEauSol
https://metropole.rennes.fr/ - RemesureRennes804,600,832,22687,58430,300,0480,528
https://www.lillemetropole.fr/ - RemesureLille764,770,682,37685,11240,280,0470,537
https://www.grandnancy.eu/accueil/Nancy743,540,581,35544,09450,240,0380,412
https://www.bordeaux-metropole.fr/ - RemesureBordeaux724,780,661,45756,86510,300,0490,551
https://www.grandnancy.eu/accueil/ - RemesureNancy724,890,602,04718,18420,310,0500,560
https://www.orleans-metropole.fr/ - RemesureOrleans715,691,461,77544,13370,330,0550,643
https://www.metropolegrandparis.fr/fr - RemesureParis704,470,542,07704,63380,280,0460,511
https://www.saint-etienne-metropole.fr/Saint Etienne703,750,533,80426,20890,360,0490,463
https://www.lillemetropole.fr/Lille693,570,631,73560,04460,250,0390,416
https://www.metropole-rouen-normandie.fr/ - RemesureRouen665,001,300,94706,73300,270,0470,563
https://www.bordeaux-metropole.fr/Bordeaux623,870,851,34562,92600,270,0430,457
https://metropole.nantes.fr/ - RemesureNantes625,321,3510,16748,48600,520,0670,626
https://www.clermontmetropole.eu/accueil/ - RemesureClermont615,700,885,68808,34910,490,0690,679
https://metropole.rennes.fr/Rennes604,311,931,23639,53430,270,0440,495
https://www.toulouse-metropole.fr/ - RemesureToulouse604,750,912,49698,46710,350,0530,560
https://www.metropolegrandparis.fr/frParis594,080,831,94567,65430,270,0430,471
https://www.saint-etienne-metropole.fr/ - RemesureSaint Etienne575,861,0834,99819,961041,130,1130,743
https://www.brest.fr - RemesureBrest565,331,253,87723,991420,510,0700,664
https://metropoletpm.fr/ - RemesureToulon545,420,794,97686,441760,580,0780,694
https://metropole.nantes.fr/Nantes525,071,528,75699,17880,520,0670,613
https://www.ampmetropole.fr/Aix Marseille Provence514,380,9114,12893,421400,680,0760,573
https://www.metropole-dijon.fr/ - RemesureDijon516,082,083,51657,43700,430,0660,706
https://www.nicecotedazur.org/ - RemesureNice505,021,213,06654,931290,460,0650,622
https://www.metropole-rouen-normandie.fr/Rouen494,372,931,64657,77260,250,0420,493
https://www.clermontmetropole.eu/accueil/Clermont454,311,491,23698,79890,330,0510,520
https://tours-metropole.fr/Tours444,641,762,85778,26670,350,0520,547
https://tours-metropole.fr/ - RemesureTours444,891,075,43663,200,320,0490,542
https://www.strasbourg.eu/ - RemesureStrasbourg436,192,682,80754,16840,440,0680,725
https://www.grenoblealpesmetropole.fr/ - RemesureGrenoble416,592,373,81696,83860,480,0730,771
https://metropoletpm.fr/Toulon414,210,954,58921,882420,620,0770,598
https://www.toulouse-metropole.fr/Toulouse414,191,402,10601,40700,320,0480,498
https://www.ampmetropole.fr/ - RemesureAix Marseille Provence407,862,3010,18840,472070,840,1100,984
https://www.metzmetropole.fr/ - RemesureMetz3811,063,248,47925,301490,850,1261,300
https://www.montpellier3m.fr/ - RemesureMontpellier325,932,1340,93754,012591,480,1440,843
https://www.brest.frBrest315,382,403,64882,162180,610,0810,711
https://www.metropole-dijon.fr/Dijon285,886,316,48630,14770,490,0690,692
https://www.orleans-metropole.fr/Orleans286,407,572,27590,651120,470,0730,762
https://www.metzmetropole.fr/Metz2616,105,979,20856,201641,100,1711,858
https://www.nicecotedazur.org/Nice244,623,054,28651,051210,460,0620,576
https://www.grenoblealpesmetropole.fr/Grenoble1910,167,545,87656,85960,680,1071,168
https://www.montpellier3m.fr/Montpellier196,393,4428,83831,253801,420,1480,942
https://www.strasbourg.eu/Strasbourg97,858,801,98675,410,370,0680,860

We have calculated the average of these data. On the general level we notice that the average ecoscore is 50, the energy consumed is 5,65 mAh, the percentage of CPU used is 2,16, the data exchanged is 6,25 MB, the RAM used is 704 MB, the number of requests is 103. Concerning the environmental impact we can observe that the carbon impact is 0,51 gEqCO2, the water footprint is 0,070 Liters and the soil footprint is 0,68 m2.

By distinguishing the measurements from the remeasurements here are the averages that we obtain:

EcoscoreEnergieCPUDonnéesMémoiresRequêtesImpact Carbon (gEqCO2)Empreinte Eau (Litres)Empreinte sol (m2)
Moyennes des remesures575.721.407.30725950.520.0710.68
Moyennes des mesures initiales435.572.925.206821110.490.0690.67

City websites

Here again, we start by looking at the EcoScore of the sites of the cities in the sample.

ecoscore of city websites

Even more than for the metropolises, the trend for the EcoScore is clearly upward.  

In addition to the site of the city of Rennes (already discussed in the context of metropolises), the sites of the cities of Le Havre, Lille and especially Strasbourg have improved significantly. It is also the site of the city of Rennes that presents the best EcoScore. We note in passing the interesting choice of having the same site for the city and the metropolis. As for the lowest EcoScore, it goes to the site of the city of Tours.   
Now let’s look at the environmental footprint of these sites.

impact carbon of city website

The overall trend is downward, which is a very good thing.

Further analysis of selected sites

Lille website
Ville de Lille

Even if this site has evolved well since the first measurements, there are still areas of improvement to explore.  

Many HTTP requests, several MB of data exchanged and some 404 errors among the resources to recover.

Many http request

We note here in passing the interest of having an HTML 404 page as light as possible because this is often what the server will return if it does not find what is requested. Note that it is possible to modify this via the server configuration in order to send a simple message instead. The best thing is of course to make sure that you don’t go looking for elements that cannot be found. 

The homepage is very busy, with an auto-scrolling carousel and many images and content.  Il serait avantageux d’utiliser une font variable et d’éviter de charger toutes les icônes de FontAwesome.  Some images, weighing several hundred kb, should be optimized.

Tour website
Ville de Tours

In a rather classical way, there are many images here, some of which should be optimized.  

However, at first glance, the home page does not seem so busy. It is therefore necessary to dig a little to better understand what makes the site so heavy.  
We find about ten queries for fonts and we note in passing Google fonts (which can, let’s remember, cause concern with respect to the RGPD).

Several requests also seem to correspond to video. But most of the requests come from JS and CSS files. A closer look at the domains of origin of the requests reveals one of the explanations for the weight of the site. A closer look at the domains of origin of the requests reveals one of the explanations for the weight of the site.


Request map

This firework is provided by the RequestMap tool developed by Simon Hearne (already mentioned during the analysis of requests from an Android application). If we don’t have the details, we can see that there are many requests and that most of them come from other domains.  
The Domains tab of Webpagetest allows us to learn a little more:

This is only an excerpt but it shows several interesting elements:  

Most of the requests (in terms of numbers but also in terms of weight) come from other domains 
Most requests came from mobiledition.com 
Mobiledition.com proposes to those whose site is not responsive to generate a version of their site specially thought for a display on mobile. The intention is not bad but the approach is rather aberrant from the point of view of ecodesign. Indeed, this overlay will exist on top of the original site and will be automatically refreshed at each update of the site. Nearly 10 years after the appearance of the notion of responsive design, it would be important that all sites can adapt to different devices or even that they are thought mobile-first (first for mobile and then extend to other media). Or even offline-first in order to be able to cope more easily with degraded connections.  
In summary, it would be important to rethink the site in order to limit as much as possible the use of third party services to make it less impactful.

Measurement results for the cities’ websites

versionVillesecoscoreEnergieCPUDonnéesMémoireRequêtesCarbonEauSol
https://metropole.rennes.fr/ - remesureRennes824,721,012,20638,77430,300,0480,541
http://www.lemans.fr/ - remesureLe Mans764,650,642,01686,57710,330,0510,549
https://www.lille.fr/ - remesureLille764,991,074,35688,68800,410,0590,594
http://www.bordeaux.fr/ - remesureBordeaux754,450,540,51612,36260,230,0410,500
https://www.lemans.fr/ - remesureLe Mans754,910,752737,59710,340,0540,577
https://www.reims.fr/ - remesureReims715,391,222,70695,55610,360,0570,625
https://clermont-ferrand.fr/ - remesureClermont Ferrand685,341,121,11596,62560,320,0540,615
http://www.bordeaux.fr/Bordeaux663,381,780,42486,05930,280,040,42
https://www.amiens.fr/ - remesureAmiens645,640,712,67871,97480,350,0570,645
https://www.lehavre.fr/ - remesureLe Havre635,061,244,32775,82880,420,0610,606
https://www.lemans.fr/Le Mans633,730,713,77623,83640,330,050,45
https://www.aixenprovence.fr/ - remesureAix625,160,745,16748,061080,470,0650,629
http://nice.fr/ - remesureNice625,401,3324,73697,57650,830,0880,658
https://www.paris.fr/ - remesureParis626,001,856,81718,24470,450,0660,690
https://www.lyon.fr/ - remesureLyon614,920,953,46740,1461140,440,0620,603
https://www.paris.fr/Paris594,192,4517,64604,00490,620,070,51
http://www.lemans.fr/Le Mans584,081,962,75563,91660,320,050,48
https://metropole.nantes.fr/ - remesureNantes585,351,3110,10740,88600,520,0670,630
https://www.saintdenis.re/ - remesureSaint Denis585,770,875,54715,67670,450,0650,673
https://www.toulouse.fr/ - remesureToulouse575,070,912,91742,451030,410,0610,613
https://www.nimes.fr/ - remesureNimes565,441,5512,29700,411150,640,0790,673
https://www.saintdenis.re/Saint Denis564,452,782,74592,78410,300,050,51
https://www.villeurbanne.fr/ - remesureVilleurbanne555,281,1311,97625,22790,580,0720,635
https://www.amiens.fr/Amiens544,021,682,22734,33590,300,050,47
http://www.angers.fr/ - remesureAngers545,191,282,16596,79620,340,050,603
https://www.marseille.fr/Marseille534,761,747,86402,542430,710,090,66
https://www.reims.fr/Reims533,971,421,29507,91820,310,050,48
https://toulon.fr/ - remesureToulon535,420,654,94945,611530,540,0740,682
https://www.brest.fr/ - remesureBrest525,301,353,72733,541420,500,0690,661
https://www.dijon.fr/Dijon514,322,374,19580,40910,400,060,53
https://metropole.nantes.fr/Nantes506,392,8512,60656,37620,620,080,75
https://www.montpellier.fr/ - remesureMontpellier496,271,019,451029,02730,560,0760,737
https://metropole.rennes.fr/Rennes494,422,891,85616,47480,290,050,51
https://www.marseille.fr/ - remesureMarseille485,921,7119,55690,652010,940,1050,782
https://www.lyon.fr/Lyon464,622,852,69573,40680,350,050,55
https://www.annecy.fr/ - remesureAnnecy455,571,794,23692,911160,480,0690,67
https://clermont-ferrand.fr/Clermont Ferrand455,031,763,17462,48880,400,060,60
https://www.mairie-perpignan.fr - remesurePerpignan457,332,419,74793,541590,730,0970,900
https://www.strasbourg.eu/ - remesureStrasbourg436,383,142,79702,44840,440,0690,746
http://www.angers.fr/Angers425,594,353,46591,16570,390,060,64
https://www.dijon.fr/ - remesureDijon424,661,001,44656,4690,220,0410,511
https://www.grenoble.fr/ - remesureGrenoble406,082,166,44571,02730,490,0700,712
https://www.mairie-perpignan.frPerpignan405,192,782,50544,381470,480,070,65
https://www.aixenprovence.fr/Aix394,611,687,84768,691100,510,070,57
https://www.lille.fr/Lille396,233,3912,66852,37840,650,080,74
https://www.limoges.fr/fr - remesureLimoges398,511,822,33609,381000,540,0880,986
https://www.toulouse.fr/Toulouse384,572,443,00641,751230,430,060,57
https://www.tours.fr/ - remesureTours385,680,885,67818,580,350,0550,628
https://toulon.fr/Toulon375,852,0916,48923,892150,900,100,78
https://www.brest.fr/Brest345,773,093,40843,122090,610,080,75
https://www.grenoble.fr/Grenoble335,666,555,93600,86600,450,060,66
http://nice.fr/Nice336,074,6526,59627,281941,090,120,80
https://www.villeurbanne.fr/Villeurbanne335,222,278,72740,511280,580,070,65
https://www.lehavre.fr/Le Havre324,663,305,40726,971060,460,060,57
https://www.montpellier.fr/Montpellier305,081,867,20899,691680,600,080,66
https://www.nimes.fr/Nimes294,172,325,13715,841670,520,070,55
https://www.annecy.fr/Annecy279,606,742,98619,481230,640,101,12
https://www.limoges.fr/frLimoges2615,127,251,96614,32600,750,141,69
https://www.tours.fr/Tours1610,224,7821,99961,472031,180,151,25
https://www.strasbourg.eu/Strasbourg87,457,955,83663,390,430,070,82

We have calculated the average of these data. On the general level we notice that the average ecoscore is 49, the energy consumed is 5,57 mAh, the percentage of CPU used is 2,22, the data exchanged is 6,36 MB, the RAM used is 689 MB, the number of requests is 99. Concerning the environmental impact we can observe that the carbon impact is 0,50 gEqCO2, the water footprint is 0,069 Liters and the soil footprint is 0,668 m2.
By dissociating the measurements from the remeasurements here are the averages that we obtain:

EcoscoreEnergieCPUDonnéesMémoiresRequêtesImpact Carbon (gEqCO2)Empreinte Eau (Litres)Empreinte sol (m2)
Moyennes des remesures585.531.285.92719880.470.0660.656
Moyennes des mesures initiales415.613.166.816581110.530.0720.680

The initial measurements were conducted on a Samsung Galaxy S7 smartphone running Android 8.

The remeasurements were performed on a Samsung Galaxy S9 smartphone running Android 10. The measurements were performed through our Greenspector Benchmark Runner tool, which allows automated tests.

Detail of the scenarios :

  • Loading the application
  • Reading the website in foreground
  • Reading the page with scroll
  • Inactivity of the website in background

Each measurement is the average of 3 homogeneous measurements (with a low standard deviation). The consumptions measured on the smartphone connected to a wifi network can be different when the smartphone is connected to a wired network. For each iteration, the cache is cleared beforehand.

Discover how Greenspector evaluates the environmental impact of digital services.


Nantes Digital Week 2022: Ranking of the digital sobriety of partners’ and visitors’ websites

Reading Time: < 1 minute

Last month we were present at the Nantes Digital Week. We participated in several conferences and workshops on the theme of responsible digital. It was an opportunity to meet many digital actors but also many visitors curious to know more about this vast subject.

On Thursday 22 October we ran the workshop “Hosting, measuring and designing virtuous websites” together with DRI and Webofacto. In this context, we measured the websites of several visitors and partners of the event.

The ranking in detail

The average carbon impact of one minute of navigation for these 98 partners is 0.45 gEqCO2, which is the equivalent of driving 2 metres in a petrol-driven car. Only 8 sites are above this average, which shows a good trend. The most sober website in this ranking (the CIC site, 0.19 gEqCO2) has 7.8 times less impact than the least sober site (Saint-Nazaire Tourisme, 1.5 gEqCO2).

The average power consumption (mAh) is 3.7 mAh and on average 9.01 MB of data is exchanged. In terms of web requests, the average is 73.

RankNameecoscoreCarbon Impact (gEqCO2)requestsEnergy (mAh)Data (Mo)Memory (Mo)Water footprint (Litres)Surface footprint (m2)
1CIC810,19312,971531,870,030,34
2Le Blog du Modérateur840,2183,571,06605,540,030,40
3La Cantine800,22383,21,34570,440,030,37
4Banque des territoires730,22512,921,31669,140,030,35
5Whome760,26433,143,32661,640,040,37
6sfr630,27683,511,45674,380,040,42
7Chateau des Ducs de Bretagne620,27483,91,91757,640,040,45
8BNP Paribas720,28773,122,11669,860,040,39
9Cobage670,31723,33,15582,250,040,40
10Mismo610,31733,782,48864,870,050,46
11Enedis520,35573,55,91716,590,050,42
12Sogetrel520,371033,473,76860,640,050,44
13Ecosystem360,37524,934,33744,720,050,57
14_icilundi690,38273,379,48661,030,050,40
15PALO IT610,39873,85,04708,840,050,47
16Université de Nantes710,4613,468,16650,390,050,42
17VIF510,411123,794,41826,630,050,48
18La Box Loire Atlantique630,47913,748,63650,420,060,47
19Radio Prun'500,48443,5612,92712,560,050,43
20Maison Europe580,5514948,09695,450,070,53
21Isefac Bachelor410,61813,828,4915,640,070,53
22Accenture350,61636,9211,29647,930,080,80
23Tele Nantes480,81463,4321,39821,120,080,48
24Groupe Onepoint571,11843,3640,15744,130,100,47
25Saint Nazaire Tourisme471,5704,1658,42761,910,130,57

For each of these websites and applications measured on a Samsung Galaxy S9 smartphone, the measurements were carried out using our Greenspector Benchmark Runner tool, which enables automated testing.

  • Loading the application
  • Reading the website in the foreground
  • Reading the page with scroll
  • Website inactive in background

Each measurement is the average of 3 homogeneous measurements (with a low standard deviation). The consumption measured on the smartphone connected to a wifi network may be different when the smartphone is connected to a wired network. For each iteration, the cache is emptied beforehand.

Find out how Greenspector assesses the environmental footprint of a digital service.

Digital sobriety at Greenspector 

Reading Time: 6 minutes

As we talk more and more about digital sobriety, it’s important to come-back to this notion. Especially it’s a part of greenspector activity. 

Definition 

Digital sobriety is a global approach of digital, respectful of the earth and people. 

Since few years, this topic takes more and more extent. We see this notion almost everywhere but often limited in consideration of environmental impact. For many Eco-design has been the gateway into the digital sobriety. 

  • Eco-design and digital environment impact consideration 
  • Digital accessibility and inclusion 
  • Attention economy 
  • Respect for personal data and privacy protection  
  • Cybersecurity 
  • Ethics 
  • Low tech and fight against technological solutionism
Eco-design and digital environment impact consideration

Various aspects of digital sobriety 

Environmental impact consideration plays a crucial role in digital services. Beyond resources consumption related to their use (for example, energy needful to charge the battery), these services affect the user’s equipment: battery and components wear, memory and system surcharge… Those impacts motivate early change of latest and newer equipment. 

However, today, the manufacturing of those equipments represents the phase of digital services with the greatest impact on the environment. It suits to create websites, mobile applications, and other digital services with as low impact as possible.  

That’s why the repositories have been increasing. Examples include the GR491 of INRthe RGESN of DINUMthe 115 best practices or OPQUAST.   

Add to this the law REEN as well as tools for evaluating the impact of digital services 

Finally, we observe that the subject is gaining momentum and structuration. We can only delight even though there is a long way to go. 

The benefits for users and companies are considerable. Overall, this approach improves the user experience (and in particular performance) as well as reduces development, maintenance and hosting costs. Similarly, the adoption of eco-design leads to the development of expertise, an improvement in brand image and constitutes a factor of attractiveness for customers but also for future employees 

As a result, an eco-designed digital service will often have a smaller scope, which will facilitate its security, its compliance for accessibility and will tend to restrict the personal data collected.

personal data collected

Eco-design also tends to ignore mechanisms aimed at capturing attention (infinite scroll, autoplay of videos, excessive notifications, etc.). This also constitutes an ethical advance: the user is no longer just a consumer who must be retained by all possible means. We gain their trust and support by first providing them with quality service, tailored to their expectations. 

Finally, by placing the user at the center of considerations, digital sobriety tends to avoid technological solutionism. This will avoid (among other things) going to digital services when it does not seem necessary. Sometimes a good old SMS can replace a website or a mobile application: a low-tech solution can meet user needs just as well (sometimes even better). 

At a time when more and more services (including public ones) are becoming digital, the accessibility of digital services is a central subject, in a process of inclusion and access to services for all. Unfortunately, this important subject does not yet receive all the attention it needs, although many tools exist and are being developed. The standard (RGAA) is now in its fourth version and the legislative framework extends to public structures as well as companies whose turnover exceeds 250 million euros. It offers a concrete approach to WCAG: a complete panel of W3C recommendations for accessible web content. Verification tools are numerous, even if they are not sufficient to verify all the criteria. 

Yet, even today, 97.4% of the most used websites have at least one accessibility errorThe compliance with administrative procedures is also far from what one might expect. Accessibility nevertheless remains an essential subject for digital sobriety technology and contributes to ensuring the usability of digital services as well as their sustainability.   

Beyond the penalties incurred by companies in the event of non-compliance with obligations, the benefits of this approach are numerous : 

  • Ensure that everyone can access the services and information offered under good conditions. 
  • Reach as wide an audience as possible, in particular via the curb cut effect
  • Develop internal expertise (retention of employees and attractiveness for recruitment). 

The attention economy is a field relatively little known as such, although it is already deeply rooted in our daily lives. These are all the mechanisms (design, design, functional, and others) that make us addicted to our smartphones and certain apps. We are talking here about captological mechanisms (or deceptive patterns): infinite scroll, notifications, modals, autoplay, etc. Through these design choices, the time spent on our mobiles increases, and our attention span decreases. The stake around our attention is above all financial. All this is detailed in the book The Goldfish Civilization and structures such as Designers Ethiques have already taken up the subject

This problem is all the more fundamental since we find ourselves faced with tools designed to spend as much time as possible on them, even though their use has a non-negligible environmental impact (via the wear and tear of the terminals, their energy consumption but also by ultimately pushing consumerist behavior, in particular through massive exposure to advertisements). It should be noted that in addition to these harmful impacts on the environment and the individual, there are ethical considerations since this system often results in greater collection of personal data. 

Regarding personal data, the question is not new, but the implementation of the GDPR was an important turning point. The aim here is to regulate the capture and storage of personal data of European citizens but also by European companies. This complex subject is particularly linked to micro-targeting (targeted advertising based on data collected on the Internet user) and is all the more dizzying in that it involves companies buying and reselling personal data (data brokers, all against a background of surveillance and political issues as in the case of Cambridge Analytica). More recently, the subject of personal data has returned to discussions following the questioning of the use of Google Analytics and Google Fonts, particularly in France. Not to mention the leaks of personal data that occur very regularly.   

Cybersecurity is present everywhere, through security breaches and other incidents that we hear about regularly. Today, it would seem aberrant or even irresponsible to offer a digital service that is not secure. However, this area requires many skills as well as constant monitoring. Again, digital sobriety can reduce the attack surface of a digital service. In return, care must be taken to ensure that the protection of the user does not force him to update his applications and software too often, under penalty of tending towards software obsolescence. Likewise, open source makes it possible, via total transparency, to prevent the presence of vulnerabilities. 

Ethics is a complex but necessary subject in the digital field. It is often at the heart of discussions, especially on the vast subject of algorithms and machine learning, for example in the case of self-driving cars. In order to design a digital respectful of individuals, the question of ethics is inseparable. 

Finally, technological solutionism, largely theorized by Evgeny Morozov, warns that digital is not always an appropriate solution. This awareness is all the more essential when we seek to reduce the environmental impact of digital technology.

Digital sobriety as part of the Greenspector’s work.

At Greenspector, digital sobriety is at the heart of our business. Even if our primary concern remains the reduction of the environmental impacts of digital services, all this is accompanied by considerations related to digital sobriety technology. The inextricable links between the different aspects of this subject mean that it is essential to guarantee a global approach so as not to miss an area for improvement, or even to avoid providing a recommendation that would harm the users in one way or another (deterioration of accessibility, security risk, etc.). If the impact is not always directly measurable or the seemingly minimal gain from the point of view of sobriety, other axes such as accessibility, the absence of captological mechanisms, and respect for privacy will contribute to making a more resilient product. This is why (and this is just one example among many), we encourage our customers not to directly integrate content from third-party services such as Youtube, Twitter, and others.

For this, Greenspector supports its customers in the eco-design of products throughout the life cycle of the project, but also in the measurement of consumption and the monitoring of impacts over time, in addition (for example) to an improvement process. These are the principles that we also apply to our own products.

In order to work for a digital system that respects people and the planet, it seems essential to apply these values right down to the proposed working framework: allow everyone the possibility of teleworking as much as necessary, insist on the right to disconnect and give everyone the opportunity to adapt their schedules to their own needs. There is also the desire to free up time for everyone to carry out digital monitoring, to create spaces to share the results of this monitoring and to support the development of skills.

Resources to go further

The resources to become aware of digital sobriety are multiplying, but here are already two good starting points : 

CMS, No Code or without CMS, which solution to choose for a sober website?

Reading Time: 6 minutes

Today, we are studying the impact of solutions allowing the implementation of websites without knowledge of coding. Among these solutions, we can include CMS (Content Management System) but also No Code solutions.

This article is the first in a series where we analyze the measurements of 1500 sites through our tools.
In these articles, we will deal with the impact of technologies, and parameters…

Methodology disclaimer:

We have measured more than 1500 sites on real devices via our benchmark suites allowing the realization of automated tests (launch of the site, waiting, scrolling, sitting in the background). We then retrieve technology information from these sites via the WepAnalyzer solution.

We have chosen to focus our analysis on energy consumption. Consuming energy affects battery life on user devices, which ultimately impacts the environment.

How to read the graphs?

We visualize the data by “box plot” graphs:

  • The centre bar indicates the median. The rankings are made with this data.
  • The top and bottom of the box are bounded by the 25th and 75th quantiles.
  • The size of the box is called the interquartile range (IQR)
  • The bars at the top and bottom are the whiskers and delimit the expected values
  • Whiskers expand at 1.5 IQR
  • Values ​​outside the whiskers are visualized via dots. They represent either errors or outliers.

We deliberately discarded sites that did not have enough samples (for example less than 10 sites with a certain technology).

How are CMS and No Code solutions positioned?

Ranking of CMS according to the median value of energy.

We find the most widespread technologies (according to Web Core Vitals), apart from Shopify (these sites must be classified in the “No CMS” category).

We observe a 20% difference between the most efficient solution (Ametys) and the least efficient (Webflow).

Three CMS are positioned ahead of sites without CMS. Popular CMS like Drupal and WordPress are lagging behind. The last four solutions are No Code solutions.

There are many outliers in some categories (WordPress, sites without CMS). It is explained by a large data set (several hundred sites). An exploratory analysis of these sites generally shows that they are sites with fairly heavy streaming processing (such as video). Here is an example of a site positioned in “outlier“ the loading and idle stage (inactive site) consume a lot given an animation that runs continuously.

Quelques pistes d’explications à l’analyse des CMS :

Ametys: a domain-specific CMS

Ametys is a specific CMS which is used for institutional sites. Our ranking of school websites, in which many schools use this technology, explains its presence in this ranking. Its good positioning would have to be analyzed from a technical point of view. However, we can deduce that a solution that targets a type of need will be more optimizable than a generic solution. The integration of multiple functionalities in a CMS will indeed lead to overconsumption. We also observe that these institutional sites include fewer modules than the other sites. It is ultimately about functional sobriety.

Squarespace: an all-in-one solution

Squarespace is a publisher-hosted CMS. On the sites analyzed, we can identify there are few requests (<30), so there are potentially integrated optimization solutions. In other tracks, all the resources are hosted on Squarespace, and the assets (or assets) are on dedicated servers. The hosting of the CMS by the publisher is indeed a good thing because it will allow systematic and shared optimizations. However, this is not necessarily native. The editor must apply it.

Typo 3: native optimization options

Typo 3 which is an open source solution is in 3rd position. An HTTP Archive ranking is confirming this positioning. Fine cache management and native optimization options explain this performance.

Sites without CMS

Sites without CMS integrate a heterogeneity of technical solutions. It is difficult to draw conclusions. However, the median of the sites is positioned very well compared to other solutions (No Code, WordPress, Drupal, etc.). The low moustache is the lowest compared to all the other solutions. As a result, significant efficiency can be achieved more easily.

Drupal: a professional CMS

Drupal is positioned just after sites without a CMS. The good positioning of this CMS is explained by its less accessible setup and start-up process than WordPress.

Contentful: a headless CMS

Contentful is a “no interface” CMS. It allows you to publish content from other tools. The efficiency gain is present for the publication (because we do not use our usual tools). However, we observe that this CMS is just as efficient as a classic CMS.

WordPress : un CMS simple et très répandu

The WordPress platform is very popular and offers many plugins and themes. But genericity and modularity come at a price. Non-technical users can use this CMS. A potential explosion of plugins and non-configuration of the CMS in terms of performance and efficiency are the counterparts. We see in relation to the low moustache that the CMS can be efficient. However, this requires a lot of work.

Wix, Webflow, SiteCore, Adobe: No Code or equivalent solutions

These solutions offer the user the possibility of creating a website without coding knowledge. The median is high. The low whiskers are also higher than other solutions. It shows that they are heavier solutions.

Conclusion 

From a statistical point of view, CMS solutions do not all have the same efficiency. The initial design, taking into account optimizations, will be essential to achieve good performance (case of Typo 3). We observe that end-to-end control, combined with good practices implementations (Squarespace), also makes it possible to achieve a good efficiency level. In the same way, specializing in a CMS (Ametys) and therefore the options that go with it will allow you to obtain good results.

However, on the other hand, making a very generic and modular CMS (WordPress), even if potentially efficient initially, will bring bloatware. In the same way, the No Code will add a heaviness. It remains to identify the causes of this heaviness. Indeed, it can come from levels of abstraction but also from rendering possibilities (interactivity, animations, etc.) which are easily possible and which lead the user to add more than is necessary. In addition, the use of a “generalist” CMS is also potentially representative of a lack of precision in the need.

For a CMS solution (and more generally any solution), sobriety will not be innate. It will be necessary to apply a set of good practices:

  • Efficient architecture and technology, although if we take current technologies the difference between the solutions is very small, and the impact comes more from the misuse of technologies.
  • Native integrations of optimizations or easily activated by use.
  • Functionality limitation mechanism or in any case sensitizing the user to bloatware.
  • More generally, think about the end-to-end issue, taking into account hosting, and CDN (Content Delivery Network); without going to end-to-end managed solutions, we see that the distribution of systems is not necessarily a good thing.
  • In order to always offer more flexibility to the user, and among other things to allow non-technical people to create sites, it is necessary to integrate optimization solutions natively, which is not at all currently the case.

Do you want to include a CMS in this ranking? Contact us and send us at least 20 links to sites using technology, we will integrate them into the measures and within our ranking!

For our next article, we will go into the finer analysis of WordPress data to observe which parameters and configurations influence environmental performance.

Does a sober site have to be ugly?

Reading Time: 8 minutes

Today, we focus on a question that comes up very often when we address the question of web eco-design or digital sobriety: is an eco-designed site necessarily ugly? Often, the request consists of obtaining examples of “pretty and eco-designed sites” (preferably with a purpose similar to the current project). Specialists in web accessibility have no doubt encountered this type of question frequently. It is already not easy to define what would be, in absolute terms, a “pretty” site. The concept is itself very subjective.

We will therefore proceed differently. We will first compile a list of sites that are sober. There are lists and directories for this, which will be listed later. After compiling the list, we will do a quick analysis to exclude sites that are not as sober as advertised (too much data transfer, too many requests, etc.). Finally, we will use the Greenspector tool to decide between them (by classifying them and identifying those that are more impactful at first sight).

Finally, armed with this list, we will look at what they look like and try to identify design trends, depending on their purposes (an information site does not necessarily look like an e-commerce site or a web agency, for example). Moreover, it will provide an opportunity to keep in mind other aspects of Digital Sobriety, such as accessibility. Having a site that is light and pleasant to look at does not make sense if it is unusable for part of the population.

The purpose here is to offer a list of websites with a lower environmental impact. Everyone is free to find those that seem attractive to them and that correspond to their expectations (in terms of purpose, target, etc.). Thus, this list could be a source of counter-arguments concerning eco-designed sites which would necessarily be ugly. It can also be a way to find sources of inspiration in order to design eco-designed and attractive sites.

Where are the sober sites? 

We have chosen to go through the lists and catalogues of sober sites, with the bonus of other sites crossed elsewhere.

Here are the lists in question:

There are probably others, but this is already a good starting sample. If you have others in mind or want to test your site’s sobriety, do not hesitate to contact us.

A first analysis was carried out with this first list (more than a hundred references in the end). This is mainly based on the Network tab of the DevTools to watch the HTTP requests and the amount of data transferred.

In the end, only about forty sites are left, which are then used for a benchmark with the Greenspector tool.

Sober sites: the verdict by measurement 

The benchmark of the selected sites makes it possible to classify them according to their respective EcoScores (the idea being to obtain an EcoScore as close as possible to 100).

RankingURLEcoscoreEnergy (mAh)Data (Mo)Requests HTTPCarbon Impact (gEqCO2)Water Surface (Litres)Land use (m²)
1https://kuroneko.io/fr/944.240.1420.180.040.46
2https://lesraisonnees.co/944.080.21110.190.040.45
3https://brawcoli.fr/924.080.13110.190.040.45
4https://solar.lowtechmagazine.com/924.350.35170.210.040.48
5https://www.pikselkraft.com/914.350.1130.190.040.48
6https://amap-chelles.net/904.590.3440.20.040.5
7https://primitive.wildandslow.fr/904.10.16110.190.040.45
8https://productfornetzero.com903.990.17140.190.040.44
9https://www.mountain-riders.org/904.310.23190.210.040.48
10https://fairness.coop/894.280.09140.20.040.47
11https://jeudi.am/894.470.15200.220.040.5
12https://www.boavizta.org/894.260.2790.20.040.47
13https://lowtechlab.org/fr874.090.2260.180.040.45
14https://www.gov.uk/874.350.24150.210.040.48
15https://www.treebal.green/874.190.8170.210.040.47
16https://www.boutique-natali.com/864.840.44250.250.040.54
17https://designersethiques.org/854.060.28170.20.040.45
18https://oceanfifty.com/854.630.42140.220.040.51
19https://anelym.fr/844.640.17230.230.040.52
20https://lowimpact.organicbasics.com/eur844.650.74330.260.040.53
21https://www.europeansleeper.eu/en844.330.73310.240.040.49
22http://www.biocoopmontreuil.fr/834.750.53230.240.040.53
23https://www.licoornes.coop/824.370.17280.220.040.49
24https://empreintedigitale.fr/814.261.14260.240.040.48
25https://www.international-alert.org/814.670.83280.250.040.53
26https://www.laboutiquedupartage.fr/814.770.31200.230.040.53
27https://www.light-communication.fr/814.530.19130.210.040.5
28https://dolo.biz/fr/804.811.19150.250.040.53
29https://www.polybion.bio/804.881.02100.240.040.54
30https://zugvoegelfestival.org/794.260.52440.250.040.49
31https://pathtech.coop/774.550.6660.210.040.5
32https://dalkia.fr/764.280.89380.250.040.49
33https://sustainablewebdesign.org/764.881.02430.290.050.56
34https://palaeyewear.com/744.511.19780.320.050.54
35https://themarkup.org/735.271.13140.260.050.58
36https://www.ademe.fr/724.750.64260.250.040.53
37https://theadccawards.ca/715.460.2960.240.050.6
38https://flowty.site/636.910.35210.320.060.77
39https://heylow.world/626.140.35190.290.050.68
40https://becolourful.co.uk/606.150.23150.280.050.68
41https://www.ec-lyon.fr/595.060.81430.290.050.58
42https://www.wholegraindigital.com/588.650.65250.410.080.96
43https://daviddaumer.com/507.830.32130.350.070.86

For each of its websites, measured on an S7 smartphone (Android 8), the measurements were carried out using our Greenspector Benchmark Runner, allowing automated tests to be carried out. The measurements were taken at the end of June 2022.

Scenario details:
– Loading the website
– Page scroll
– Inactivity website in foreground
– Website inactivity in the background

Each measurement is the average of 3 homogeneous measurements (with a low standard deviation). The consumption measured on the given smartphone according to a wifi type network may be different on a laptop PC with a wired network for example. For each of the iterations, the cache is first emptied.

Find out how Greenspector assesses the environmental footprint of a digital service.

By classifying the results (by EcoScore) and looking at the extremes, we already notice two things:

  • Some sites have scores above 80 or even 90. This is a rare occurrence and highlights sites that have made an effort to maintain digital sobriety.
  • Some sites have an abnormally “low” EcoScore. Thus, these are rather light sites, but they are still impactful.

https://daviddaumer.com/ (EcoScore Greenspector 50): few requests on the page, little data transfer. We look with EcoIndex, and the score A is obtained (which is the best possible score). EcoScores drop due to animations that continuously drain the device’s battery. Therefore, by displaying this page, the battery is discharged faster, which increases its wear and predicts the need to replace the battery. It induces heavy environmental impacts, most of which come from the device fabrication. The impact of CSS and JS processing should be limited. Are animations necessary? What are their accessibility and attention capture impacts?

The reasoning is pretty much the same for:

In the end, the examples illustrate the need to consider all factors before claiming that a site is sober or has benefited from eco-design. It is good to make efforts to reduce the number of requests and the amount of data transferred. On the other hand, JS or CSS treatments (more particularly animations) can cancel out a good part of the benefits thus obtained. Especially (and I insist on this point) that these animations potentially have a detrimental effect in terms of capturing attention but above all accessibility. On this subject, I invite you to refer, among other things, to criterion 13.8 of the RGAA (On each web page, is each moving or flashing content controllable by the user?). The most glaring example here is https://heylow.world/ with its very present animations which further impair readability for all users.

Analysis of the ranking of sober sites 

We started with what to avoid to produce an eco-designed website that is visually pleasing without sacrificing usability. Let’s now take a closer look at the sites to extract relevant examples.

We can already consider the list of sites with an EcoScore > 70% as sites on which a sobriety effort has been made. It remains to be seen what can make them attractive and which ones to highlight.

Note: to avoid possible bias, we haven’t included the Greenspector site has not been included (even if its EcoScore is around 72).

E-commerce

The list contains 3 e-commerce sites:

https://lowimpact.organicbasics.com: as of this writing, the standard site is under maintenance. In the “low impact” version, the choice of sobriety is clearly displayed. The focus is on simple shapes (via SVG) and solid colours. On the other hand, it is regrettable that this version is not the default version of the site. This significantly undermines the impact of this approach.

https://palaeyewear.com: the homepage is rather light and pleasant. It includes the classic elements for such a site: a video (integrated soberly), some products, consumer opinions, some news, an impact report, etc. Several good efficiency practices are not respected but this page is doing better than most other e-commerce sites. Everything gets complicated when you access a product sheet. Here, more than 100 requests and several MB of data are transferred. The eco-design effort should therefore have been pushed further, in particular by basing itself on a user journey (navigation and purchase of a product) rather than only on the home page.

https://www.boutique-natali.com: On this page, we also find several elements specific to this type of site (current promotions, reinsurance elements, products highlighted, etc.) in addition to highlighting the eco-design approach implemented. The same sobriety can be found on the product sheets. Admittedly, some types of products sold online probably require more images (for example in the field of fashion or cosmetics) but in my opinion, this is a good basis for thinking about designing an online store. light and pleasant to use.

Magazines and online press

https://themarkup.org is a sober and elegant site at the same time, which is all the more remarkable for the online press. These sites are usually weighed down by advertising and trackers, among other things, which is not the case here. An important site to keep in mind is an example of an eco-designed online press site. Be careful, however, the lightness of this site compared to other similar sites is partly due to choices of an economic model. Once again, this highlights the role that all the actors of a project have to play on the subject of digital sobriety.

https://solar.lowtechmagazine.com: This is probably one of the best-known examples. The radical choice of environmental impact reduction is clearly displayed here. This will not necessarily be unanimous (notably because of dithering).

We find a similar logic on the Designers Ethiques site (layout similar to an old-fashioned paper newspaper for a more sober result) or even (for the structure) on that of Pikselkraft. The Low-tech Lab site, if it takes up certain elements, goes to a page richer in content and with a less rigid structure. The home page then seems more attractive and the content easier to identify.

Others sites 

https://lesraisonnees.co: a scroll-based one-page site. An agency site with classic content but produced in a very sober and efficient way, very clear. A very good example.

https://brawcoli.fr: the classic elements are grouped together on a single page, putting well before what this restaurant offers.

https://primitive.wildandslow.fr: we find in the list of many agency sites or freelancers specialising in the creation of sober sites (which is logical and even reassuring). The idea is generally to present everything on a single page with solid colours and few images (all optimised). Primitive by Wild&Slow is quite representative while standing out, among other things, for areas with non-linear contours. In other cases, the emphasis is on geometric shapes rather than more complex images.

https://www.treebal.green is a much richer variant graphically and for all that quite sober.

https://www.mountain-riders.org is a good example of using the principles seen above with a very contrasting graphic charter for a clean and attractive final rendering.

Although it may seem less attractive than others, https://www.gov.uk shines with its lightness and accessibility. Great efforts have been made here at the level of information architecture. It is in any case interesting to have here an example of accessible and sober public service.

Even if continuous and ubiquitous animations are to be avoided, some lightweight sites use them sparingly:

In any case, it is advisable to keep in mind the accessibility as well as the fact that this type of addition is only cosmetic. For some sites like https://dolo.biz/, the attractiveness of the home page relies heavily on the animations but everything remains efficient and rather pleasant (even if it will not necessarily be practical for everyone’s navigation, in particular, the keyboard).

In a totally subjective way, I also retain https://zugvoegelfestival.org for the choice of colours and navigation on the home page. It is just unfortunate that the various navigation elements on the site are not available (at least by click) upon arrival on the site.

And a last special mention for https://sustainablewebdesign.org which uses geometric shapes, and bright colours and emphasises accessibility while being a mine of information on web eco-design.

Conclusion 

The ranking presented here should give you a better idea of what is possible with a sober website. This list is expected to grow over time and serve as an inspiration for those who wish to create sober websites.

One must consider accessibility when using a site and dig as deep as necessary into the notion of sobriety if the feeling one can get is partly subjective.

Metaverse and Digital Sobriety

Reading Time: 5 minutes

The concept of the Metaverse isn’t new, and some may even remember Second Life, some consider it to be its first manifestation. The idea is to offer a virtual environment via what is now called XR (eXtended Reality), a mixture of augmented reality (a bit like Pokemon Go) and virtual reality (the older ones will think of the film The Lawnmower Man but we will prefer the example of Oculus Quest).

In October 2021, Meta (formerly called Facebook) announced that it was going all out on the subject of the Metaverse. A huge amount of investment is needed to create 10,000 jobs and train those who will work in this field. Many large companies have followed suit so as not to miss out.

The ultimate goal would be to provide users with a potentially 3D immersive environment where they could find their favourite brands and interact with whoever they want without leaving their homes.

Coupled with cryptocurrencies and NFTs, the metaverse would even be one of the pillars of Web3.

Like connected glasses, this is a digital Arlesian, and we are entitled to wonder if this new attempt will be successful this time. Except that the real question is whether the metaverse is compatible with current issues related to digital, which we find in particular through Responsible Digital.

Metaverse and Digital Sobriety

By taking up the main challenges of Responsible Digital, let’s see what we can expect from the metaverse. 

Accessibility 

While more than 96% of websites have at least one accessibility error, the accessibility of the web as it exists today remains very problematic. Likewise, remember that access to the web remains complicated for a large part of the world’s population, whether due to an outdated device, an insufficient internet connection or simply insufficient skills to be able to fully use the digital tools. Including these three issues, Digital illiteracy affects 17% of the French population.

In such conditions, it’s a safe bet that the metaverse will not come to fix things. In the metaverse, those who are unable to access the web in satisfactory conditions today will probably be left out. Not to mention that the prerequisites in terms of the device power and internet connection may be much higher (but we will come back to this later).

Security 

Digital illiteracy has a substantial impact on security: if individuals are not sufficiently prepared to use digital tools, they are exposed to risks they cannot control. There is no doubt that the metaverse will come with new attack opportunities. We can already imagine to what extent such an immersive universe and today also linked to major brands can offer new vectors for phishing. It is also to be feared that, in order not to interfere with the immersion or the comfort of the users, safety takes a back seat.

Capturing (and manipulation) attention

Attention capture (see French CNUM report in PDF) consists of setting up design mechanisms (scatological mechanisms or dark patterns) to retain the user’s attention for as long as possible. In the metaverse, one can imagine that this will only get worse, one of the objectives being immersion. We are exposed to more than 5000 advertising stimuli each day, especially via the web. Based on the list of companies contributing to the metaverse, this is unlikely to succeed.

How, under these conditions, will our filter bubble evolve? Is there not a risk of seeing the influence of certain digital players on the political context increase? Should we be worried about Meta taking over the subject of the metaverse (in short: yes)?

Here are just a few questions among many others (on the moderation of this new shared space, the rights to the content that will be (re-)produced there, etc.).

Digital Sobriety

It is interesting to consider the metaverse from the angle of environmental impacts.

You will quite easily find experts extolling the merits of the metaverse to unclog the roads, project yourself into spacious offices at a lower cost, perform surgeries from the other side of the world, etc.

It’s always thrilling to hope that someone will come up with a product that solves a whole host of issues we didn’t even know existed. In this specific case, I would be in favour of the Design is the Problem approach. Nathan Shedroff explains how to rethink design in order to come up with truly sustainable solutions. He takes the example of the Segway PT, a personal, electric and removable/repairable transport device. Presented in this way, one would think that it would be a good idea for the planet. Except that the real concern of this device is that it does not meet a real user need. Indeed, public transport, cycling and walking can ideally replace it, with a much lower impact and financial cost. Any resemblance to electric scooters is purely coincidental (or not).

The metaverse poses the same problem in its very concept: it seeks to meet a myriad of diverse and varied needs, even though less impactful and costly alternatives exist. Only its technical and innovative varnish promotes its adoption and leads large companies to blindly embark on it.

In order to assess the environmental impact of the metaverse, several elements must be considered.

  • On the one hand, generating and displaying an immersive virtual environment is very resource-intensive. Below 90 fps, the user is exposed to nausea and dizziness. In addition, in recent years, everyone has been able to discover increasingly magnificent 3D virtual environments (largely through video games). It, therefore, seems essential to align with these types of visuals, which will be costly both for their products and for their display.
  • On the other hand, the use of the metaverse (in particular taking into account the elements indicated in the previous point) will probably require better user equipment (even new user equipment) as well as an internet connection with a very high speed (would not be -what to display a virtual environment while holding the 90 fps). Knowing that very logically (and this is also what we have clearly seen with video games), renderings and attendance should (if all goes well for the metaverse) increase over time, encouraging the race to renew equipment.

Even as initiatives are multiplying to reduce the environmental footprint of digital technology, the arrival of the metaverse, therefore, represents a major risk.

Conclusion 

Efforts to extend Responsible Digital principles to the web are increasingly intense, and the work is already colossal. The arrival of Web3 and more particularly of the metaverse risks making these principles all the more essential but also more difficult to enforce. It seems (for once) easier to generate jobs and spend crazy sums for a concept whose usefulness remains to be proven than to work to make the web less impactful and more accessible for all.

The metaverse may indeed be designed with an eye to efficiency, or may even follow certain principles of Responsible Digital (though I seriously doubt this). In any case, the very nature of the project suggests that sobriety is not considered. It is all the more regrettable as the Digital Responsible itself contains the elements and principles that would help the achievement and adoption of the metaverse. However, the priorities seem to be different, and we can only regret to see once again the means of concentrating on something that will probably not contribute to making the web better. In the end, the metaverse seems to go against the efforts needed to mitigate climate change.