Category: Digital sobriety

ChangeNOW 2022: Digital Sobriety Ranking of Partner Websites

Reading Time: < 1 minute

On the occasion of the ChangeNOW 2022 event, taking place from May 19 to 21 at the Grand Palais Éphémère in Paris, Greenspector measured the environmental footprint of the websites of the partners of the event.

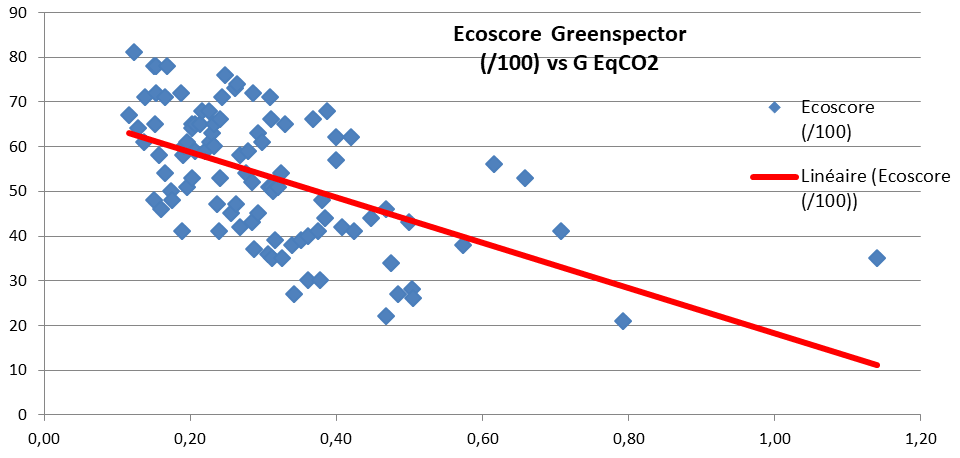
Ranking of the environmental footprint of partners

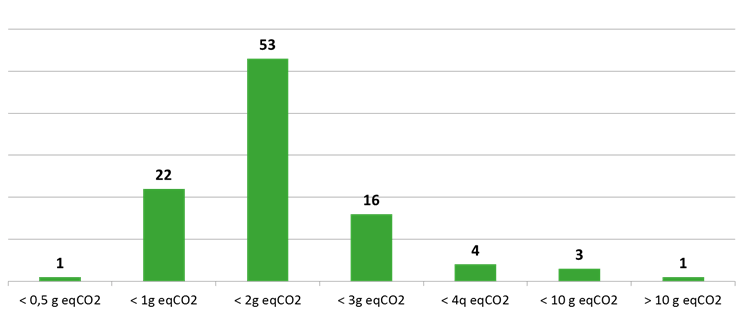
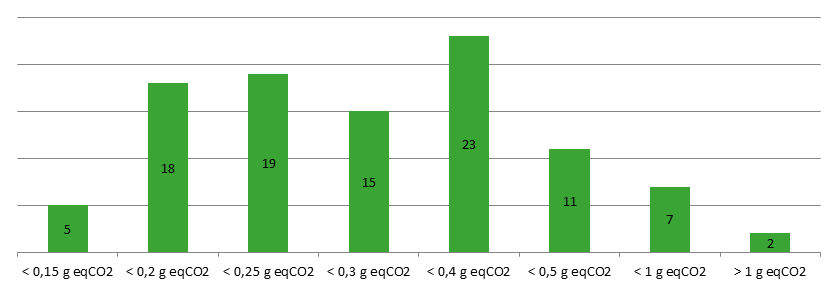
The average carbon impact over one minute of navigation by these 98 partners is 0.50 gEqCO2, or the equivalent of 4.5 meters travelled in a light vehicle. Only 31 websites are above this average, which indicates a good trend. The soberest website in this ranking (the ADEME site, 0.2 gEqCO2) has 8.1 times less impact than the least sober site (heforshe, 1.62 gEqCO2).

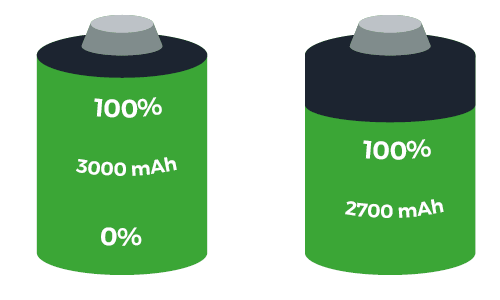
The average power consumption (mAh) is 5.23 mAh, and an average of 8.36 MB of exchanged data. The average of web requests is 78.

RankingNameURLsEcoscoreCarbon Impact (gEqCO2)Energy Consumption (mAh)Exchanged data (Mo)RequestsWater Footprint (Liters)Surface footprint (m²)
1ademehttps://www.ademe.fr/760.23.630.63270.040.41
2ashokahttps://www.ashoka.org/fr-fr660.233.840.95330.040.44
3bsrhttps://www.bsr.org/fr/710.233.61.26400.040.42
4goodtechlabhttps://goodtechlab.io/560.243.090.04770.040.38
5makeFRhttps://make.org/FR700.243.793.28130.040.42
6microsofthttps://www.microsoft.com/560.244.051.08310.040.46
7sustainableventureshttps://www.sustainableventures.co.uk/710.244.141.41300.040.47
8ubuntuhttps://www.ubuntu-fr.org/700.243.582.61260.040.41
9maifhttps://www.maif.fr/690.253.911.54380.040.45
10parisandcohttps://www.parisandco.paris/730.253.582.68320.040.41
11franceinvesthttps://www.franceinvest.eu/660.263.960.82560.040.46
12toniichttps://toniic.com/670.273.891.12560.040.46
13pour un reveil ecologiquehttps://pour-un-reveil-ecologique.org/fr/510.284.222.39400.040.49
14usbeketricaenhttps://usbeketrica.com/en560.285.121.84210.050.57
15grandpalaishttps://www.grandpalais.fr/en710.283.630.92750.040.44
16mjashhttps://www.mjash.fr/710.284.121.08600.040.48
17greentech.earthhttps://www.greentech.earth/570.33.913.49480.040.46
18saint-gobainhttps://www.saint-gobain.com/en610.33.732.25700.040.45
19evpahttps://evpa.eu.com/510.314.232.63580.050.5
20capgeminihttps://www.capgemini.com/670.313.81.97740.050.46
21whocareschronicleshttps://www.whocareschronicles.com/550.314.14.1400.050.47
22changemakerxchangehttps://changemakerxchange.org/360.325.851.82290.060.66
23climateseedhttps://climateseed.com/fr640.323.854.02540.050.45
24halcyonhousehttps://www.halcyonhouse.org/690.323.695.37370.040.43
25fresqueduclimathttps://fresqueduclimat.org/510.3341.55950.050.49
26jokkolabshttps://jokkolabs.net/560.334.042.39790.050.49
27socialnesthttps://socialnest.org/470.334.532.76580.050.53
28leparisienhttps://www.leparisien.fr/530.334.562.17690.050.54
29Moët Hennessyhttps://www.lvmh.com/houses/wines-spirits/600.344.182.02850.050.51
30cleantechopenhttps://www.cleantechopen.org/490.354.394.56490.050.51
31unhcrhttps://www.unhcr.org/260.354.362.72770.050.52
32Bnpparibashttps://group.bnpparibas/en/600.364.282.1950.050.52
33swen-cphttps://www.swen-cp.fr/460.363.954.11770.050.48
34yunusandyouthhttps://yunusandyouth.com/400.364.332.58870.050.52
35lfca.earthhttps://lfca.earth/ALL_fr/570.374.362.97880.050.53
36bcorporationhttps://www.bcorporation.net/en-us/510.375.172.47710.060.61
37unwomenenhttps://www.unwomen.org/en490.374.255.29590.050.5
38bmw-foundationenhttps://bmw-foundation.org/en/470.394.645.38570.050.54
39financefortomorrowhttps://financefortomorrow.com/410.395.293.24690.060.62
40cdp.netenhttps://www.cdp.net/en520.394.765.77510.060.55
41inwinkhttps://www.inwink.com/fr/340.394.993.31770.060.59
42unescohttps://fr.unesco.org/450.44.34.57900.060.52
43rockstarthttps://rockstart.com/350.45.83.74550.060.67
44cartierwomensinitiativehttps://www.cartierwomensinitiative.com/420.45.853.38580.060.67
45mirovahttps://www.mirova.com/fr360.45.871.92840.060.69
46fastforward2030http://fastforward2030.com/420.414.827.56370.060.56
47solarimpulsehttps://solarimpulse.com/480.415.423.33830.060.64
48bridgeforbillionshttps://www.bridgeforbillions.org/50.415.842.6770.060.68
49CNNhttps://edition.cnn.com/440.425.254.13800.060.62
50makesensehttps://makesense.org/490.424.357.31600.060.52
51bcghttps://www.bcg.com/480.424.594.74920.060.56
52kairos-societyhttps://www.kairos-society.eu/370.424.513.441090.060.56
53springwisehttps://www.springwise.com/580.433.937.36810.050.48
54acumenhttps://acumen.org/390.444.943.511090.060.6
55gsgiihttps://gsgii.org/400.444.773.61180.060.59
56gecinahttps://www.gecina.fr/en630.454.099.01600.060.49
57impactfrancehttps://www.impactfrance.eco/360.457.034.47440.070.8
58orangehttps://www.orange.com/fr510.454.592.941400.060.58
59arrowhttps://www.arrow.com/360.465.992.641090.070.72
60socialenterprisehttps://www.socialenterprise.org.uk/280.465.18.69470.060.59
61aiglehttps://www.aigle.com/fr/fr380.475.388.48490.060.63
62kickstarthttps://kickstart.org/410.493.9810.04780.060.49
63paperontherockshttps://paperontherocks.com/430.494.5210.36600.060.54
643dexperiencelabhttps://3dexperiencelab.3ds.com/en/520.54.249.51860.060.52
65citeohttps://www.citeo.com/380.56.874.47820.080.8
66eibenindexhttps://www.eib.org/en/index.htm470.55.384.791230.070.66
67respectoceanhttps://www.respectocean.com/400.54.859.18740.060.58
68unreasonablegrouphttps://unreasonablegroup.com/360.5175.9660.080.81
69euclidnetworkhttps://euclidnetwork.eu/330.535.36.681170.070.65
70Founder Institutehttps://fi.co/410.545.577.671020.070.67
71KPMGhttps://home.kpmg/xx/en/home.html360.546.238.5690.070.73
72time-planethttps://www.time-planet.com/fr260.545.499.02870.070.66
73sweephttps://www.sweep.net/370.558.514.92650.090.97
74onepercentfortheplanethttps://www.onepercentfortheplanet.org/520.564.5412.69750.070.55
75lesechoshttps://www.lesechos.fr/440.587.065.71170.080.84
76phenixcapitalgrouphttps://www.phenixcapitalgroup.com/310.585.4910.21940.070.66
77lacaserneparishttps://www.lacaserneparis.com/420.695.7416.16760.080.69
78startupbootcamphttps://www.startupbootcamp.org/200.695.3316.9770.080.65
79endeavorhttps://endeavor.org/590.74.5620.03630.080.56
80terresdecafehttps://www.terresdecafe.com/en/300.75.917.322120.090.77
81ctofrancehttps://www.ctofrance.com/280.7610.296.091400.111.21
82cereshomepagehttps://ceres.org/homepage550.774.9621.57740.080.61
83The Hoffmann Global Institute for Business and Societyhttps://www.insead.edu/centres/the-hoffmann-global-institute-for-business-and-society330.785.4712.072070.090.73
84Start Up Energy Transitionhttps://www.startup-energy-transition.com/390.78170.93360.151.88
85hello-tomorrowhttps://hello-tomorrow.org/490.824.3924.08910.080.56
86bonduelleenhttps://www.bonduelle.com/en/540.824.5124.95740.080.57
87ship2bhttps://www.ship2b.org/470.825.674.773340.10.81
88ebanhttps://www.eban.org/290.888.3117.931070.110.99
89undphttps://www.undp.org/340.897.5523.86540.10.89
90oneyoungworldhttps://www.oneyoungworld.com/410.924.9129.65630.090.61
91apcoworldwidehttps://apcoworldwide.com/240.987.118.792000.110.91
92sparknewshttps://www.sparknews.com/350.995.9121.042090.110.79
93aptarhttps://www.aptar.com/301.037.4728.63790.110.9
94lafrenchtechhttps://lafrenchtech.com/fr/101.096.9232.9770.110.84
95nordictalkshttps://nordictalks.com/381.095.733.321090.110.73
96keringhttps://www.kering.com/281.1510.2626.971070.141.21
97merciraymondhttps://merciraymond.fr/351.46.4952.19260.130.79
98heforshehttps://www.heforshe.org/fr421.629.0656.94290.161.08

Greenspector has been selected for the third consecutive year by the organization to participate and exhibit at ChangeNOW, the unmissable event and the biggest global event for the planet.

Find us on site in the “Accelerate the Ecosystem” area from May 19 to 21 at the Grand Palais Éphémère in Paris. We will answer all your questions. Do not hesitate to contact us to schedule an appointment!

Each of its websites and applications was measured using our Greenspector Benchmark Runner on an S7 smartphone (Android 8), allowing automated tests to be run.

Scenario details:
– Application loading
– Inactivity website in foreground
– Scroll
– Website inactivity in the background

Each measurement is averaging 5 homogeneous measurements (with a low standard deviation). The consumption measured on a given smartphone on a wifi type network may be different on a laptop PC using a wired network, for example. The cache is first emptied for each iteration.

Find out how Greenspector assesses the environmental footprint of a digital service.

CAPTCHA and digital sobriety

Reading Time: 3 minutes

Security is an essential part of responsible digital. It is not uncommon to wonder how to protect your site, especially when you allow the possibility of sending content from your website: form (in particular contact), comments, etc. We know that a good part of the activity on the web is not due to humans (How much of the internet is fake?). Nobody wants to undergo an injection or other malicious act via their website.

At the end of the 90s, a miracle solution appeared in the form of CAPTCHA. Today, we find this component almost everywhere. You may need to copy difficult-to-read characters, click on photos with different elements, or click on a box to confirm that you are not a robot.

But what about its environmental impact? How to reconcile it with digital sobriety? That’s what we’re going to see here!

Looking for the best solution

The CAPTCHA meets the need to secure the data submitted by Internet users on your site.

The problem is that this way of doing things, among others with reCAPTCHA, is often laborious for users. Additionally, the user journey is longer, which increases the environmental impact of digital services when it does not result in abandonment altogether. Especially for users with disabilities who may find it impossible to complete the task. Not to mention the additional requests (CSS, JS and other iframes) necessary to integrate this type of component into a page.

Thus (and this is an essential point of responsible digital), the search for the soberest CAPTCHA takes accessibility into account first.

The accessibility of CAPTCHAs is a recurring problem, and there are many solutions. The main watchword here is not to use CAPTCHAs. Thus, form security should no longer be the responsibility of users. The subject has been previously discussed, among others at Orange.

There are several possibilities:  

  • Identify the entry time to exclude entries that are too fast
  • Use a filter (regular expression or other) to identify suspicious responses 
  • Randomly add a question that a bot will not necessarily be able to answer (“Which animal is barking?”, “How much is one plus one?”, “How many d’s in pudding?”, etc.). By leaving the possibility of refreshing the question in case of difficulty for the user.
  • The honeypot (to which we will return)

In the end, it is the honeypot solution that seems the most adequate in most cases. Detailed elsewhere on a Canadian government site, it consists of adding a hidden field in the form concerned. This field should be set to be filled out only by bots. It does this by hiding it from users and assistive technologies while giving bots code elements that make them think it’s a required field. This means that when validating the form, responses with this field filled in should not be taken into account. While the honeypot requires some thought for flawless implementation, it remains very light and elegant because it keeps the focus on the original goal: to prevent bots from sending data through a digital service. Rather than impacting the user to ensure that he is not a robot, we leave the user journey intact to focus on bot detection.

Conclusion 

The example of CAPTCHA proves to be representative of a responsible digital approach. In order to improve the security of a digital service, we are first interested in the accessibility of possible solutions (the free and widely used solution not being here again necessarily the best) to finally ensure via digital sobriety that the chosen solution does not degrade the environmental impact of the service.

Digital sobriety for more resilience

Reading Time: 2 minutes

A weak industry

The Covid-19 crisis has made visible weaknesses in the world of digital and electronics: an interdependence of economic and technical systems. The 2020 confinements led to a drastic reduction, or even a halt in the production of electronic circuits in China, impacting worldwide production (Example of the iPhone 13 and its stock shortages).

But the Covid-19 pandemic is not the only cause that has impacted the supply system. At the beginning of 2021, Taiwan was affected by a drought, another important place of production of electronic circuits, and this contributed to reinforcing the shortage already initiated.

Health crises and environmental crises can also be accompanied by geopolitical crises and wars. The war in Ukraine, for example, has lifted one more of the weaknesses in these complex supplies: risk in the production of neon lights, necessary for the manufacture of chips. These neon lights are mostly produced in Ukraine.


Sobriety is one of the resilience solutions

We can expect a resilience solution from the electronics industry through relocations, however, some solutions (relocation of material extraction) are difficult to visualize. In the same way, “digital sovereignty” would not be the solution to this problem, or in any case, it would “only” better deal with the dependency on server hardware.

Sobriety is primarily seen as a way to reduce one’s environmental footprint. It is true, but it also has the advantage (in the context of reducing the environmental impact) of extending the lifespan of equipment, reducing the consumption of resources (CPU for example), optimizing the capacity of the equipment…

Digital services and electronics are becoming more dependent on one another thanks to Sobriety benefits. Making digital soberer would therefore limit the impact of these crises.

Make no mistake

Although much discussed in the digital world, digital sobriety has still not been implemented enough. Its implementation costs are still being discussed, as well as its greater impact on hardware than on its use. It seems that endless debates continue on the network’s impact (focusing on energy and not CO2, disregarding global problems, etc. ). There are as well as counterarguments on whether it is necessary to optimize the CO2 impact of our solutions since we have low-carbon energy in France.

Dismissing the digital sobriety approach on the pretext of its drawbacks means not fully taking into account the place of digital technology in our world. Above all, it means continuing to develop tools that will potentially not work given their lack of resilience.

Allowing the operation of digital services on “low-end” equipment and limited networks is, for example, an approach that goes in the direction of digital sobriety. But this is only the beginning of a real process of sobriety. The road is long, and unfortunately, the crises are already here.

There can be no doubt that sobriety is essential in our young digital world

Optimizing the smartphones energy to reduce the impact of digital technology and avoid the depletion of natural resources

Reading Time: 7 minutes

This article was written in 2021. Since then, our research has led us to revise the environmental impacts mentioned here. For example, we now consider the manufacturing footprint of a smartphone to be 52 kg CO2e. However, the approach presented remains entirely valid.

Introduction

The lifespan of a smartphone averages 33 months. Knowing that a smartphone contains more than 60 materials, including rare earth elements and that its carbon footprint is between 27 and 38 kg eqCO2, the current rate of replacement of smartphones is too fast.

Different reasons can explain this rate of renewal. Loss of autonomy and battery problems are the main reasons (smartphone: one in three changes due to the battery). Increasing the capacity of the batteries is a solution that seems interesting but it would not solve the problem. Indeed, the data exchanged continues to increase and this has an impact on the power of smartphones. Websites are still just as heavy as before, even becoming heavier and heavier… So is this an unsolvable problem? What is the link between the autonomy that we experience in a personal capacity and this observation on the impact of digital technology?

Methodology

We started our analysis through web consumption. Indeed, mobile users spend an average of 4.2 hours per day browsing the web.

In a previous study on the impact of Android web browsers, we measured the consumption of 7 different websites on several web browsing applications from a mid-range smartphone, a Samsung Galaxy S7. This allows us to project this consumption onto global consumption and to apply optimization assumptions to identify room for maneuver.

Even if the uncertainties are high (diversity of mobile, diversity of use, etc.), this action allows us to identify the room for maneuver to improve the life cycle of smartphones. The choice of the Galaxy S7 makes it possible to have a smartphone close (within 1 year) to the average age of global smartphones (18 months).

What is the annual consumption of web browsing on mobile?

Here are our initial assumptions:

The estimated annual consumption of smartphones is 2,774 billion ampere-hours. Not very tangible? Considering that an average 3000mAh battery can go through 500 full charge/discharge cycles before it starts to be unusable and that 1,850 million batteries are used each year to browse the web. Does this figure seem exaggerated to you? There are 5.66 billion smartphones in the world, this would correspond to a problem that would affect 36% of the global fleet each year. If we consider that 39% of users will change their smartphone for battery reasons and only 26% of users will replace the batteries if they wear out, we get the figure of 1,200 million batteries, which corroborates our figures. Not inconsistent at the end, when you look at the phone and battery renewal cycles.

Would reducing the consumption of browsers have an impact?

Web browsers are important engines in the consumption of the web. Our measurements show significant differences in power consumption between browsers. These differences are explained by heterogeneous implementations and performance. In the following graph, the consumption of browsing on 7 sites, including the launch of the browser, the use of features such as writing URLs, and the navigation itself is visualized.

We start with a hypothesis of publishers optimizing browsers. By considering a hypothetical consumption of all browsers equal to that of the soberest (Firefox Focus), we obtain a reduction in the total annual consumption which makes it possible, with the same assumptions on the lifespan, to save 400 million batteries per year. Knowing that 1,500 million smartphones are sold per year, taking the same assumptions as before on replacement and repair rates, this would save 7% of the fleet of phones sold each year.

Would reducing the consumption of sites have an impact?

It is also possible that the websites are much soberer. We have assumed a consumption close to that of Wikipedia. From our point of view, having audited and measured many sites is possible but by taking important actions: optimization of functionalities, reduction of advertising and tracking, technical optimization …  

Here is an example of the representation of the energy consumption of the Team website. We see that the load will consume up to 3 times the reference consumption. The optimization margin is enormous in this precise case, knowing that many sites arrive at a factor of less than x2.

In the case of sober websites, by taking the same assumptions and calculation methods as for the sobriety of browsers, we could save 294 million batteries per year, or reduce the renewal of the fleet annually by 5%.

Is reducing the consumption of the OS possible and would have an impact? 

The question about the impact of hardware and OS often arises. To take this impact into account, we have several data at our disposal. An important piece of data is the benchmark consumption of the smartphone. It is the consumption of the hardware and the OS. For the Galaxy S7, this consumption is 50µAh / s.

By taking the same assumptions as those taken to calculate the total consumption (2,774 billion Ah), the annual consumption attributed to the material and OS share would be 1,268 billion ampere-hours or 45% of the total consumption. 

So is this the glass tray of optimization? Not really because there is a lot of space for optimization: Android itself for example. We have carried out an experiment that shows that it is possible to significantly reduce the consumption of Android functionalities. The builders’ overlays are also a way to reduce consumption.

Based on our experience, we estimate that a 5% reduction in consumption is totally possible. This would save 350 million batteries or 6% of the fleet.

What environmental gains can we hope for?

Applying digital sobriety at different levels would reduce the global number of used batteries per year by more than half. 

Even on the assumption that users do not systematically renew their smartphones for reasons of loss of autonomy or only replace their used battery, the annual smartphone renewal could be reduced by 17%.

In the best-case scenario, assuming that most users will replace their batteries, the potential savings would be 2 million TCO2eq. But the gains could be much greater if you consider that replacement practices are not changing fast enough and that users are changing smartphones rather than batteries: 47 million TeqCO2.

By being optimistic about an increase in battery capacity, no increase in the impact of software, and an unincreased impact of the larger batteries, the number of batteries used could be halved, in the same way, the environmental impact by two. But is it still enough? Rather go for an increase in the capacity of the batteries and a decrease in energy consumption and then obtain a gain of 4 on the impact by multiplying the capacity by two! 

Energy on a smartphone, small drops but a huge impact in the end

We are under the impression that the energy is unlimited, we just need to charge our smartphone. However, even if the energy was unlimited and without impact, the batteries are consumables. The more we use them, the more we wear them out, and the more we use non-renewable resources such as rare earth elements, not to mention other environmental, social, and geopolitical costs. We can expect technological developments to improve capacity and improve battery replaceability, but the savings are huge. Replacing the batteries is not the miracle solution because even if we extend the life of the smartphone, the battery must be thrown away or recycled, and recycling of Lithium is not yet assured (P.57). Gigantic because we use our smartphones for many hours. Gigantic because we are billions of users.

The exercise that we have carried out is totally forward-looking; all browser editors should integrate sobriety, all sites be eco-designed. It does show, however, that optimizing the energy of apps and websites makes sense in the digital environmental footprint. Some people seeing only the energy of recharging neglect this aspect. However, as we can see in this projection, the environmental gains are much greater.

This figure is significant and at the same time low: 47 million Teq CO2 for the world, this is 6% of the French footprint. However, CO2 is not the only metric to look at. Another significant problem, for example, the shortage of lithium in 2025 but also water.

To all this, we should add issues associated with new practices and new materials:

… the sector is constantly evolving to respond to challenges that are sometimes commercial, sometimes economic, sometimes regulatory. The battery example illustrates this trend well. While we had become familiar with the “classic” lithium-ion batteries which mainly contain lithium, carbon, fluorine, phosphorus, cobalt, manganese, and aluminum, new models have appeared, first lithium-ion-polymer batteries then lithium-metal-polymer batteries. The possible metal procession, already substantial, has therefore been considerably increased; with iron, vanadium, manganese, nickel but also rare earth elements (cerium, lanthanum, neodymium, and praseodymium).

SystExt Association (Extractive Systems and Environments)  https://www.systext.org/node/968 

Taking into account the environmental, social, and geopolitical issues involved with batteries, dividing the number of batteries used by 2 is really not enough! This means that the optimization wells should now be activated. And if we want to achieve ambitious goals, all players, manufacturers, OS and browser editors, digital players … have their share of the work. Continue to incant magical reductions resulting from technologies, to say that energy should not be optimized, to transfer the fault to other actors or other sectors, to explain that focusing on uses is a mistake … that shift the problem. We all need to roll up our sleeves and solve the problem now!


What resources should be reduced in the context of good software eco-design practices: Processing on the server-side or on the user side?

Reading Time: 2 minutes

One of the first answers to the question “what resources” is: all! But it is necessary to have a more specific answer because certain practices will favor an economy on the server-side, others on the memory side rather than the CPU. There are winning optimizations for all areas but unfortunately, the behavior of computer systems is more capricious!

The guiding principle is to extend the life of the hardware, whether for the terminal or for the servers. We will see that for environmental gains, reducing energy will also be an improvement axis.

In a previous article, we discussed the need for energy optimization in the case of mobile devices. Today we are trying to answer the question: what architecture to put in place, and in particular to put processing on the user side or on the server-side? 

The answer is: server-side processing to be preferred …

The answer is quite simple: let’s load the servers! Indeed, when we take LCA and impact analyzes, we observe a much stronger impact on the user side (Example with our study on the impact of playing a video). The servers are shared and are optimized to absorb a load. The manager can also manage load fluctuations with Power Capping (peak load absorption while maintaining controlled energy consumption). The lifespan of the servers can also be managed (hardware that can last up to 10 years). Compliance with a Green IT policy can also be better monitored and shared.

Terminals, on the other hand, despite having powerful processors, do not have these advantages. Very little control of the lifespan, no management of the health of the system, fragmentation of powers and therefore of behavior …

… but watch out for resources and scalability

While it is better to put the computations on the server-side, this is no excuse for not maximizing the impact on the server-side. Scalability is possible but must be monitored. Because adding a virtual instance will have an impact on the future need to add a physical machine and therefore will increase the environmental impact.

In addition, limiting power consumption will be necessary because a high demand for power will transfer into an increase in the power consumed on the server rack and higher cooling needs.

And the cost of the round trips of the network round trips in this case?

The question appears on network exchanges if we move calculations to the server-side. This is currently a false problem because there is too much exchange. The network resource and servers being seen as “free” and the architectures going more and more towards the service/microservice, the processing on the user side calls too much the data centers. It will be necessary rather control the number of network exchanges, whatever the choice of architecture.

Is this currently the case in architectural practices?

This has not been the trend in recent years. Indeed, the arrival of powerful user platforms, i.e. with multicore processors and high-performance network connections, have pushed a lot of processing to the user side. Development Frameworks, especially JavaScript Frameworks, made this possible.

However, the trend is starting to reverse. We can notably mention Server-Side Rendering (SSR) with for example next.js or the generation of static blogs with Hugo. We can also see techniques maximizing the use of elements already present on the user’s terminal such as the web browser engine by using CSS rather than JS.

We will try to answer in the next articles: which resources (CPU, memory …) should we optimize as a priority?

Users smartphones: all about the environmental impact and battery wear

Reading Time: 4 minutes

User terminals: the high environmental impact of the manufacturing phase

User terminals are now the biggest contributors to the environmental impact of digital technology and this phenomenon is set to increase. This trend is mainly explained by the increasingly important equipment of households with smartphones, by a reduced lifespan of this equipment, and by the fact that it has a significant environmental impact. An impact mainly due to the smartphone manufacturing phase. The Ericson brand announces, for instance, an impact in use (i.e. linked to recharging the smartphone battery with energy) of 7 kg eqCO2 out of a total impact of 57 kg eqCO2, or only 12% of the total impact. The total impact takes into account the different phases of the smartphone life cycle: manufacture, distribution, use, treatment of the smartphone at the end of its life.

Hence the interest that manufacturers work on this embodied energy by eco-designing but also by improving the possibility of increasing the life of the equipment through repairability but also durability.

Regarding all these observations, it could seem unproductive from an environmental point of view to reduce the energy consumption of smartphones. In any case, the simplistic approach would be to put that impact aside. But the reality is quite different and the electrical flows that are involved in the use of mobile devices are much more complex than one might think.

Explanation of battery operation

Current smartphones are powered by batteries with Lithium-ion technology. On average, the capacities of the batteries on the market are 3000 mAh. The trend is to increase this capacity. The battery can be thought of as consumable, just like a printer cartridge. It wears out over time and the original capacity you had when you bought the smartphone is no longer fully available. That is, the 100% indicated by the phone no longer corresponds to 3000 mAh but to a lower capacity. And this initial capacity cannot then be recovered.

Battery wear is primarily created by a full charge and discharge cycles. A recharge/discharge cycle corresponds to an empty battery that would be recharged to 100%. I leave home in the morning with a phone 100% charged, the battery drains, I charge my phone 100% in the evening. A complete cycle in one day therefore!

If you charge your phone more often, you can cycle more (several incomplete cycles are ultimately equivalent to one complete cycle).

The more the number of cycles increases, the more the remaining capacity decreases. This wear leads to the end of battery life. Current technologies allow up to 500 cycles.

At the end of the cycle, the battery capacity is only 70% of the initial capacity. Beyond this annoying loss of autonomy, the battery suffers from certain anomalies, such as a rapid drop from a battery level from 10% to 0%.

Note that this effect will be reinforced by the intensity of the battery discharge: if the phone consumes a lot (for example during video playback), then the battery wear will be greater.

Impact on obsolescence

The loss of autonomy is a cause of renewal by users: 39% in 2018. This phenomenon is reinforced by the fact that the batteries are increasingly non-removable, which leads to a complete replacement of the smartphone by the user. In addition, even if the decrease in autonomy is not the only replacement criterion, it will be added to the other causes to create a set of signs indicating to the user that he must change his smartphone (marketing effect, power, new features…).

We can therefore easily make the link between the mAh consumed by the applications and the kg of CO2 due to the production of CO2. By reducing these mAhs, we would greatly reduce the wear of the battery, the life of smartphones would be extended on average and therefore the initial CO2 cost would be more profitable. The smartphone mAh has a much greater cost on the embodied energy of the smartphone (manufacture) than on the impact of energy to recharge it.

For example, for a classic smartphone, we have 0.22 mgCo2 / mAh for the recharged energy compared to 14mgCo2 / mAh.

Technological solution

Solving this problem can always be seen through the technological axis: increase in capacities, fast loading … If we take the case of fast loading, this will not change the problem, on the contrary, it will worsen its potentially increasing cycles. It is not by increasing the fuel tank of cars that we will reduce the impact of the automobile. Improving battery technology is beneficial, however, reducing the consumption of smartphones would be even more beneficial for the environment and the user.

Note that the CO2 impact is not only to be taken, indeed the manufacture of batteries is overall very expensive in environmental and social terms. Not to mention strategic resources with geopolitical impacts such as cobalt or lithium. Extending battery life is critical.

Digital sobriety everywhere, digital sobriety nowhere? 7 mistakes to avoid!

Reading Time: 4 minutes

Everyone is talking about digital sobriety. From web agencies to politicians, including ESNs, all communicate on the subject, on the explanation of the impact, on good practices, on the willingness to go there. But what is it really?

We have been working on the subject within Greenspector for 10 years and we can in all modesty give our opinion on the real situation of the actors and especially on the barriers that will have to be overcome to really do eco-design and sobriety.

We have educated developers, students, and leaders. We have supported teams, applied good practices. We measured apps and websites. It took motivation to stay in the race. Because the context is different, and we are happy to see so much communication and actors involved. However, we believe that all is not won! Here are some tips and analyzes from veterans in the field, grouped into 7 mistakes to avoid!

Associate digital sobriety only with a department

In many actions that we have carried out, an important component was necessary: the consideration of the problem at all stages. Developer, Designer, Product Owner, decision-maker. And Customer… Without it, the project will not get far. An unfunded project, optimization research needs not wanted by the devs, technical improvements not accepted by the Product Owners … At best, the improvements will be made but with only a few little gains.

The solution is to engage in a shared approach. It takes a little longer (and more!) But allows the project to be understood by all and accepted.

Focus only on coding practices

The miracle solution when you think of digital sobriety is to tell yourself that if the developers respect good practices, everything will be fine. We can talk about it. We started an R&D project (Green Code) more than 8 years ago on this axis. It was necessary but not sufficient. Indeed, it is also necessary to work on the functionalities, the design, the contents, the infrastructure…

The establishment of a repository will be an important axis but more initially to initiate an awareness process. It is important not to say to yourself that it will be necessary to apply 115 best practices on almost all of a site because the effort will be enormous and the results will not necessarily be there.

Do not use professional tools

Many tools have emerged to evaluate websites. Indeed, it is quite simple on the web to monitor some technical metrics such as the size of the data exchanged on the network or the size of the DOM and to model an environmental impact. This is great for raising awareness and for identifying sites that are far too heavy. On the other hand, the system on which the software works is not so simple and the impact can come from many more elements: A JS script that consumes, an animation…

Taking action with this type of tool makes it possible to start the process but to say that the software is sober because we have reduced the data size and the size of the DOM is at the limit of greenwashing.

We are not saying this because we are publishers but because we are convinced that it is necessary to professionalize actions.

Fighting over definitions and principles

We have lived it! We have been criticized for our approach to energy. The birth of a domain leads to the establishment of new principles, new domains, new definitions … This is normal and often requires long discussions. But do we really have time to debate? Are they necessary when there is agreement that we all need to reduce the impact of our activities? The complexity of digital and obesity is there and can be felt at all levels. It is time to improve our practices overall, all wishes are good, all areas need to be explored.

Look for heavy consumers

The findings on the impact of digital technology are increasingly shared. However, teams may be led to look for excuses or responsible and not make corrections that seem more minor. Why optimize your solution when bitcoin is a consumption abyss? Why reduce the impact of the front when the publishers of libraries do nothing? Prioritization is important but it is often a bad excuse not to seek gains in your field.

ALL the solutions are way too heavy. So everyone is stuck on slowness. Everything is uniformly slow. We stick to that and all is well. Being efficient today means achieving a user experience that corresponds to this uniform slowness. We prune things that might be too visible. A page that has had more than 20 seconds to load is too slow. On the other hand, 3 seconds, … is good. 3 seconds? With the multicore of our phones / PCs and data centers all over the world, all connected by great communication technologies (4G, fiber …), it’s a bit weird, isn’t it? If you look at the debauchery of resources for the result, 3 seconds is huge. Especially since the bits circulate in our processors in nanosecond-level units of time. So yes, everything is evenly lent. And it suits everyone (at least, on the surface: The software world is destroying itself, manifesting for more sustainable development.)

Now let’s start optimizations by not looking for culprits!

Think only about technological evolution 

We are technicians, we are looking for technical solutions to solve our problems. And therefore in the digital field, we are looking for new practices, new frameworks. And the new frameworks are full of performance promises, we believe them! On the other hand, it is an arms race that costs us resources. This development is surely necessary in certain cases but it is not necessary to focus only on this. We must also invest in cross-cutting areas: accessibility, testing, sobriety, quality … And on the human because it is the teams who will find the solutions for sober digital services.

Do not invest 

Goodwill and awareness are necessary, on the other hand, we must finance change. Because digital sobriety is a change. Our organizations, our tools are not natively made for sobriety. Otherwise, we would not currently have this observation on the impact of digital. It is, therefore, necessary to invest a minimum to train people, to equip themselves, to provide time for the teams in the field. Just doing a webinar and training is not enough!

Let us have commitments related to the issue and the impacts of digital technology on the environment!

The main figures of the carbon impact of e-commerce in France

Reading Time: 6 minutes

E-commerce sites are high traffic sites (11 million per month) and therefore have an impact reinforced by the volume of use and significant time of use (visit> 5 minutes). In addition, driven by strong growth in e-commerce, longer journey times and more and more mobility, oversized infrastructures to ensure a good level of response time, the e-commerce site makes an ideal candidate for a Carbon assessment of a digital service with environmental responsibility associated with mass services.

Methodology

The assessment scope is based on the impact of the 100 most visited sites in France over the second half of 2019. It is therefore not exhaustive since the calculations do not take into account all the e-commerce sites with lower traffic.

How to assess the Carbon Impact of an e-commerce site?

To know the Carbon impact of an e-commerce web service, we worked on a simplified method based on real measurements.


On the Datacenter and Network side, we project the Carbon Impact from the consumption of data exchanged with the device (OneByte method of the ShiftProject).

On the User device, a real measurement on a mid-range Android smartphone equipped with a Chrome browser is launched 3 times and averaged before being projected with a Carbon impact factor taking into account the following assumptions: WiFi mix – GPS network, 50% brightness, phone battery wear at 500 full charge/discharge cycles.

The average impact of a course (= 1 visit)

The visit, on average of 5 minutes and 28 seconds on an e-commerce website in France on a smartphone device, has a carbon impact of 2 gCO2eq equivalent to 18 meters traveled by a light vehicle. Or 56 visits to an average e-commerce site impact 1 km driven with an average light vehicle.

The distribution of the sites is fairly homogeneous between 0.5 and 3 grams with some extreme values. Nevertheless, there are large differences: from 0.5 g to 34 g EqCO2, -> ie a ratio of X68 between the 100 Top E-Commerce sites in France. These differences can be qualified by taking into account that the visit time varies by a factor of 5 (from 3 to 15 minutes).

When we project the impacts on monthly visits, an e-commerce website has an average carbon impact of 23.8 Tons CO2eq/month.

The sum of the impacts of the top 100 e-commerce sites is 2380 Tons EqCO2/month, the equivalent of the impact of 21 million km of an average car in France or 531 rounds of the Earth by car or 19,636 average vehicles circulating in France corresponding to the fleet of an agglomeration of 40,000 inhabitants.

Projected over one year, it is 28.6 MegaTons Eq CO2!

Average impact of a page

In order to compare e-commerce sites with each other, the visit time or the number of steps or page views during the visit must be isolated. To do this, we go back to the basic measurement of a page for 1 minute.

A page from an e-commerce website in France has an average impact of 0.36 g CO2 eq.

In simple projection: 1,000 pages viewed for 1 minute on an average smartphone have an average carbon impact equivalent to 3.2 km from a light vehicle. The detailed ranking of the Top 100 e-commerce websites is available here. It will be likely to vary during future updates or request for re-measurement.

Breakdown of sites visited

Large difference: from 0.5 g to 34 g EqCO2, i.e. a ratio of X 68 between the 100 top e-commerce sites in France.

To explain this significant variation in impact, we can note that:

  • The data consumption ranges from 0.6 MB to 55 MB, or a ratio of X 92, this is the most discriminating factor explaining the differences in impact.
  • the energy consumption on the mobile device varies by a factor of 4.7

It is the network part that has the most impact with a share of 69% of the average impact of an e-commerce site on mobile.

If the mobile were replaced by a PC with a wired connection, the “User workstation” part would be much more important. This distribution of impact of course varies with the e-commerce site.

Low impact website case


Compliance with best practices on the network and low consumption on the device

Eco score Greenspector: 81/100, best Eco score of the Top 100 E-Commerce

Equivalent of 161,675 km of a light vehicle for 24.5 million visits / month (Source: Similarweb S2 2019)

Heavy impact website case

No respect for best practices on the network and high consumption on the device

Eco score Greenspector: 21/100, the lowest Eco score of the Top 100 E-Commerce

Equivalent to 44,582 km of a light vehicle for 2.1 million visits/month.

More impactful categories of sites than others?

A ratio of 1 to 3 on the impacts per page between categories

We have about 3 times more carbon impact by browsing a fashion e-commerce site than on an Automotive or Leisure site.

Rq: a single site classified in the Good Plans category

Projected earnings:

If all the sites were aligned with the most virtuous site in our measurements, we could save over a full year:

  • 15,177 tonnes of CO2eq, more than half of the impacts
  • Or 53% reduction in carbon impact
  • The equivalent of 4050 rounds of the earth by car

The major levers for improvement:

E-commerce websites can reduce network volume

  • Adapt content to device / type of connection & connection quality
  • Compression of rich content
  • User cache to avoid content already loaded on a previous visit
  • Limit the number of requests (internal, advertising, external services, etc.)
  • Beware of unsuitable pre-loads

E-commerce sites that can reduce their energy and battery consumption

  • Allow rapid interaction
  • Reduction in the consumption of scripts in the pages (3D animation, graphic animation, etc.)
  • Reduction of trackers / monitoring
  • External services to be evaluated / optimized
  • Reduced travel time
  • A design / graphics / color to optimize

Correlation analysis of carbon data

Correlation analysis between carbon impact and display performance

By taking 20 values from our sample for which we collected performance data, we can validate that there is no correlation between Carbon impacts and Display performance.

The 2 best performing sites are nevertheless also the least impactful sites

The Carbon indicator is an indicator in its own right for the management of an e-commerce website

Correlation analysis between Impact Carbone and Eco score Greenspector

The estimated Carbon indicator does not take into account other parameters, such as memory consumption, CPU, number of requests, or compliance with good practices, etc.
The Eco score includes both the consumption of resources/energy but also a note on compliance with good practices.

There is a “satisfactory” correlation between the estimated Carbon impact and the measured Ecoscore Greenspector.

Please note, the Carbon indicator does not cover all environmental indicators.

The carbon impact of the Top 100 E-Commerce websites

Reading Time: < 1 minute

Sales made on e-commerce sites are increasing each year, more and more on the go or from a smartphone at home. We have never consumed so much through these web platforms as we do today. A debate persists between the ecological impact of e-commerce in terms of logistics compared to a purchase made in-store. It all depends on certain parameters (delivery time, geographic location of the store, logistical means used, etc.). In addition to this logistical question, there is the environmental impact of digital technology for e-commerce purchases. How can we estimate the part that these online purchases represent in terms of the environmental impact of our life as consumers?

To answer this question on e-commerce in France, we took as a basis the ranking of the largest e-commerce sites in France (Top 100 E-Commerce: E-Commerce Nation & SimilarWeb study) and we add to your asks other sites. We measure the consumption of energy and resources on a mid-range smartphone which allows us to assess the carbon impacts on the entire chain: device (Greenspector methodology), network, and datacenter (OneByte method of the ShiftProject). This evaluation is done on the basis of the home page of the e-commerce site and on the basis of a 1-minute protocol. The Greenspector eco score completes the assessment of the site both by respecting good practices but also by measuring other metrics of resources not assessed in the Carbon impact.

Ranking of the carbon impact of the Top 100 E-commerce websites

PositionWebsiteTotal gEqCO2 per page/minuteEcoscore
(/100)
Measurement date
1https://fr.hotels.com/0.116713-03-2020
2https://www.leroymerlin.fr/0.128113-03-2020
3https://www.microsoft.com/fr-fr0.126413-03-2020
4https://www.naturabuy.fr/0.136113-03-2020
5https://www.airfrance.fr/0.137113-03-2020
6https://www.decathlon.fr/0.154813-03-2020
7https://www.veepee.fr0.157813-03-2020
8https://www.norauto.fr/0.156513-03-2020
9https://www.galerieslafayette.com/0.157213-03-2020
10https://www.rueducommerce.fr/0.157813-03-2020
11https://www.thomann.de/fr/index.html0.155813-03-2020
12https://www.zalando-prive.fr/0.164613-03-2020
13https://www.showroomprive.com/0.167113-03-2020
14https://www.groupon.fr/0.165413-03-2020
15https://www.laredoute.fr/0.167813-03-2020
16https://www.oscaro.com/0.175013-03-2020
17https://www.leclercdrive.fr/0.174813-03-2020
18https://www.cultura.com/0.187213-03-2020
19https://www.booking.com/0.184113-03-2020
20https://www.darty.com/0.195813-03-2020
21https://www.ticketmaster.fr/0.196013-03-2020
22https://www.fnac.com/0.195113-03-2020
23https://www.kiabi.com/0.196113-03-2020
24https://www.brandalley.fr/0.206513-03-2020
25https://www.voyage-prive.com0.206413-03-2020
26https://www.gemo.fr/0.205313-03-2020
27https://www.trainline.fr/0.205913-03-2020
28https://www.etsy.com/fr/0.206513-03-2020
29https://www.expedia.fr/0.216513-03-2020
30https://www.manomano.fr/0.216813-03-2020
31https://www.aliexpress.com/0.225913-03-2020
32https://www.leboncoin.fr/0.226813-03-2020
33https://www.ugc.fr/0.226113-03-2020
34https://www.fnacspectacles.com/0.226313-03-2020
35https://www.ryanair.com/fr/fr/0.236013-03-2020
36https://www.feuvert.fr/0.236513-03-2020
37https://www.but.fr/0.234713-03-2020
38https://www.sephora.fr/0.234113-03-2020
39https://fr.bazarchic.com/0.246613-03-2020
40https://www.bricodepot.fr/0.245313-03-2020
41https://all.accor.com/france/index.fr.shtml0.247113-03-2020
42https://www.intermarche.com/0.247613-03-2020
43https://www.boulanger.com/0.254513-03-2020
44https://www.apple.com/fr/0.267313-03-2020
45https://www.fr.lastminute.com/0.264713-03-2020
46https://www.intersport.fr/0.267413-03-2020
47https://fr.gearbest.com/0.264213-03-2020
48https://www.promod.fr/0.265813-03-2020
49https://www.etam.com/0.275413-03-2020
50https://www.blancheporte.fr/0.275913-03-2020
51https://www.asos.fr/0.285213-03-2020
52https://www.zalando.fr/0.284313-03-2020
53https://www.materiel.net/0.287213-03-2020
54https://www.alibaba.com/0.283713-03-2020
55https://www.bricoprive.com/0.294513-03-2020
56https://www.leclercvoyages.com/0.296313-03-2020
57https://www.bonprix.fr/0.296113-03-2020
58https://www.vertbaudet.fr/0.303613-03-2020
59https://www.cdiscount.com/0.305113-03-2020
60https://www.cinemaspathegaumont.com/0.317113-03-2020
61https://www.auchan.fr/0.316613-03-2020
62https://www.ebay.fr/0.315113-03-2020
63https://www.yves-rocher.fr0.313513-03-2020
64https://www.ldlc.com/0.315013-03-2020
65https://fr.shein.com/0.313913-03-2020
66https://www.just-eat.fr/0.325113-03-2020
67https://www.lahalle.com/0.325413-03-2020
68https://www.carrefour.fr/0.323513-03-2020
69https://www.spartoo.com/0.336513-03-2020
70https://www.zooplus.fr/0.343813-03-2020
71https://www.digitick.com/0.342713-03-2020
72https://www.maisonsdumonde.com/FR/fr0.353913-03-2020
73https://www.camaieu.fr/0.363013-03-2020
74https://www.ubaldi.com/accueil/0.364013-03-2020
75https://www2.hm.com/fr_fr/index.html0.366613-03-2020
76https://www.oui.sncf/0.374113-03-2020
77https://www.electrodepot.fr/0.373013-03-2020
78https://www.easyjet.com/fr0.384813-03-2020
79https://www.privatesportshop.fr/0.384413-03-2020
80https://www.sarenza.com/0.386813-03-2020
81https://www.vinted.fr/0.406213-03-2020
82https://www.castorama.fr/0.405713-03-2020
83https://www.instant-gaming.com/fr/0.404213-03-2020
84https://www.ouigo.com/0.426213-03-2020
85https://www.nocibe.fr/0.424113-03-2020
86https://www.amazon.fr/0.444413-03-2020
87https://www.samsung.com/fr/0.462213-03-2020
88https://www.aroma-zone.com/0.464613-03-2020
89https://www.ikea.com/fr/fr/0.473413-03-2020
90https://www.nike.com/fr/0.482713-03-2020
91https://www.conforama.fr/0.494313-03-2020
92https://www.opodo.fr/0.502813-03-2020
93https://fr.shopping.rakuten.com/0.502613-03-2020
94https://www.gifi.fr/0.573813-03-2020
95https://www.airbnb.fr/0.615613-03-2020
96https://www.adidas.fr/0.655313-03-2020
97https://www.backmarket.fr/0.704113-03-2020
98https://www.micromania.fr/0.792113-03-2020
99https://www.wish.com/1.143513-03-2020
100https://www.zara.com/fr/5.713413-03-2020

Your e-commerce website is not in this ranking, contact-us to take a measurement and appear in this ranking!

The Top 10 myths of frugal ICT

Reading Time: 5 minutes

I have been working for more than 8 years in GreenIT and I have seen lately that several studies and initiatives have started. This is a very positive sign and shows that there is a real dynamic to change the impact of ICT. All actions, whether small scale, as a simple awareness, or on a larger scale such as the optimization of a website with millions of visitors, is good to take into account the climate emergency.

However it’s important to avoid any greenwashing phenomenon and to understand the impact of the good practices mentioned (are they really all green?)

Myth 1 – A powerful software is a simple software.

False

A powerful software is a software that will be displayed quickly. This gives no information on its sobriety. On the contrary, it’s possible that practices are put in place for a quick display and that they go against the sobriety. As for example put the loading of the scripts after the display of the page. The page will be displayed quickly but many processes will run in the background and will have an impact on resource consumption.

Myth 2 – Optimize the size of queries and the weight of the page, this makes the software more frugal.

True and false

True because actually fewer resources will be used on the network and servers. Which means less environmental impact. It goes in the right direction.

False because the evaluation of a simple software will not only be based on this type of technical metrics. Indeed, it is possible that certain elements have an equally important impact. A carousel on a home page could for example be quite light in terms of weight and requests (for an optimized carousel) but in any case will have a strong impact in user-side resource consumption (CPU consumption, graphics … ).

Myth 3 – Automatic control via tools allows me to be green

True and false

True because it is important to measure the elements. This will allow to know objectively where we are, and to improve.

False because the evaluation will be done on technical elements. There is a bias: we only measure what we can automate. This is the criticism that can be made for example on Lighthouse (accessible tool in Chrome) on the accessibility. We can make a totally inaccessible site by having a score of 100. This is the same criticism that we can have about the tools that are used in ecodesign. For example the website http://www.ecoindex.fr/ is an interesting tool to initiate the process, however the calculation of this tool is based on 3 technical elements: the size of the page, the number of request and the size DOM. These are important elements in the impact of the page, however several other elements can be impacting: CPU processing from script, graphic processing, more or less good solicitation of the radio cell … All elements that can create false positives.

A measurement software will be complementary 😉

Myth 4 – My software uses open-source and free code, so I’m green

False

Free software is a software in its own right. He suffers the same obesity as other software. He will therefore potentially be a consumer. On the other hand, free software has a stronger capacity to integrate good efficiency practices. Still need to implement or at least begin to evaluate the impact of its solution …

Myth 5 – The impact is more on the datacenter, on the features, on that …

True and false

Any software is different, by its architecture, its use, its implementation, its functions … no serious study can certify a generality on a domain that would have more impact than another. In some cases, the impact will be more on the datacenter (for example on calculation software) but in other cases it will be on the user side (for example mobile applications). In the same way, some software will be obese because of their multiple functionalities whereas others will be because of a bad coding or an external library too heavy.

Myth 6 – Ecodesign requires a structured and holistic approach

True and false

True because indeed it’s necessary to involve all the actors of the companies (developer but also Product Owner, Business Department) and to have a coherent strategy.

However, starting process and product improvement through unit and isolated actions is very positive. The heaviness of the software is indeed in a state where any isolated positive action is good to take.

Both approaches are complementary. Avoiding the application of certain practices while waiting for a structured approach (which can be cumbersome) would be dangerous for the optimization and competitiveness of your software.

Myth 7 – The green coding does not exist, the optimization is premature …

False

This is an argument that has existed since the dawn of time (software). Code implemented, legacy code, libraries … optimization tracks are numerous. My various audits and team accompaniments showed me that optimization is possible and the gains are significant. To believe otherwise would be a mistake. And beyond optimization, learning to code more green is a learning approach that is useful to all developers.

Myth 8 – My organization is certified green (ISO, ICT responsible, Lucie …), so my product is green.

False

All its certifications will effectively ensure that you are on the right track to produce more respectful software. Far be it from me to say that they aren’t useful. However, it must not be forgotten that these are organization-oriented certifications. In a structured industry (like agriculture, a factory …) the company’s deliverables are very aligned to the process. Certifying an AB farm will ensure that the product is AB good.

However in the mode of the software it is not so simple, the quality of the deliverables is indeed very fluctuating, even if one sets up a process of control. In addition, an organization potentially consists of a multitude of teams that are not going to have the same practices.

It’s therefore necessary to control the qualities of software products and this continuously. This is an approach that will be complementary to the certification but mandatory. Otherwise we risk discrediting the label (see going to greenwashing).

Myth 9 – Optimizing energy is useless, it’s the equivalent CO2 that is important to treat

False

The ecodesign work is mainly based on the reduction of equivalent CO2 (as well as other indicators such as eutrophication …) over the entire life cycle of the ICT service. It’s therefore important to take into account this metric. Without this, we risk missing the impacts of IT. However, on the same idea as points 5 to 7, no optimization is to be discarded. Indeed, it is necessary to understand where the impacts of the software are located. However, the integration of the energy problem in teams is urgent. Indeed, in some cases the consumption of energy in the use phase is only part of the impact (compared to gray energy for example). However in many cases, high energy consumption is a symptom of obesity. In addition, in the case of software running in mobility (mobile application, IoT) energy consumption will have a direct impact on the renewal of the devices (via the wear of the battery).

Myth 10 – I compensate so I’m green

False

It’s possible to offset its impact through different programs (financing of an alternative energy source, reforestation …). It’s a very good action. However, it is a complementary action to an ecodesign process. It is indeed important to sequence the actions: I optimize what I can and I compensate what remains.

Conclusion

The frugal ICT is simple because it’s common sense. However, given the diversity of the software world, the findings and good practices aren’t so simple. However, the good news is that, given the general cumbersome software and the delay in optimization, any action that will be taken will be positive. So don’t worry, start the process, it’s just necessary to be aware of some pitfalls. Be critical, evaluate yourself, measure your software!