Category: Technical Zone

What impact does the network have on digital services?

Reading Time: 8 minutes

According to the ADEME/Arcep study for 2022, the network in France is responsible for between 2% and 14% of the impact of digital technology. Fixed networks generate more impact than mobile networks (between 75% and 90%). However, given the greater use of fixed networks, the unit impact (per user or per GB of data exchanged, for example) is lower for the fixed network.

This observation has led to a number of recommendations encouraging the use of fixed networks rather than mobile networks. For example, here are ADEME’s recommendations for teleworking:

“8. Using WiFi rather than 4G on mobile phones

On your mobile phone, it’s best to use WiFi when you’re working at home. It puts less strain on the network than 4G. You can also use the wired network to connect your computer to your box.

This impact of the network is even reflected in the AGEC law. Communication operators are required to display the CO2 cost associated with user consumption.

Network evaluation for digital services

When it comes to assessing the impact of a digital service, the network must be taken into account. The commonly used approach is to use the intensity in gEqCo2/Gb. This assumes linearity between the CO2 impact and the data exchanged.

Note: Despite common usage, this approach is criticised. The reality of a network is that there is a constant consumption of energy, consumption which is not dependent on the data in transit. However, the intensity approach is applicable because there is a need to allocate this existing energy. In addition, the impact of manufacturing must also be allocated according to use. Other allocation methodologies by time of use would be preferable. However, this requires more precise data for each part of the network. Allocation by subscriber is also possible, but this metric is ill-suited to the granularity of a unitary digital service.

This impact-accounting methodology makes it possible to take into account the threshold effect caused by an increase in infrastructure and its use if the overall volume increases (new equipment, larger quantities of equipment and electricity to power it).

For certain parts, such as the user box, we have used a time allocation method rather than one based on intensity.

When assessing the digital service, it will also be necessary to have details of the different connections (Wifi, 4G, etc.).

With the AGEC Act, we have two interesting metrics:

  • 50 gEqCO₂ / Go for mobile networks
  • 18 gEqCO₂ / Go for fixed networks

However, the associated assumptions are not made explicit enough. The impact of the network will depend on many factors and assumptions:

  • Scope taken into account (Scope 3 including network operator operations)
  • Whether or not the equipment is manufactured
  • Taking account of the user’s box
  • … 

If we look at other sources that can be used directly, there is no more information. For example, the ADEME database contains Negaoctet data and in particular two metrics on mobile and fixed telephony:

“Fixed-line network; at consumer; xDSL, FFTx average mix; . Data come from equipment installation and energy consumption in 2020 – (…) Sources: French operators, ARCEP, ICT report: European Commission, ICT Impact study, (…), IEA-4E, (…)”.

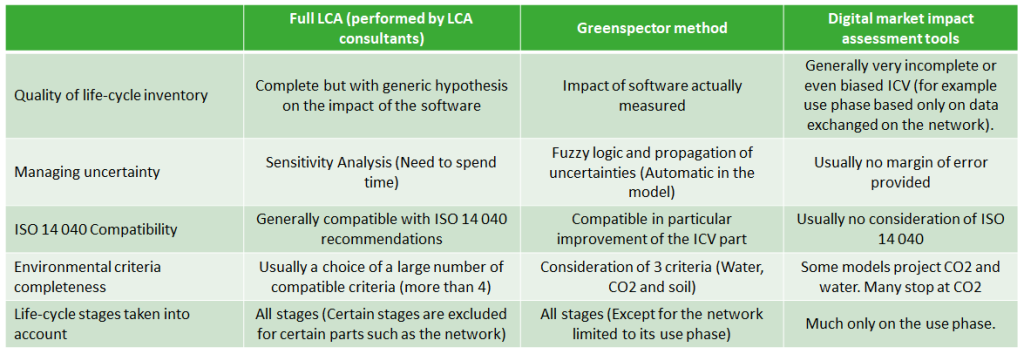
Even if sourced, there is no information to analyse the data. All the more so when you want to analyse the impact of digital accurately. This is the case with our methodology.

Analysis of market data

To make our assessments more accurate, we have carried out R&D work to obtain more reliable emission factors.

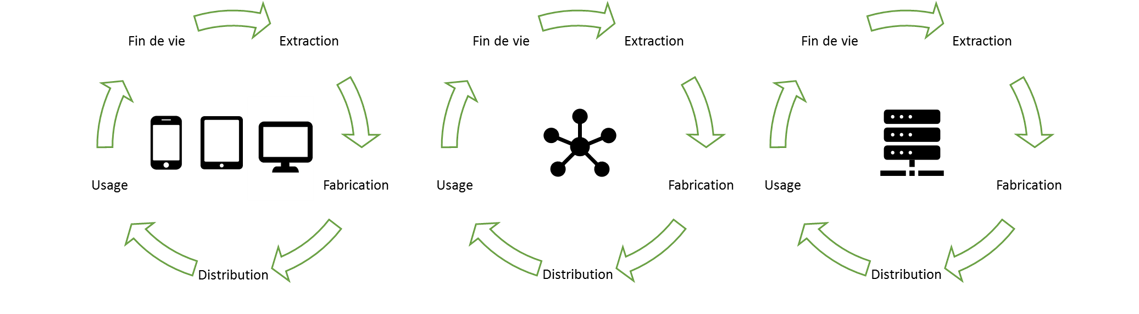
We have modelled the network in several thirds:

  • The backbone, which interconnects the network
  • The access network, closer to the user, with specific architectures for each type of connection (3G, fibre, etc.).
  • CPE (Customer Permise Equipment): Mainly the box on the user’s premises

We have excluded the user terminal from the modelling. We’ll look at how to deal with it specifically at the end of the article.

For access types, we have grouped :

  • Wired Fibre
  • Wired Copper (xDSL)
  • Old generation GSM (2G and 3G)
  • New generation” GSP (4G and 5G)
  • Public Wifi (hotspot)
  • Wifi corporate LAN
  • Company Ethernet LAN

It would be interesting to go further down the grouping (for example to separate 4G and 5G), but this grouping is adapted to the granularity of the data available.

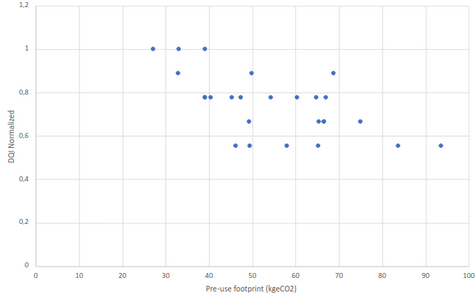
We analysed 35 public sources (operators’ CSR reports, scientific papers, manufacturers’ data). Each data item identified in the documents was classified according to the 7 types of access, the third of the network, and the scope taken into account (Manufacturing/Usage in particular). 169 data items were identified. We selected 145 (some data did not seem relevant).

The quality of each data item was qualified according to our methodology. 39 parameters were thus qualified (Core network Usage, Core network Manufacturing, etc.) in a format compatible with our methodology (Trapezoidal determination usable in fuzzy logic). For example, for the impact of using the fibre access network, we have the following values: 0.1293 / 0.3181 / 0.7891 / 1.9415. This means that the impact of the fibre access network, according to the literature, is probably between 0.3 and 0.78 Wh/GB.

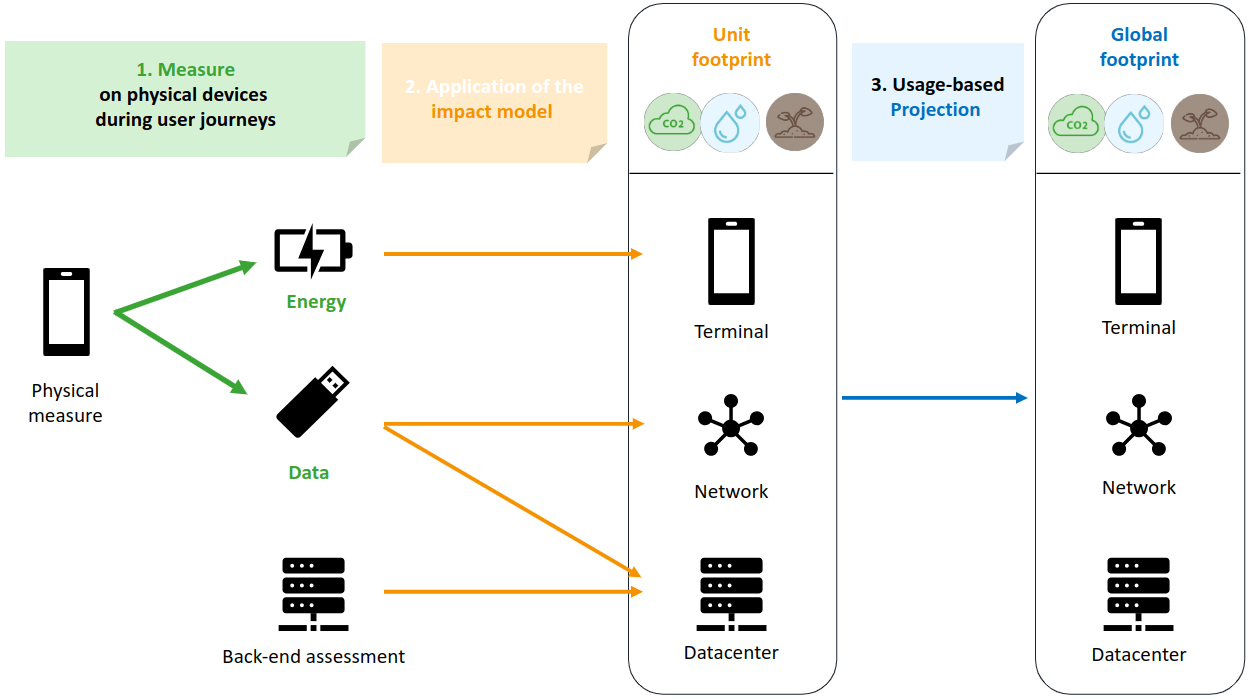
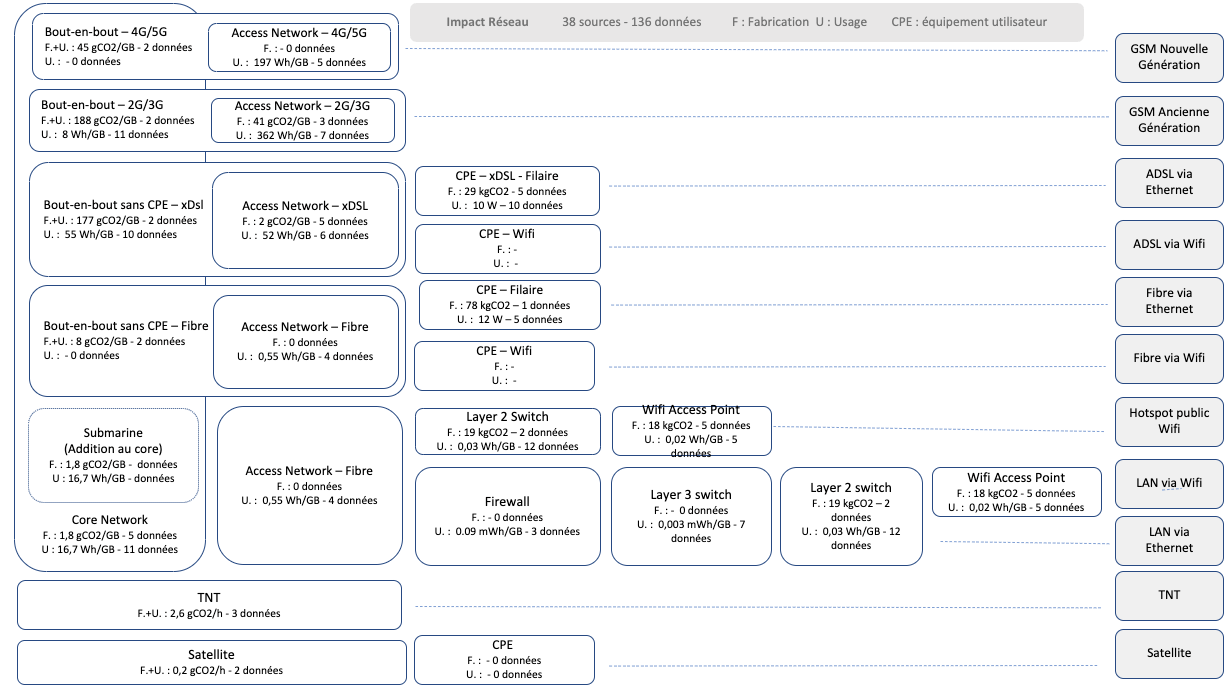
In the end, the model can be represented as follows:

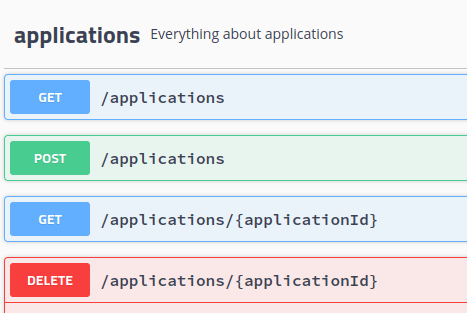
This model can be used dynamically by specifying certain parameters: EPC lifespan, energy mix, etc. Our API handles this automatically.

What is the likely impact of each network?

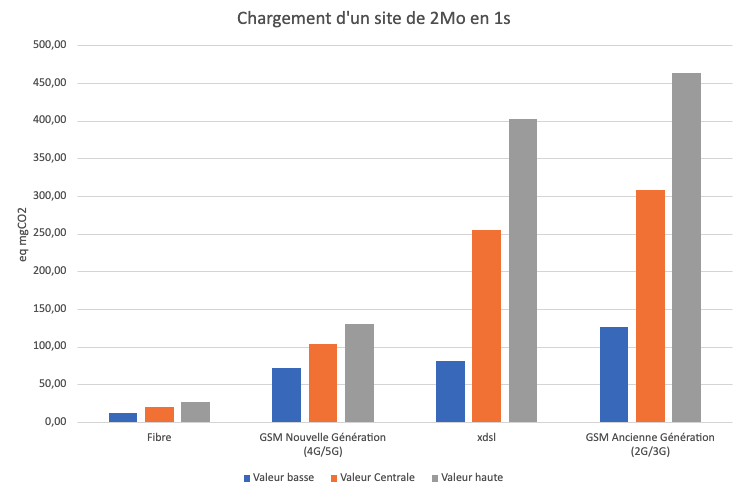
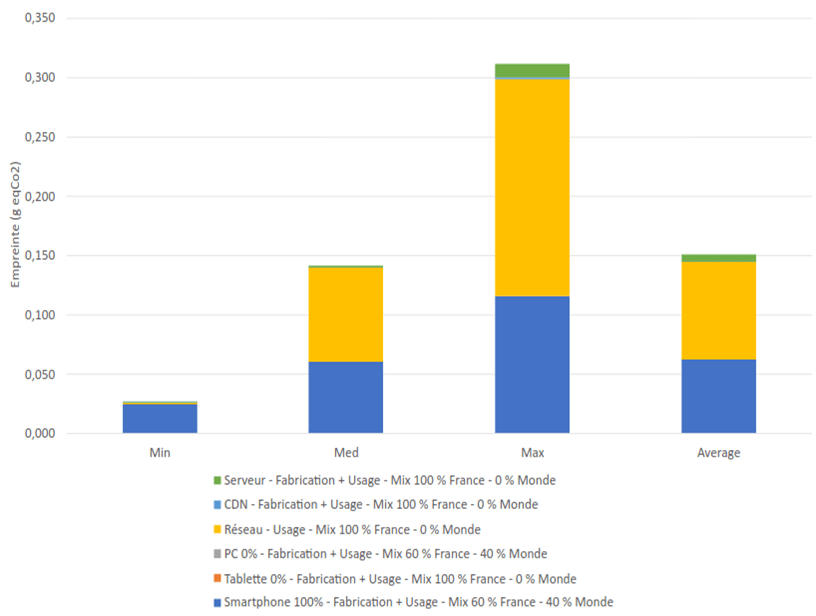
Taking the functional unit “Load a site of MB in 1s”, we obtain the following network impact:

Fibre has much less impact than other types of access. The ranking of 4G/5G ahead of ADSL seems counter-intuitive, especially in view of the messages we regularly hear: Favour wired connection over 4G as mentioned above. This data is wrong for a number of reasons:

  • The impact of base antennas and the access network of older GSM technologies is indeed more consumptive. The figures for older studies are based on these findings. It is important to adapt the recommendations according to the technologies and the age of the studies.
  • Some studies talk about the impact of the network on the terminal. For example, the Eco-index documentation states that “(…) a 4G connection requires up to 23 times more energy to transport the same amount of data as an ADSL connection. (..)” However, the source used is a study on the impact of LTE connections on smartphones at cell level. We’ll come back to the reality of smartphones later.

Margins of uncertainty can be observed for XDSL and old generation GSM networks:

This is due, on the one hand, to the older study data (and therefore weighted by our algorithm) and, on the other hand, to a greater diversity of technologies.

The proportion of manufacturing varies according to the technology used:

There has been a marked improvement in the energy efficiency of new-generation networks, and this is a widely cited argument for promoting new architectures.

Critical analysis of network impact data

  • Despite the model, which takes account of data sorting and qualification, the scope of all the data is not identified. We can find figures with the “raw” manufacturing impact and potentially others with the operator’s scope 3 (the impact of the operator’s offices, among other things). This will be taken into account in the model via the uncertainty margins.
  • The Co2/GB network intensity model is used. It is not fully representative of reality. In order to improve representativeness, we need more sources for temporal allocation (network throughput, consumption per user, etc.). We have begun to use this allocation mode for certain metrics such as Box data.
  • There are common elements between networks, and sometimes specific ones (for example, there are specific backbone elements for 5G). This needs to be taken into account.
  • Even though we have a level of granularity that allows us to take account of the energy mix dynamically, some of the data incorporates the mixes of different countries. This potentially overestimates the value of some data.

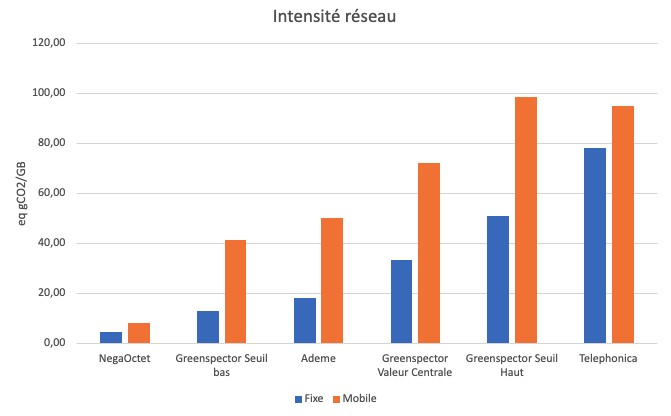
We compared our metrics with other market data (for 1GB).

Greenspector values are higher than NegaOctet and Ademe values (ARCEP/ADEME values are however higher than the low Greenspector threshold). Telephonica data is higher (for fixed) than the high Greenspector threshold (and identical for mobile).

This difference can probably be explained by the fact that we have incorporated many network manufacturing values. A second explanation is perhaps an underestimation of the values for France, which has set its figures at a low threshold. Without getting into a debate, these figures on the impact of the network are often monitored, so the tendency may be to underestimate the figures rather than overestimate them!

Specific

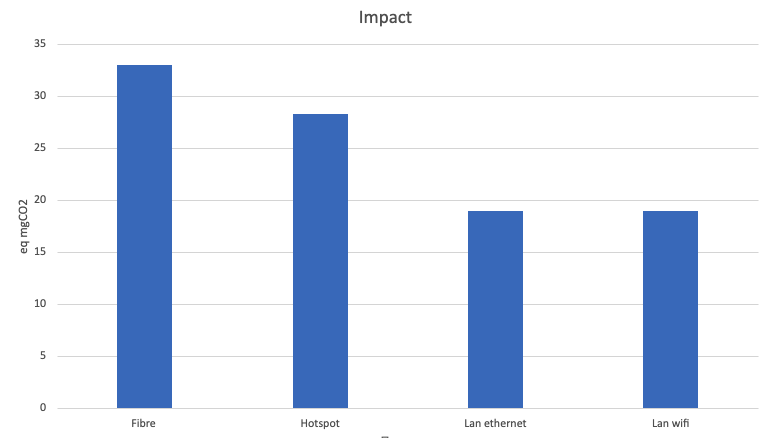
Are connections other than a private box more sober?

Yes, this is because this type of architecture is more shared. On the one hand, the hardware has a higher bandwidth capacity, so a lower allocation per item of data exchanged, and on the other, the impact of manufacturing is relatively low (in terms of capacity).

It should be noted that wifi has a slightly greater impact than ethernet. This is also true of boxes (for example, +3 Wh/h more on an Orange box).

Impact of the network on the terminal

We measure mobile applications and websites every day for our customers, so we deal with the impact of the network on the terminal and above all on the software. What we can say “from expert opinion”, but based on measurements, is that the impact of GSM networks is not 23 times greater, nor 10 times greater.

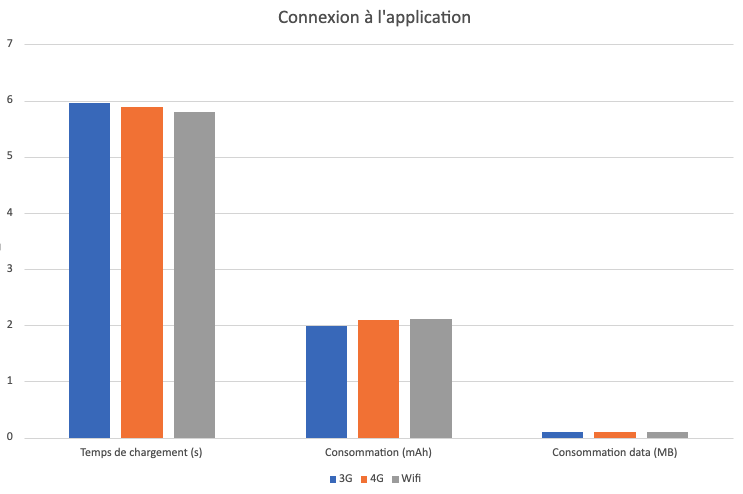
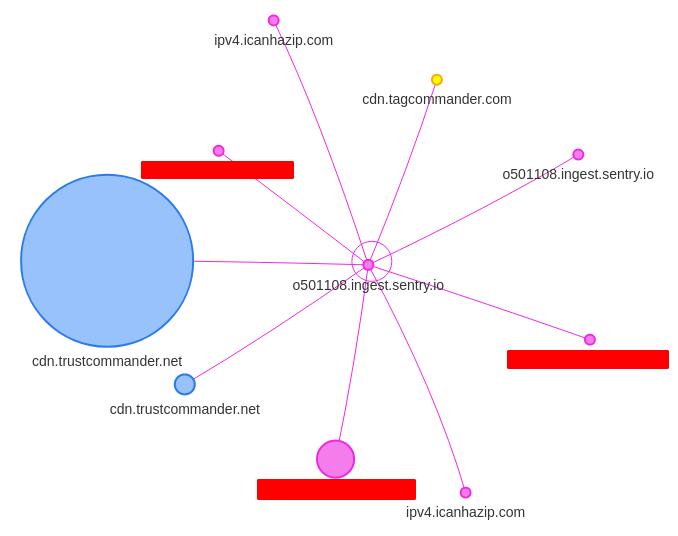
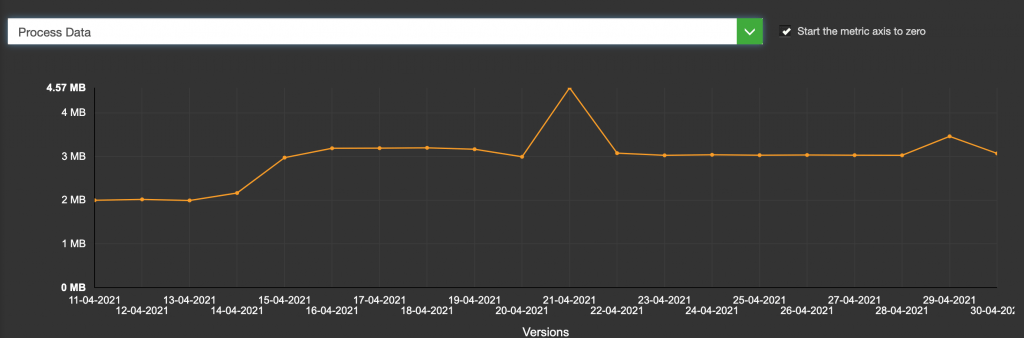
Here’s some measurement data on a streaming application (only the launch and connection to the application, not the streaming itself):

As can be seen for the connection (2nd graph), there is some data (~700 KB) and consumption is almost the same, or even slightly higher for the Wifi connection.

When it comes to loading the application (1st graph), WiFi consumes slightly less. However, there is a high level of data consumption (4MB vs 600kB). This can be explained by the different behaviour of the Wifi application (more data is loaded if the connection is Wifi). This has a major impact on loading times (from 4s to 7s for 3G).

The network will ultimately have an impact, but there are no set rules:

  • If the application adapts its behaviour to the type of connection and the speed, then potentially more data will be loaded on connections with a higher throughput. And potentially more CPU to process this data.
  • For 3G/2G connections, the loading time will be potentially longer (sometimes x2 or even x3).
  • Depending on whether or not requests are grouped together, the impact of GSM networks will be greater or lesser.

It is necessary to measure the final application to understand its behaviour in relation to the network. Implementing estimation rules in models is therefore complex and will lead to false data.

Conclusion

Assessing the environmental impact of the network is complex. We need more data from operators and manufacturers. This data needs to be more detailed and more transparent. However, existing data can be used, provided it is properly qualified and used. Given these observations, the use of averaged data is not an ideal approach. This is why we have adopted an approach that includes calculating uncertainties. As soon as we can, we have to measure in order to have contextualised and more accurate data. This is the approach we apply. This provides important clarifications for LCIs (life cycle inventories), digital impact assessments, or more individually for software evaluation.

DOM as a metric for monitoring web sobriety?

Reading Time: 3 minutes

Choosing the right metric to assess its impact is critical in a sobriety approach.

We have validated the use of energy in our tools (https://greenspector.com/fr/pourquoi-devriez-vous-mesurer-la-consommation-energetique-de-votre-logiciel/ and https://greenspector.com/fr/methodologie-calcul-empreinte-environnementale/ for more details). We do however use and measure other metrics such as CPU. This metric can however be complex to measure and some tools or teams use other more technically accessible elements. The CPU is an interesting metric to measure the resource footprint on the terminal side. Indeed, we have carried out measurements on several hundred sites and it is clear that the CPU is the most important metric for analysing the impact of software. This is why all the models that use the data exchanged to calculate the impact of the terminal are not consistent. CPU-based models (such as the Power API) are preferred.

However, it is necessary to be rigorous in the analysis of this metric as there may be interpretation biases (Example of criticism on the CPU). The criticism must be even more important on the way to obtain this metric, and more particularly in the case of modelling the CPU. This is the case, for example, with methods for projecting the CPU into the web from DOM elements.

This is based on the assumption that the structure of the DOM has an impact on the resource consumption of the terminal. The more complex the dom, the more it needs to be processed by the browser, the more resources (CPU and RAM) it uses and the more environmental impact it creates.

Assuming that the hypothesis of a correlation between DOM complexity and environmental impact is valid, the metric often used is the number of elements. A DOM with many elements may be complex but not systematically so. To take into account the complexity of the DOM, it would be necessary to take into account the architecture of the DOM, in particular the depth, the type of node (not all nodes have the same impact on the browser…). The choice of the number of DOM elements is therefore debatable.

But is the choice of DOM complexity a viable assumption? There are several criticisms of this.

The DOM is a raw structure that is not sufficient for the browser to display the page. The style is used with the DOM to create the CSSOM, a complexity of the style can thus greatly impact the CSSOM, even with a simple DOM. Then the layout tree is a structure that will allow the display to be managed (typos, sizes…), this management is much more complex to handle for browsers.

A DOM can be modified after its creation. This is called reflow and repaint. The browser will recalculate the layout and other things. This can happen several times during loading and after loading. The depth of the DOM (and not the number of elements) can influence but not only: the loading and execution of JS code are to be taken into account.

Independently of the DOM, resource consumption can be impacted by various processes on the terminal. In particular, all the JS processing that will be executed when the page is loaded. This cost is currently the main cost on the CPU in the web. And you can have a DOM with 100 elements (not many) and a JS gas factory.

Graphics animations will increase resource consumption without necessarily impacting the DOM. Even if most of this processing is handled by the GPU, the resource impact is not negligible. We can also put in this category the launching of videos, podcasts (and more generally media files) and ads.

There are also many other sources of resource consumption: ungrouped network requests, memory leaks.

The use of the DOM should therefore be used with great care. It is best used as a software quality metric that indicates “clean HTML”. Reducing the number of DOM elements and simplifying the DOM structure may be a good sobriety practice but not a sobriety reduction or CO2 calculation KPI.

How is the ecoscore calculated in the case of a web or mobile benchmark

Reading Time: 4 minutes

In this article, we will see in more detail how the ecoscore is calculated in the case of a web benchmark performed by Greenspector.

And in other cases ?

As you may already know, Greenspector also performs measurements on mobile applications. In the case of Android applications, it is possible to easily perform a benchmark. The methodology is standard: measurements on loading stages, pauses and reference. The ecoscore is also calculated from the Network and Client Resources ecoscores. The only notable difference is that the implementation of good practices is not automatically controlled and therefore not included in the calculation.

Also, in some cases, it is more appropriate to measure a user path directly in order to be as close as possible to the behavior of the site in its real conditions of use. Whether it’s for the web or a mobile application, Greenspector performs the measurements (always on real user terminals) after automating the path (via the GDSL language). The ecoscore is then established from the metrics represented via 3 ecoscores: Mobile Data, Performance and Energy.

What is a web benchmark?

In order to evaluate the environmental impacts of websites, Greenspector has several operating modes and tools. The easiest to implement is the web benchmark. This standard methodology allows to measure any web page and compare it with other pages.

Our Test Bench

The measurements are performed on a real smartphone available on our test bench, most often in WIFI (even if other connection modes, such as 3G or 4G, are possible) and with the Chrome browser.

Such a measurement lasts 70 seconds and includes:

-The loading of the page
-A pause step with the page displayed in the foreground
-A pause step with the page displayed in the background
-Scrolling on the page

In addition, a reference measurement is performed on an empty tab in Chrome.

Several iterations of measurement are performed to ensure their stability.

We thus recover metrics on the data transferred but also the impact on the user’s terminal and in particular on the battery discharge. In addition to this, the correct implementation of some thirty good practices is automatically verified.

Then, the environmental indicators are calculated taking into account, when possible, the real statistics of the page use. You can find more information about this on the dedicated page on the Greenspector blog.

Once all this information is available, it becomes easy to compare different web pages, whether they are on the same site or not. This is the operating mode that is used in the framework of the website rankings proposed on this blog, but also at the request of a client in order to establish an inventory of one or more of its websites and to propose an action plan. It can also be a way to build a competitive benchmark to position itself in relation to a sample of similar sites.

You can already have an overview of all this via the Mobile Efficiency Index (MEI) made available by Greenspector to evaluate the impact of a web page for free.

For the moment, we only have to see how the ecoscore is calculated in the context of a web benchmark.

Calculating the ecoscore for a web benchmark

First of all, the ecoscore established for a web page is the average of two values:

-A Client Resources ecoscore which reflects the way client resources are managed from a sobriety point of view when accessing this page
-A Network Ecoscore which reflects the network (and server) load

Client Resource Ecoscore

The Client ecoscore is based on 12 controls performed on the metrics directly retrieved from the user terminal (and collected via its operating system). These metrics concern, among other things, transferred data, but also battery discharge, CPU and memory. For each, 4 to 5 thresholds are defined to determine the acceptable values. According to these thresholds, a score is calculated. The scores for all the metrics are then aggregated to calculate the Customer Ecoscore.

For example:

-The maximum score for data transferred during page loading can only be obtained if its total weight is less than 500 KB
-For the battery discharge, we compare it to the one measured during the reference step described above

The thresholds used are defined via a database of measurements in order to be able, according to the statistical distribution of the measurements previously obtained, to determine the expected thresholds.

Network Ecoscore

Today, the Greenspector methodology is based on measurements only on real user terminals. As a result, the definition of the Network Ecoscore is slightly different. It is based on two elements:

-Comparison of metrics related to data transfer with thresholds defined in a similar way to those used for the Client Ecoscore calculation
-Automatic verification of the implementation of some thirty best practices

For example, we ensure that text resources are compressed on the server side, that images are not resized in the browser and that there are no more than 25 HTTP requests in total. These are therefore good technical practices (rather efficiency-oriented) that can be found in most good practice guidelines for ecodesign or responsible design of digital services.

Conclusion

All these elements make the web benchmark a very efficient process to evaluate the impacts of a web page and compare it with other web pages. It is also an excellent way to start a more in-depth analysis, especially by looking at the most impactful pages of a site. In some cases, it will be more judicious to start with the least impactful pages. A design flaw on a high impact page will often be specific to it, whereas on a low impact page, it will often be common to all the pages.

The web benchmark, among other things through the calculation of the ecoscore, illustrates once again the need to use both measures and good practices in an approach to reduce the environmental impact of a digital service.

How to audit Android mobile application requests?  

Reading Time: 5 minutes

Introduction

Request Map Generator is a tool available through webpagetest.org to display a visualization of the different domain names called when loading a web page. The objectives are multiple:

  • Identify the third-party services used on the page
  • Identify which components call these third-party services
  • Quantify their use and impact to challenge them
  • Identify the main action levers

For example, on this RequestMap, we see that the integration of Twitter and Linkedin is responsible for downloading 71 KB of JavaScript. We also observe the chain of queries leading to Google.

The problem is that the tool is made available to audit websites. What about mobile apps? Our approach to generating the request map for mobile applications is simple.

HAR mapper

RequestMap developer Simon Hearne also provides the HAR mapper tool which generates the same request maps from HAR files. HAR are JSON files used to record traffic captured by various web analysis tools such as DevTools. Thus, rather than requesting an entire test of the webpagetest suite, you can very well choose to save an HTTP Archive file (.har) on your own PC. This allows us to build more precise RequestMaps, which go beyond the home page while being more numerically sober.

The other advantage is that we are able to analyze mobile applications using an SSL proxy, provided that the application authorizes a certain network configuration (see Authorizing access to Charles’ certificate by the application ).

CharlesProxy, the developer’s Swiss army knife

A proxy is a server that acts as an intermediary between the server and the client. The latter sends the requests to the proxy which is then responsible for communicating with the server. This allows the proxy to observe the different requests that are exchanged. In addition, if the client accepts the CA certificate from the proxy which will thus act as a Certificate Authority, the proxy will be able to decrypt HTTPS requests to inspect their content.

Charles Proxy is a proxy server whose use is oriented for mobile developers. In addition, to act as an SSL Proxy, it offers to rewrite on the fly the headers (or even the content!) of the requests exchanged. It allows you to test the stability of an application with network conditions, or server problems (throttling, repeated requests, no-cache, etc.). In our case, what interests us the most is that Charles makes it possible to save the client-server exchanges recorded in the form of a .har file.

We suggest using Charles Proxy because it is an easy-to-use and fairly complete tool, but be aware that other proxy servers can be used for this use case. As alternatives, there is in particular mitmproxy, an open-source command-line tool or HTTP toolkit very easy to use in a paid version.

Install and configure Charles

Download Charles and install it. When Charles is launched, a proxy server is automatically configured and requests are recorded.

By default Charles only enables SSL proxying for a restricted list of domain names. To change this behaviour, go to Proxy > SSL Proxying settings. Check that SSL proxying is enabled and add an * entry to the Include table:

Configure smartphone 

It now remains to configure our Android smartphone to connect to Charles. The phone must be in the same local network as the PC Charles is running on. In the Wi-Fi settings, in the network configuration, set the Proxy as “Manual”. Enter the IP address of the PC on which Charles is running and define Charles’ port (8888 by default).

As soon as the smartphone communicates with the network, Charles will ask us to accept or refuse the proxy connection.

By accepting, Charles should start intercepting the network exchanges of the applications. However, the requests are not done correctly. Indeed, we still have to install Charles’ certificate on the phone.

Install Charles Certificate

Open the smartphone browser, and visit chls.pro/ssl. The download of the certificate is done automatically. If the file is open, Android offers to install it, provided that a PIN code locks the phone.

Attention from Android 11, the procedure is made more complicated. (Visit Charles’ help to install the certificate on other systems).

It is now possible for us to forward the requests issued by the Chrome process but not those of other applications. Indeed, for security reasons by default Android applications only accept “system” certificates (This is not the case for iOS which also offers a Charles application on the App Store).

Allow access to Charles’ certificate by an Android application 

There are three possible scenarios:: 

  1. You have the source code of the application. 

    In this case, it is easy for you to authorize the use of “user” CA certificates. To do this, add a res/xml/network_security_config.xml file defining the network configuration rules of the application:
<?xml version="1.0" encoding="utf-8"?> 

<network-security-config> 

<base-config cleartextTrafficPermitted="true"> 

<trust-anchors> 

<certificates src="system" /> 

<certificates src="user" overridePins="true" /> 

</trust-anchors> 

</base-config> 

</network-security-config> 

You must also specify its path in the AndroidManifest.xml: 

<?xml version="1.0" encoding="utf-8"?> 

<manifest ... > 

<application android:networkSecurityConfig="@xml/network_security_config" ... > 

... 

</application> 

</manifest> 

Remember to keep this configuration only for the debug application, because it can cause MAJOR security problems. See the official documentation for more details.

  1. You only have the application’s APK. 

In this case, you will have to decompile the application, use the same method as in 2. and recompile the application and sign the resulting apk. For this, some tools (apk-mitm or patch-apk) can help you in the process. The method is however not guaranteed to work as the app may implement apk signature verification.

Attention! In France, the decompilation of software is strictly governed by the law which defines in which cases it is legal. If in doubt, be sure to get permission from the publisher first!

  1. The testing smartphone is rooted 

Dans ce cas, vous pouvez installer le certificat dans les certificats root du téléphone. 

Once the certificate can be used by the application, we can inspect the exchanges between the smartphone and the server. To generate a .har file, select all the requests, right-click in Charles on the network exchanges > Export Session… and export in HAR.

Import the file into HAR Mapper, and we have our Request Map!

How does Greenspector assess the environmental footprint of digital service use?

Reading Time: 6 minutes

Foreword: Assessing the impact of the use

This note briefly describes the methodology we use at the date of its publication.

Because of our continuous improvement process, we are vigilant in constantly improving the consistency of our measures as well as our methodology for projecting environmental impact data. 

We assess the environmental impacts caused by the use of a digital service.

This analysis is based on a Life Cycle Analysis (LCA) method, but it is not about performing the LCA of a digital service.​

Such an analysis would be an exercise on a much broader scope, which would include elements specific to the organization that created the software.

In the LCA of a digital service, it would be appropriate, for example, to include for its manufacturing phase: the home-work trips of the project team (internal and service providers), the heating of their premises, the PCs and servers necessary for the development, integration and acceptance, on-site or remote meetings, etc …

Environmental footprint assessment methodology

Our approach

The chosen modelling is based on the principles of Life Cycle Analysis (LCA), and mainly by the definition given by ISO 14040.

It consists of a complete Life Cycle Inventory (LCI) part and a simplified Life Cycle Assessment (LCA). The LCI is predominant in our model. It will ensure that we have reliable and representative data. In addition, the LCI thus obtained can, if necessary, be integrated into more advanced LCAs.

We assess the environmental impact of digital services on a limited set of criteria::

This methodology has been reviewed by the EVEA firm – a specialist in ecodesign and life cycle analyses.
Note on water resource: Greywater and blue water are taken into account at all stages of the life cycle. Green water is added to the manufacturing cycle of terminals and servers. See the definition of the water footprint.

Quality management of results

The quality of LCA results can be modelled as follows1 :​​

Quality of input data x Quality of methodology = Quality of results

To improve the quality of the input data, we measure the behaviour of your solution on real devices. It helps to limit the models that are potential sources of uncertainty.​

To manage the quality of the results, we apply an approach that identifies the sources of uncertainties and calculates the uncertainty of the model. Our method of managing uncertainties uses fuzzy logic and its sets2.

Ultimately, unlike other tools and methodologies, we can provide margins of error in the results we give you. It ensures more peaceful communication of the environmental impact to stakeholders (users, internal teams, partners, etc.)

1Quality of results: SETAC (Society of Environmental Toxicology and Chemistry 1992)

2Although often mentioned in the literature dealing with uncertainties in LCA. This approach is little used. Indeed, stochastic models such as Monte Carlo simulations are often preferred (Huijbregts MAJ, 1998). In our case, the use of fuzzy logic seems more relevant because it allows us to deal with epistemic inaccuracies, especially due to expert estimates.​

Calculation steps

Phases taken into account for the equipment used

Note on the impact model of the terminal part

Classical impact analysis methodologies assume a uniform impact on the software (average consumption regardless of the software or the state of the software). Our innovative approach makes it possible to refine this impact. In addition, we are improving the modelling of the software impact on the hardware manufacturing phase by accounting for battery wear.

The battery of smartphones and laptops is consumable. We model the impact of the software on it.

Input data for the Life-Cycle Inventory

Measured data
Energy consumed on a smartphone
Data exchanged on the network
Requests processed by the server

Modelled data
Energy consumed on tablet and PC
Energy and resources consumed on the server
Energy and resources consumed on the network

Terminal Assumptions
Impact of smartphone manufacturing
Impact smartphone battery manufacturing
Tablet battery manufacturing impact
PC battery manufacturing impact
Max number of cycles before smartphone wear
Max number of cycles before wear Shelf
Average smartphone battery capacity
Average tablet battery capacity
Average PC battery capacity
Battery voltage
Smartphone lifespan
Tablet life
PC life
Battery replacement vs smartphone change ratio
The ratio of battery replacement vs tablet replacement
Battery replacement vs PC change ratio
Reference discharge speed on the terminal (measured)

Assumptions Servers
Server power
Of cores
Data centre PUE
Power by heart
Server time (TTFB)
Number of max requests per second
Power per request
Number of cores per VM
Number of VMs per simple app
Number of VMs per complex app
Impact Manufacturing Server
Server lifetime
CDN Debit

Energy assumptions
World average electricity emission factor
Electricity emission factor France

Example of work on hypotheses:

The methodology of propagation of uncertainties requires us to identify precisely the quality of these assumptions. Here are a few examples, in particular the impact of material manufacturing.

The bibliographic analysis allows us to identify the impacts of different smartphones, and to associate the DQI confidence index. These figures mainly come from the manufacturers.

The average impact calculated from these confidence indices is 52 kg eq Co2 with a standard deviation of 16 kg.

Example of restitution

  • In this example: the median impact of 0.14g eqCO2 is mainly on the ‘Network’ part.

  • This impact corresponds to viewing a web page for 20s

  • Uncertainty is calculated by the Greenspector model by applying the principle of propagation of uncertainties from the perimeter and assumptions described above.

Necessary elements

To determine the impact of your solution, we need the following information:

  • Smartphone / Tablet / PC viewing ratio
  • France / World visualization ratio
  • Location of France / World servers
  • Simple or complex servers (or number of servers in the solution)

On this estimate, we can carry out a simplified LCA based on this model but adapting other elements to counter particular circumstances. For example:​

  • Measurement of the energy consumption of the server part (via a partner)
  • Accuracy of server assumptions (PUE, server type)
  • Measurement of the PC part (via laboratory measurement)
  • Accuracy of the electrical emission factors of a particular country…

Comparison of estimation models

Greenspector calculations are integrated into a web service currently used by our customers. Very soon, find our calculations of the environmental footprint of your mobile applications and websites in a SaaS interface.

Comparison of estimation models

Calculation methods in digital sobriety are often not very accurate and sometimes, at the same time, not very faithful. It potentially leads you to use tools that poorly assess the impact of your solutions. The risk is to make your teams work on areas that have no real impact on the environment.

Some approaches, more used in LCAs (and not in market tools), improve fidelity but pose a risk of giving an unfair result (R. Heijungs 2019).

Our approach is based on an innovative computational method, fuzzy arithmetic, first proposed by Weckenmann et al. (2001).

This approach is very efficient for modelling vague (epistemic) non-probabilistic data, which is often the case of data dealing with digital sobriety. In this way, we aim for accurate and faithful results.

Rival solutions make choices that generally make them inaccurate and unreliable:

  • Fidelity: Poor control of the environment, no methodology for managing measurement deviations
  • Accuracy: Model-based on non-representative metrics such as data consumption or DOM size, no energy measurement…

Why is it crucial to monitor the environmental impact of a URL?

Reading Time: 4 minutes

The more frequently a URL is viewed, the more essential it is to reduce its digital impact. A simple measurement makes it possible to check and react to changes made on the page: modifications linked to the graphic charter, events (e-commerce sites during sales periods) or even technical modifications. All of these changes can have a big impact on the sobriety level of a web page.

When to integrate the digital sobriety measurement of a URL?

These measurements can be integrated as part of daily monitoring on any page. “Dynamic” pages whose content changes regularly, such as e-commerce home pages or press information sites, are crucial to monitor. Even less “dynamic” pages can also be targeted: updating a CDN library can, for example, impact this type of site. In this case, the measurement will make it possible to ensure that the new skin of the page does not harm the level of sobriety of the website: an image too heavy for a banner can be easily spotted.

Measurement can also be used during the development phase. To test choices before going into production or to correct excessively impactful changes very early. It is often difficult to change the choice of a technology or an implementation once a site goes into production. Measuring a URL during the development phase allows you to test different options early on and see which one corresponds best by taking into account digital sobriety as one of the criteria.

Example of daily monitoring of a web page

How to measure the digital sobriety of a URL?

There are several options available to you at Greenspector to measure a URL.

A first tool allows us to perform a simple first measurement of a URL and obtain rapid observations: the Benchmark tool based on standardized tests.

To go further, we can measure a complete user journey on a website using App Scan. This kind of measurement represents the full path on a website or mobile application, such as a purchase journey or the completion of a bank transfer. It helps identify areas to focus on to achieve significant improvement. As part of an App Scan, the measurement of a URL is also possible via an automated route which will allow obtaining specific metrics beyond the benchmark.

URL measurement vs Benchmark

Here are the different steps measured during a URL measurement vs with the Benchmark tool:

Measured steps

  • Loading without cache
  • Pause after launching without cache
  • Pause on the web without cache
  • Scroll on the web
  • Pause on the web after scroll
  • Loading with cache
  • Pause on the web with cache
  • Background app metering

Benchmark

URL Measurement

The URL metric contains more steps than the benchmark we will come back to that. Unlike the benchmark, the URL measurement is more precise on the loadings. The measured duration being the actual loading time, unlike the benchmark tool which performs the measurements over a fixed period of 20 seconds. Another difference is that the URL measurement manages the tabs present on the page, in particular those concerning cookies, which the benchmark tool does not do.

Enfin, la mesure URL par Greenspector permet de réaliser des mesures sur d’autres navigateurs que GFinally, the URL measurement by Greenspector makes it possible to carry out measurements on browsers other than Google Chrome. The benchmark tool is limited to the latter browser, but our GDSL expertise allows us to offer another browser such as Firefox to go even further.

The steps of a URL measurement

  • Loading without cache: This is the loading of the URL having previously cleared the cache and deleted all cookies. This step measures the loading of the web page when a user goes to it without a cache. It is essential for URLs with a lot of unique visits.
  • Pause after loading without cache: Measuring a short pause after loading allows you to recover data exchanges and other operations that are still taking place when your page is displayed. The ideal, of course, is to have none of that. Otherwise, it allows us to make observations and suggest ways to eliminate or reduce these treatments.
  • Pause on a page without cache: It represents the action of a user reading the content. No movement on the screen. The idea of ​​this step is to measure the impact of the continuous display of the page.
  • Scroll on the page: Scroll to the bottom of the page to make observations on the treatments during the scroll. Here we can make observations on the possible data exchanges (pagination, image download, advertising) as well as the associated fluidity.
  • Pause on the page after scrolling: Measure of pause after scrolling allowing to observe processes that continue after the end of user interactions.
  • Loading with cache: Measurement of the loading of the URL with the cache of previous interactions (loading, scroll). This step allows you to see the impact of caching on the site. This is important for pages that will be visited a large number of times by known visitors, such as a website home page.
  • Pause on the page with cache: The measure of pause on the page allowing to see if despite the cache there are treatments after loading.

Thanks to our tools and our expertise, we can offer reliable and relevant measurements on a URL. Whether it is a simple measurement allowing initial findings using our benchmark tool or a more in-depth measurement with our GDSL language. This regular URL monitoring gradually improves the sobriety level of its website. This approach compared to other approaches commonly used in the web (Analysis only of the loading of the page with Lighthouse or others …), brings more finesse to the knowledge of the consumption of the page.

How to clean up the Chrome app for reliable energy and performance measurements?

Reading Time: 5 minutes

Context

Welcome to this new “GDSL focus” section. We will explain some methods of the Greenspector GDSL automation language. If you have not yet read the GDSL introductory article, do not hesitate before reading this one further.

Today we will focus on the browserReset method. It allows cleaning a browser to perform reliable performance and energy measurements.

To perform correct browser measurements, you need to be able to make sure to measure only your web page, without any parasite that could come from the browser, such as open tabs. Without this, the measurement of the consumption of a web page would be biased by tabs in the background carrying out processing and network exchanges. Moreover, it allows to precisely measure the consumption of the empty browser, once the cleaning has been carried out, and to compare it with the consumption of the site.

When it comes to automation, we cannot stand not knowing the initial conditions of our test. The unknown could disrupt its proper functioning or even lead to a test where nothing can be learned. Because, in the end, we do not know what will be measured.

On an automated test bench, it’s hard to know the state of the browser at the start of your test: you don’t know if a previous test left tabs open, changed the browser language, or anything else. We could take a look in the smartphones room but it becomes complicated if it is on the other side of the world. Not to mention the current health situation (this article was written during the crisis of Covid-19). You could also use the tools to monitor the phone remotely. So yes, but this is only valid if you are present when you run your test. For continuous integration campaigns that can run for hours or even overnight, you aren’t going to be able to monitor them constantly.

So what should be done? Clean the browser efficiently before each test.

Quick approach

In our case, we are going to use the Chrome browser. This method also works the same with another browser. We will also assume that this browser is updated regularly on phones.

A quick method, which will work in many cases to clean up a browser, is to close open tabs and clean the cache at the start of each of our tests. This way, the next time the browser opens during measurements it will be on an empty tab.

This method will work on the majority of smartphones but will be difficult on tablets because of the management of tabs. On tablets, tabs are generally displayed on a bar at the top (or bottom) of the browser, like on a computer. The peculiarity of this tab bar is that it is invisible to classic automation tools, which makes it very difficult to click on the cross to close the tab. In addition, the size of a tab will depend on the number of tabs open, making click by coordinates even more hazardous.

To top it off, the button to close all tabs at once only appears with a long press on the close cross of the first tab, making it unusable for us.

The last difficulty that this method can encounter is its maintenance, in fact by updating the application, the management of the tabs can change, as can the architecture of the application, requiring to modify regularly the automation scripts.

Complete solution

The solution used at Greenspector to clean the browser before our measurements and ensure the relevance of our results is as follows:

  • Clean up application data. This is usually done using the adb shell pm clear PACKAGE_NAME command but can also be done in the phone’s settings menu.
  • Skip browser first launches popups with automation.

Once this is done, there is one last point that can pose a problem. Some manufacturers or mobile operators display a personalized browser home page. To be able to compare measurements between several smartphones, you must get rid of this home page. We have chosen to disable the home page in the browser settings.

There is one last point regarding this home page. Indeed, it was loaded the first time the browser was launched and is therefore open, which is not practical for taking measurements. Our solution was to navigate to Chrome’s “new tab” page at the following URL:

  • « chrome://newtab »

Once all these operations are done, your browser is ready to take measurements without the risk of having existing conditions to disturb it.

It is even ideal to do the cleaning also at the end of your test, that way you leave the phone ready for the next person.

UPDATE: For our measurement needs, we are interested in performance data, energy, and mobile data. This method meets performance and power requirements well but is not suitable for data on the Chrome browser. Indeed, by resetting the browser, Chrome automatically resynchronizes the data of the Google account, and at least the first two minutes of use there are exchanges of data related to the Google account. Signing out of the Google Account on Chrome or the phone doesn’t seem to solve the problem entirely. Therefore at Greenspector we no longer use this method to clean up a browser. No measurements have been taken on browsers other than Chrome to say that this method is not valid on them.

Here you know everything about the browserReset method. See you soon for a new GDSL focus where I will introduce you to another feature of the Greenspector automation language.

Introduction to GDSL: The Automation Language by Greenspector

Reading Time: 3 minutes

What is GDSL ?

The term GDSL stands for Greenspector Domain-Specific Language. It is a language created by Greenspector to simplify test automation on Android and iOS. To put it simply, it is an overlay based on the automation frameworks from Google and Apple, embellished with functions to ease test automation.

This language is the result of the Greenspector expertise accumulated over several years. It combines ease of writing with the ability to measure the energy performance of an application or website.

The GDSL principle is to be a language for describing actions that will be performed on the smartphone. In that sense, it can be closer to Gherkin with whom it shares the quality of not requiring developer training to be read.

The GDSL is a series of actions that will be performed in order on the smartphone. It has the basic actions of WAIT, CLICK or PAUSE as well as more complex actions such as launching an application or managing the GPS. 

With GDSL it is possible to quickly automate most of the critical user journeys of your applications or mobile website. 

GDSL syntax

Here is an example line from GDSL:

waitUntilText,username,10000

The first element, in green (waitUntilText), is the name of the method. Usually, it will be in English and self-explanatory. Here we will wait for a text. The main actions of WAIT and CLICK are available with variations for id, text or content description.

The second element, in orange (username), is going to be the main parameter of the method. This is usually the graphical element on which the action should be taken. Depending on the method called, this will be an id, a text or a description. In the example, this is a text.

The last element, in blue (10000), is a second parameter of the method. These are most often optional parameters giving additional conditions during execution. Here it is a time in milliseconds.

To separate each element we use a comma.

The method presented as an example is therefore used to wait for the element with the text “username” for a maximum of 10 seconds.

In the current state of the language, there are no methods requiring more than two parameters. If the method fails then the test will stop and the report will show the test as failed.

The advantages of GDSL

  • GDSL does not require any development skills or knowledge of programming languages ​​to be used or read. The names of the methods are self-explanatory and allow anyone new to the project to read and understand your tests.
  • No IDE or specific development environment is required to write GDSL, a basic text editor is sufficient.
  • One test = one file. With GDSL no need for complicated file architecture, only one file contains your test.
  • Its ease of use allows you to write a test very quickly without relying on the rest of the test project as other automatic test languages ​​would require.
  • In addition, its ease of execution with the associated tools at Greenspector allows each new test to be implemented very quickly.
  • Updated and maintained regularly, the language already has advanced features for website automation such as tab opening or URL navigation.
  • In direct combination with the tools and expertise of Greenspector, GDSL is the only automation language that allows you to measure the performance and environmental impact of your application while performing your daily tests.

The current limits of GDSL

  • The GDSL does not yet allow us to perform complex logic tests (for example: if I am connected then I see element 1, otherwise I see element 2). You have to write a different test for each case.
  • The GDSL is based on graphic elements present in descriptive form. It is unable to interpret the content of an image or analyze the layout of your application. It cannot do a test verifying that the button is located at the bottom right of the screen.

The Greenspector team works daily to improve the language and add functionalities. The current state automates most of the scenarios required for a complete measurement campaign for an application or website as well as the critical journeys of most applications. In a future article, we will tell you about the Greenspector tools for running GDSL tests.

What’s new? Greenspector release note v.2.9.0

Reading Time: 2 minutes

The Greenspector team is proud to announce its latest release v.2.9.0.

To measure application and website consumption, you can run user journeys on our smartphone farms. In this context, we have improved our simplified test language (GDSL) with, for example, features for preparing browsers but also taking Firefox into account… Unlike many tools that provide you with an environmental impact only on the main page and on simulated environments, these capabilities will allow you to assess and monitor the impact of your digital solution!

API Swagger for existing routes applications
You can now easily switch browser

Why automate the testing of its mobile applications?

Reading Time: 3 minutes

The tests automation is often considered as an additional cost within the development teams, and this for various reasons:

  • Necessity of a team’s rise in competence on a particular tool
  • Writing times are more important than manual execution times
  • Necessary maintenance of tests over time

Mobile development with lower project costs and shorter development times doesn’t help move to automated testing. The benefits aren’t necessarily well evaluated towards the cost of autonomization. In the end, mobile application automation projects often go by the wayside or are delayed too late in the project. This is a common mistake because the benefits of test automation for mobile applications are numerous.

Mobile applications are applications like the others: complex, technical …

Mobile applications are considered applications requiring little development, low costs… This isn’t always the case. We are no longer in the same situation in recent years where mobile application projects were Proofs Of Concept and other early stages. Mobile applications have now undergone the natural entropy of any software project: reinforced security constraints, integrated libraries and SDKs, modular architectures, multiple interactions with backend servers …

This maturity (mixed with the entropy of software) no longer allows to leave the tests aside. An industrialization of the tests, and in particular the automation, makes it possible to ensure a necessary quality for the mobile projects. Without this, it’s a failure assured.

Failure is no longer possible

Combined with this complexification of mobile projects, applications have become critical business projects. Indeed, they are the new showcases of brands and organizations. And given the rapid development cycles, a project failure (delays, late detection of user bugs…) may be fatal to the company reputation. Especially since a bad experience experienced by the user can simply lead to uninstallation, non-use of the application or writing a negative opinion on the stores.

The level of quality must be at the rendezvous and automated tests are a must to control the performance of its application.

Test is doubtful, doubt is good

A quality development team, a square process and manual tests could help ensure this quality. To test would question the skills of the team? No, because as the stress of the tightrope walker that allows him to cross the ravine, the doubt is good for the quality. An SDK with unexpected behavior, an undesired regression … As much insure with tests.

Automation makes Test Driven Development (TDD) possible

Anticipating automation will allow more to go to the practices of Test Driven Development. Writing tests before development is quite possible in mobile projects. With or without tools, it’s interesting to automate a specified scenario and launch it under development.

And not to mention Test Driven Development, having tests that closely follow the development will detect other problems as soon as possible.

Platform fragmentation can not be managed with manual tests

Testing manually on a device only no longer makes it possible to ensure the proper functioning of an application. The diversity of the hardware with hardware and software configurations is a source of bug. Different screen sizes, overlay builders … an automation will allow to run parallel tests on different devices and detect potential bugs. This way, we will avoid confusing end users and beta testers of the application!

Master the regressions in maintenance

The release of the first release of the application is only the beginning of the life cycle of the application. 80% of the development load is maintenance and application evolution. It’s therefore necessary to project on the duration. By automating, we will avoid adding regressions in the application. The launch of the tests will be systematic with each evolution of the application.

Automation allows performance metrics

In the end, automation will make it possible to follow other requirements than functional requirements: non-functional requirements. Indeed, associated with measurement tools, the automated tests will allow to trace new metrics: performance, resource consumption…

This is the strategy that GREENSPECTOR recommends to its users: by integrating the GREENSPECTOR API into automated tests, they can follow at each test campaign: the efficiency and performance of their development. The cost of automation is then largely covered by the benefits.