You must know that a qualitative application shouldn’t consume too much resources on a user’s smartphone. It is a requirement for it to be adopted and then used in proper conditions. So, you decided to get down to work and control this consumption of diverse resources (CPU, memory, data, etc), energy, application size etc.
Even if you you are a good patterns and development languages expert, road to hell is paved with good intentions! What toolbox should you start with? Let’s review the tools that will become an Android developer’s bestfriends.
Android Studio
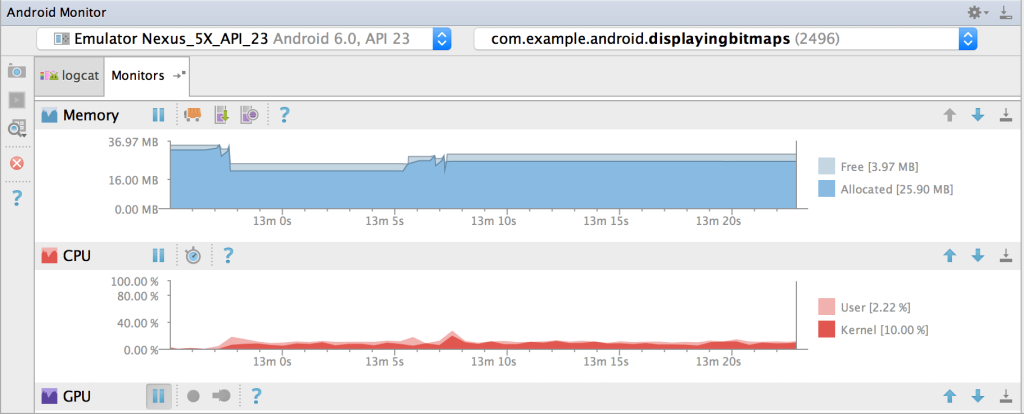
Android Studio now integrates numerous tools that keep track of your application’s resources consumption; the main advantage being the tool is fully integrated in your development environment. Can’t do much closer to day-to-day work than this. However, you will have to go get them in sub-menus and remember to monitor the metrics.
Latest version makes available profiling of network and libraries, such as OKHTTP:
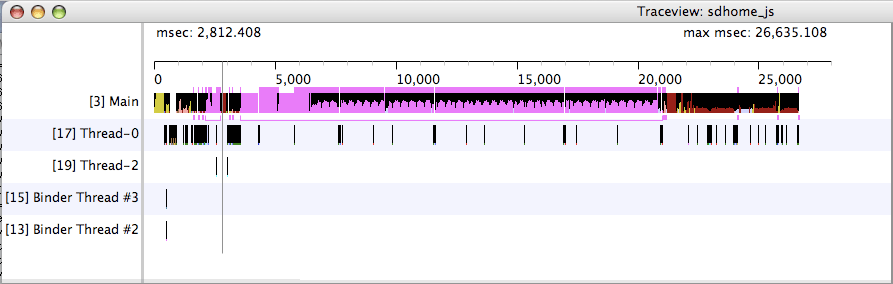
SDK tools: Traceview
Traceview allows the visualization of method calls, time spent in each one… Even though the tool is extremely powerful, you might spend a good amount of time analyzing data. There is also a chance you get lost in the call hierarchy. But overall, this tool is a must-have when it comes to analysis of performance issues (among others!).
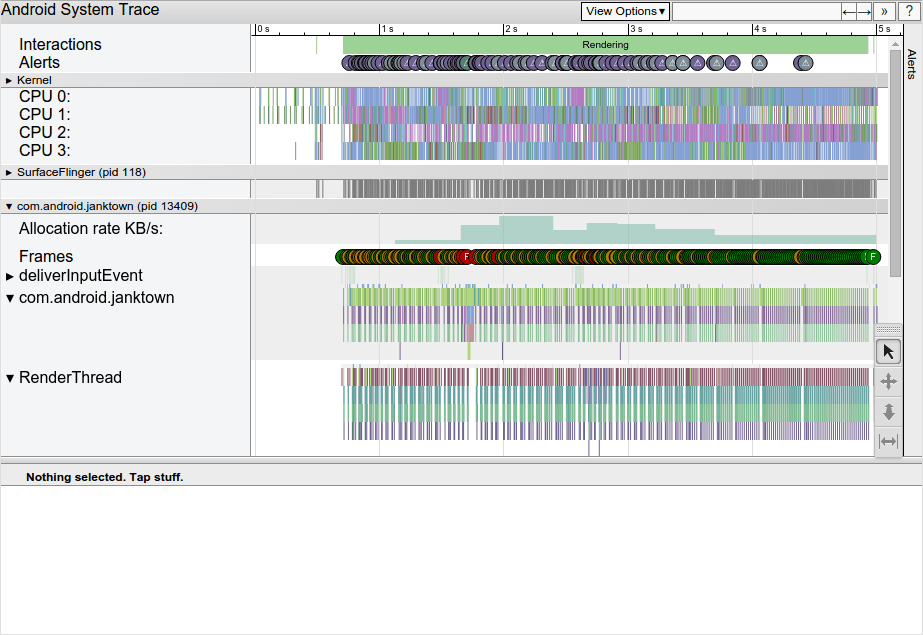
SDK tools: Systrace
Systrace is another very interesting profiling tool, letting you visualize information on hardware (CPU work with repartition on CPUs) but also on Android information packages (RenderThread, Event…). Just like any other (good) profiling tool, it provides a lot of info. The drawback we see is the amount of time it might take to process all this information. And quickly, it can turn rather time-consuming.
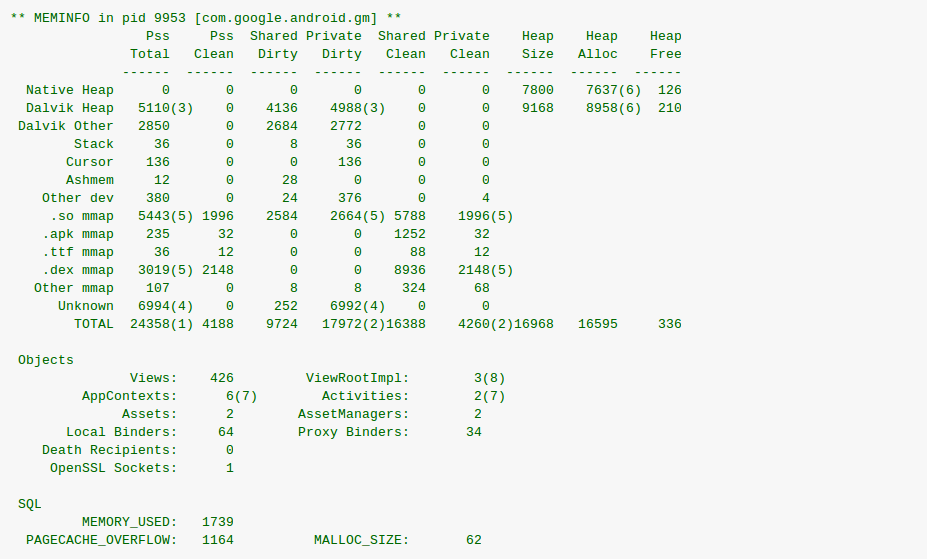
SDK tools: Dumpsys
Dumpsys is an online module controlling the Android system. You can retrieve numerous information on views, on base… However, the drawback of the solution here is the metrics’ complexity, hence the necessity to spend time analyzing and launching measures. For instance, enter the following command line in order to get information on graphic treatments:
If you’ve activated the developer’s mode already, you will get tools enabling you to measure some metrics such as display perfromance, CPU, etc. This mode is pretty interesting but having to check and launch manually actions on a phone limits its usefulness and power.
You should know that it is possible to highlight drawn zones, making it easier to identify frequent redraws.
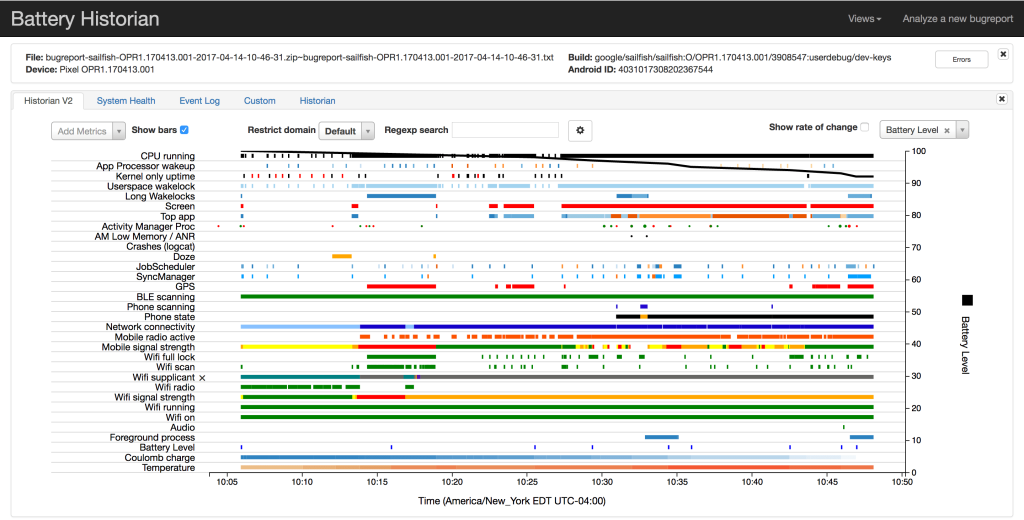
Non-SDK-integrated Android tools: Battery Historian
Battery Historian is a tool helping the visualization of information coming from the dumpsys batterystats. Battery discharge is visible simultaneously as system treatment and component use. As a consequence, you can detect potential energy leakage. Limit in this case is that it’s necessary to run the application for a few minutes, which makes the analysis more complex: similar to a profiling tool, with the complexity that comes with it.
Obviously you can’t expect us to talk about all those tools without mentionning GREENSPECTOR! The tools we mentionned in this article are powerful, but this also translates by a rather important complexity, which requires to be some sort of an expert in order to get the right information out of it. But, pretty frequently, developers use those tools only in complicated crisis situation, and not on a regular nor “monitoring” basis. Yet, getting figures of resources consumption is a valuable measure for all developers to get throughout the whole development phase. This is why GREENSPECTOR is usable in continuous integration. Other than basic metrics, we integrated part of the expert tools (like Dumpsys) directly in GREENSPECTOR. The goal here is to pair the interface’s simplicity, for a constant monitoring, with the possibility to get more precise information if needed.
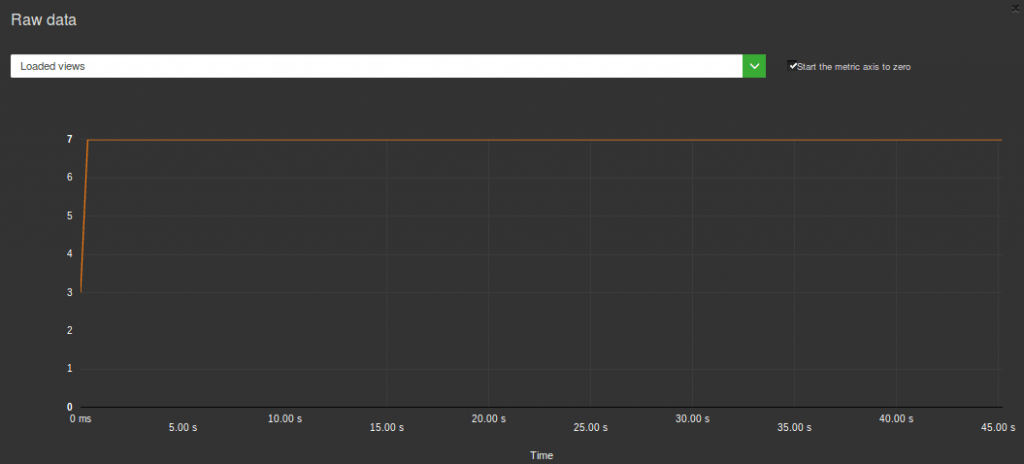
Here is for example a graph on Android views when the application launches after a test in continuous integration:
This is a way to measure, thus detect more easily, consumption issues. If needed, a deeper analysis can then be conducted with the other tools we mentionned.
Digital Sobriety Expert
Books author «Green Patterns», «Green IT – Gérer la consommation d’énergie de vos systèmes informatiques», …
Speaker (VOXXED Luxembourg, EGG Berlin, ICT4S Stockholm, …)
Green Code Lab Founder, ecodesign software national association
crawling allows Google to evaluate your pages in terms of response time, technical quality;
indexation which analyzes the content (news, richness, quality…) ;
ranking that analyzes your site’s popularity.
Crawling is one of the most important parts, it represents how Google is going to display your pages. The Google robots (also know as GoogleBots) are going to analyze each URL and index them. This is an iterative process: bots will come back frequently to analyze again these same pages and identify potential changes.
What is Crawl budget?
The efforts made by the Google bots to analyze your website will affect the number of pages that will be referenced, the frequency of future verifications, as well as your website’s overall rating. Google’s algorithm is, indeed, dictated by a set “maximum effort limit” named crawl budegt. Google defines it as follows:
Crawl rate limit Googlebot is designed to be a good citizen of the web. Crawling is its main priority, while making sure it doesn’t degrade the experience of users visiting the site. We call this the “crawl rate limit” which limits the maximum fetching rate for a given site. Simply put, this represents the number of simultaneous parallel connections Googlebot may use to crawl the site, as well as the time it has to wait between the fetches. The crawl rate can go up and down based on a couple of factors: Crawl health: if the site responds really quickly for a while, the limit goes up, meaning more connections can be used to crawl. If the site slows down or responds with server errors, the limit goes down and Googlebot crawls less. …
In other words, Google doesn’t want to spend too much time on your website, so it has time to review other sites. As a consequence, if it detects a slowness of performance, the analysis will be less extensive. All pages will not be indexed, Google will not come back as often, so as a result: your ranking will decrease.
To explain this budget phenomenon we could also say that crawling costs in server resource to Google, and this transforms in an actual cost. Google is not a philantropic institution. It is understandable that a company wants to limit its operational costs, such as crawling. In the same time it is also a way to limit the operation’s environmental impact, which is a big deal for Google.
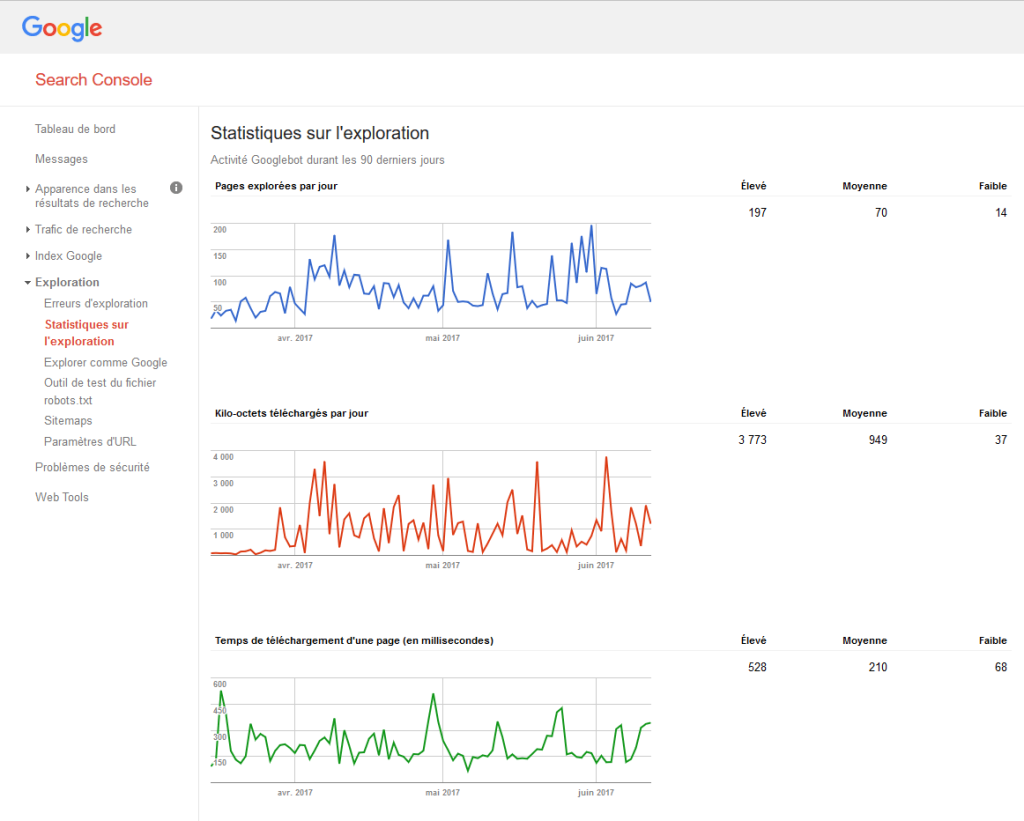
Know where you stand
Now we proved it is necessary to watch the crawling budget and the way Google analyzes your website, it is good to know you can do so in different ways.
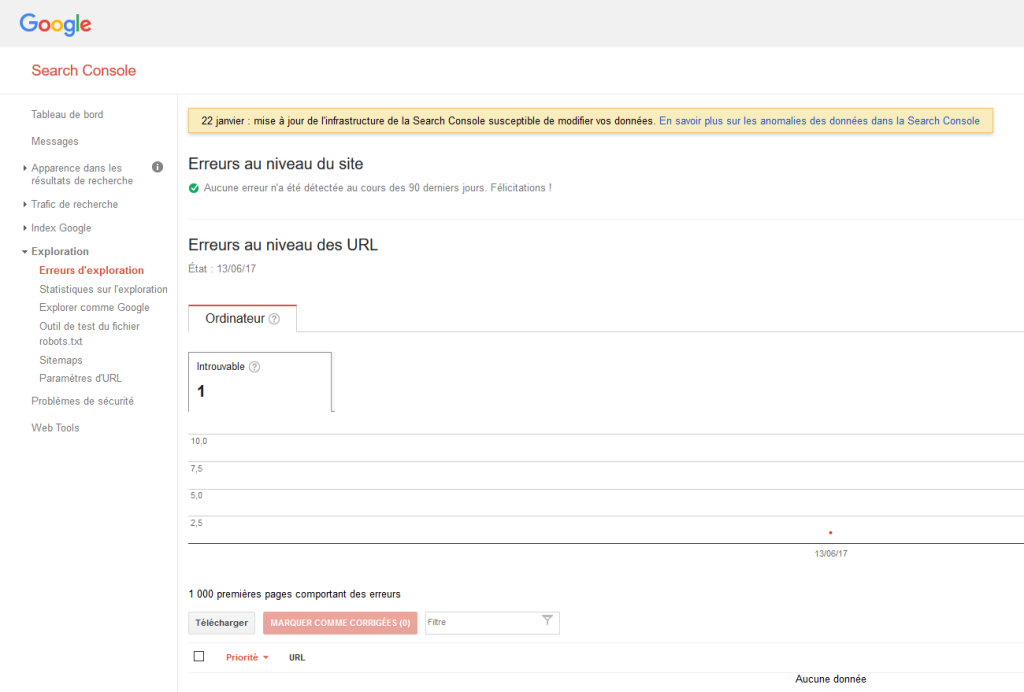
The error window Crawl-error is rather important: it will indicate you the errors the robot encounters during the crawl.
It exists several types of errors but if a page is too slow to load an error message will appear for sure (bot timeout). I shall remind you Google has better better things to do and doesn’t want to spend too much time crawling your website. You will find more information on errors here.
Here is the list of robots taken into account in Google Search console‘s crawl budget.
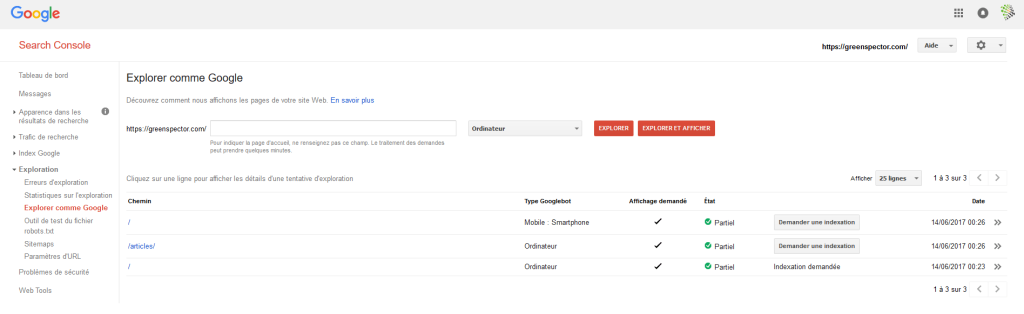
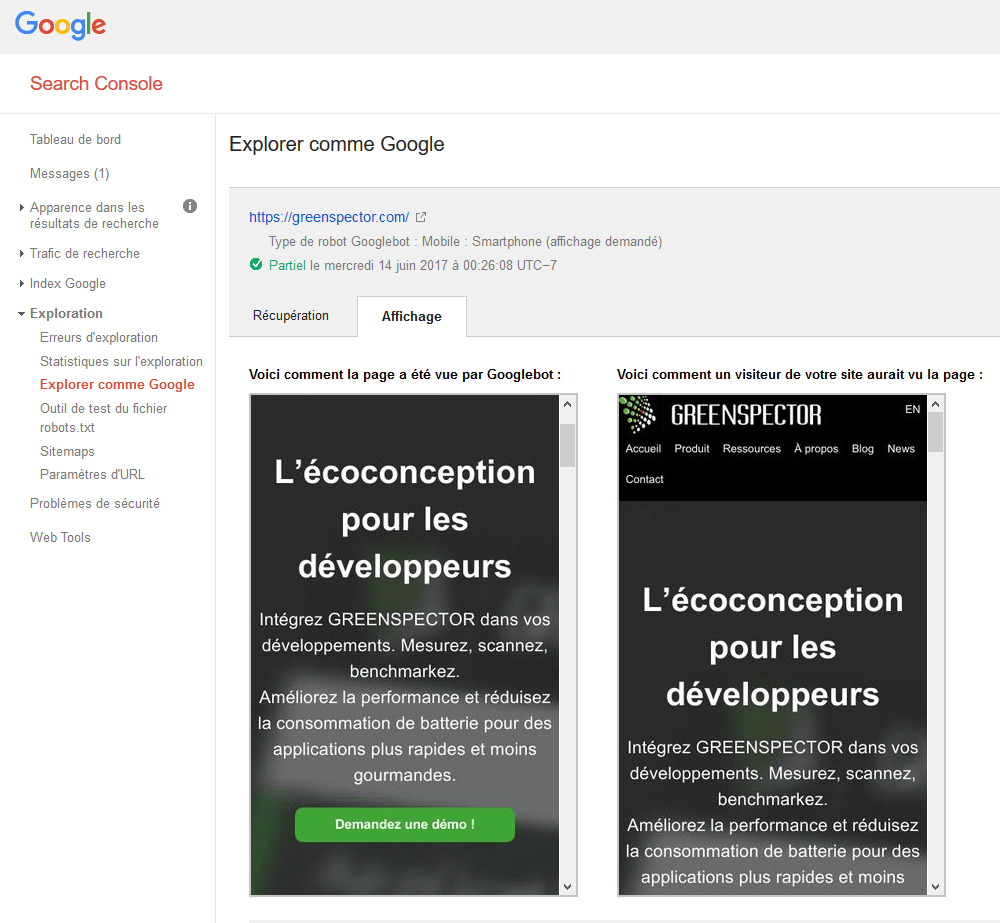
Finally, you can simulate the way Google is going to “see” your page. Head over to the Google Search console, and use the option Fetch as Google.
Now you know how Google crawls through your site and sees it. Whether the results are good or bad, referencing is never set in stone and you need to continuously work for it. We will see how to improve this.
Improve the performance
Server’s response time
As you may have understood by now, GoogleBot behaves like an actual user: if the page takes too long to load, it will give up and go on another site. A satisfying performance will lead to an increased number of pages crawled by Google. A faster loading will leave the bot with time left to crawl further more pages. As it is more deeply indexed, your website will be better referenced.
Reduce excessive page loading for dynamic page requests. A site that delivers the same content for multiple URLs is considered to deliver content dynamically (e.g. www.example.com/shoes.php?color=red&size=7 serves the same content as www.example.com/shoes.php?size=7&color=red). Dynamic pages can take too long to respond, resulting in timeout issues. Or, the server might return an overloaded status to ask Googlebot to crawl the site more slowly. In general, we recommend keeping parameters short and using them sparingly. If you’re confident about how parameters work for your site, you can tell Google how we should handle these parameters.
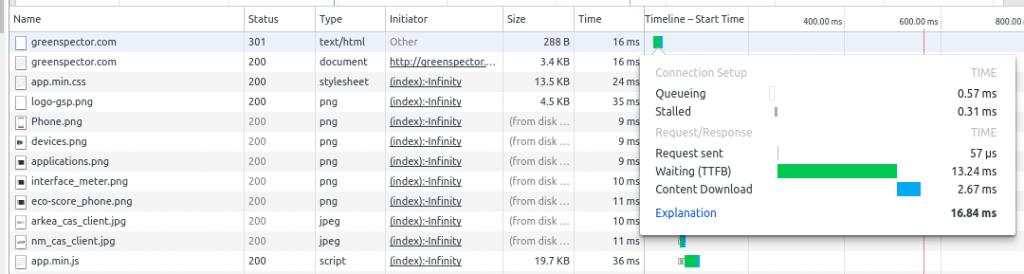
The first limit to respect: don’t exceed a certain amount of response time on the server. A “certain amount”? Pretty hard to set a threshold! However, you can at least measure the performance with an indicator like the Time To First Byte (TTFB). It represents the time between sending out the request to the client and receiving the first byte back as an answer to the request. The TTFB takes into account transfer time on the network as well as the server processing time. The TTFB is measured by the usual performance management tools. The easiest way is to use development tools embedded in browsers:
A basic threshold would be between 200 and 400 ms. Have a look at the time you get and try to decrease it. How do to so you ask? A few parameters have to be taken into account:
Server’s configuration: If you are on a shared hosting, it is kind of hard to take actions. But my friends let me tell you, if you know the IT infrastructure Manager, go ask him!
Request processing: For instance if you are on a CMS like WordPress or Drupal, the time it takes to generate PHP pages and have access to the database have an important impact. You can use cache systems such as W3cache or a reverse proxy like Varnish for example.
Inefficient code on the server side: Analyze your code and apply good eco-design practices.
This way, your pages will be easier to access for the users and, more importantly, it will prevent Google from making crawl mistakes.
Display performance
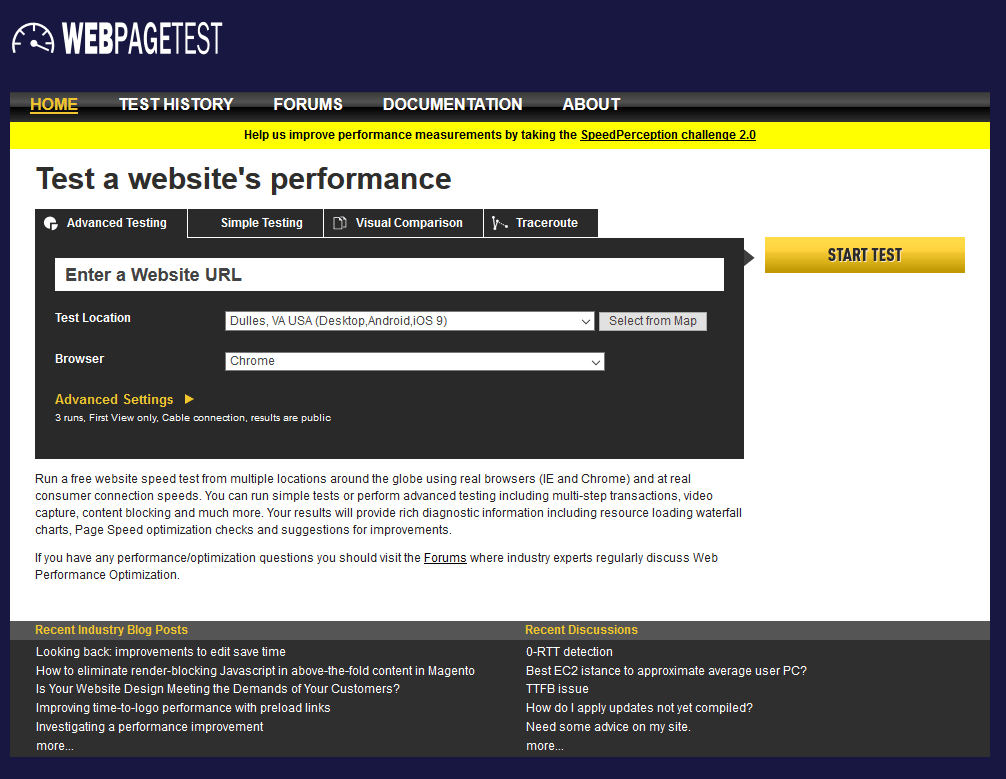
It is hard to tell how much Google bots take into account your page’s display speed but it remains an important characteristics. If the page loads in 10 seconds, bots will struggle to read the entire thing. How to measure that? Just like for the TTFB, developers’ tools come in handy. I also recommend to use Web Page Test.
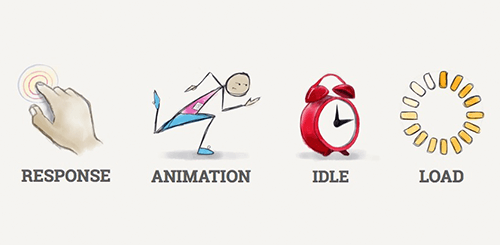
The idea here is to make the page visible and usable by the user as quickly as possible. As quickly as possible, I said? The RAIL model provides ideal times:
The letter R (for Response) in particular indicates a time inferior to 1 second.
To improve this, web performance domain has plenty good practices. Here are a few examples:
Use the client cache pour les éléments statiques comme les CSS. Cela permet lors d’une deuxième visite d’indiquer au navigateur (et aussi aux bots) que l’élément n’a pas changé et qu’il n’est donc pas nécessaire de le recharger.
Concatenate JSs and CSSs which would allow to reduce the amount of request. BUT this rule isn’t valid anymore if you are in HTTP2.
Try and limit the amount of request. We witness numerous websites with over 100 requests, which is costly for the browser in terms of loading.
We’ll touch back on web performance in a next article In the end, if you make your page more efficient, it will benefit both your referencing AND your readers!
Take things further with eco-design
Pure performance limit
Focusing on performance only would be a mistake. Bots aren’t your normal users; they are machines, not humans. Web performance mainly focuses on user experience (fastest display). However, bots see further than humans, they read all details of elements (CSS, JS,…). For instance, if you focus on display performance, you can potentially apply the rule that advise to defer some javascript codes at the end of loading time. This way, the page displays quite fast and processing can keep going. But as bots aim at crawling through all elements of a page, the fact that scripts are defered won’t change a thing for them and their analyzes.
Optimizing all elements is necessary, including the ones loaded after the page is displayed. And we will pay extra attention to the use of javascript. Google Bot can parse it if it makes effort, so each technology has to be used sparingly. For example, AJAX’s goal is to create dynamic interactions with the page: YES to forms or widgets loading… but NO if it’s only for loading content on a OnClick.
Facilitating GoogleBot’s work is pretty much working on all aspects of the site. The less elements, the easier it is. So: Keep It Simple! …
Eco-design coming to crawl’s rescue
Software eco-design mainly aims at reducing the environmental impact of software. Techniquely, it translates with the notion of eco-design: you have to answer the user’s need, by respecting the performance constraints; while limiting as much as possible the consumption of resources and energy. Software-induced power consumption (including your website) is the cornerstone of the process.
As you understood by now, bots have a budget based on a limited time capacity, but also an energy bill to limit for Google datacenters. Huh, funny! This is where we meet the goals of software eco-design: limiting this consumption. In that case, a perfromance-centered approach doesn’t fit: by trying to improve performance without keeping under control the induced resources consumption you’ll risk to get the contrary of what you first wanted.
So, what are the good practices, you may think? You can check out this blog blog and you’ll find plenty 🙂 But overall, I think no matter the best practices, what is the most important is the resources consumption. Are Progressive Web App (PWA) good for crawling? Is lazy loading good too? We don’t really care. In the end, if your website consumes little resources and is easy for the bot to “display” then it’s all good.
Energy measurement to control crawlability
One metric only encompasses all ressources consumption: energy. As a matter of fact, CPU load, network requests, graphics, etc will result in a power drain for the machine. By measuring and controlling the power consumption, you’ll be able to control the overall cost of your website.
Here is an example of power consumption of the website Nantes transition énergétique. There are 3 steps: website loading, idle in foreground and idle browser in the background. Numerous eco-design best-practices have been applied . In spite of that, a slider is on and consumption in idle mode remains high, amounting to 80mWh.
As we can see, the power consumption is the justice of the peace of resources consumption. Decreasing the power consumption will enable you reduce the GoogleBot effort as well. The ideal energy budget of a page loading is 15 mWh: it represents the value worth the Green Code Label “Gold” level. As a reminder, even though best-practices were applied, consumption was still reaching 80 mWh. After further analyzes and discussions with developers and project manager, the slider was replaced by a random display of static images: consumption dropped below 15 mWh!
Improving your page’s consumption and efficiency is good, however, it might not be enough. Next step in the process is to optimize the user path. The Bot is a user, with a limited resources budget, that needs to go through a maximum of your website’s URLs with that budget. If your website is too complex (too many URLs, too deep…) the machine won’t read the whole site, or at least not in one time only.
It is a necessity to make the user path simpler. And again, we are back at applying eco-design principles. You have to think, what are the functionalities a user really need? Because if you integrate useless functionalities, both the user and the bot will waste resources at the expense of elements that are actually important. Numerous analytics tools, animations all over… ask yourself if those functionalities are really worth it because the bot is going to anlayze them. And this will probably be done at the expense of your actual content that is indeed rather important.
For the user, it works the same: if getting an information or service requires too many clicks, it will be discouraged. An efficient path architecture will help the bot, as well as the user. Have a look at the sitemap to analyze the site.
Finally, applying eco-design to pages won’t be efficient if your site is complex. For instance, it is possible that, with numerous dynamic URLs, a good number of URLs will be detected by Google. As a consequence, you will get doubled URLs, useless content… A little cleaning of the site’s architecture might be necessary?
You can anticipate the way Google crawls your site, again, via the Search Crawl console, with the option Fetch as Mobile.
Google also offers a testing site in orer to know whether or not your website is mobile responsive.
Taking into account these #MobileFirst constraints isn’t necessarily an easy task. It might take some time and efforts, but this is the price to pay if you want to get a good referencing and ranking in the next few months. Plus, your users will be grateful for a website that doesn’t consume so much smartphone battery anymore!
Taking it further
Let’s quote Google : Googlebot is designed to be a good citizen of the web.
As a developer or site owner, your ambition is to become, at least, a web citizen as good as the Google bot. To do that, imagine using your website on a mobile platform, in specific conditions such as poor service or older device. By decreasing your site’s resources consumption, not only you will please the Google bot (that will reward you with a better referencing), but you will also provide the whole world (including “richer” countries) with an easy access to your website.
Don’t think this approach is charity. Let’s remind ourselves Facebook and Twitter already apply this with the “Light” versions of their respective apps.Example : Facebook Lite.
A website that is both mobile responsive and takes into account all mobile platforms and all connexion speeds should be valued by Google some time soon. Plus, the lighter the website, the less resources Google has to consume.
Just like for the user, the consumption and more importantly the environmental impact is becoming more and more important:
Pressure from NGOs to reduce its impacts, like the Greenpeace report
One thing for sure, a website that is efficient and focusing on users’ needs will be better valued on Google’s SEO ranking (and the others’).
Conclusion
Google referencing of your website is partly based on crawling: the robot goign through your pages. In order to do that, it has a set time and resources budget. If your pages are too heavy, too slow, crawling won’t be complete and your site will suffer from a bad referencing.
To avoid that phenomenon, frequently evaluate your site’s “crawlability”. Then, implement a progress process. To start, try and have a look at what you can get from the usual performance tools.
Then, think in terms of Mobile First: apply eco-design principles. Simplify the user path, reduce or eradicate useless functionalities. Measure your power consumption and control it. After a few efforts you will get a better referenced website, that is more efficient and better liked by the users.
Today, too many website are on the dark side of overconsumption (too many requests, useless scripts…). It is urgent people anticipate the evolution of Google’s referencing algorithms, that now have the same objectives as users while asking for more performance AND less power consumption: overall, efficiency.
Digital Sobriety Expert
Books author «Green Patterns», «Green IT – Gérer la consommation d’énergie de vos systèmes informatiques», …
Speaker (VOXXED Luxembourg, EGG Berlin, ICT4S Stockholm, …)
Green Code Lab Founder, ecodesign software national association
GREENSPECTOR is a tool detecting software’s behaviors which have an impact on resources consumption (energy, memory…). In order to do that, we use a set of techniques allowing the developer to be furthermore precise in its observations, thus leading to greater gains with fewer efforts. Code analysis and recognition of consuming patterns are part of these techniques.
Most of the time, code analysis is mainly focused on a syntactic recognition (as we can see in an IDE – Interface Development Environment – whenever we code and the IDE offers another type of writing). At first, we were using these basic code analysis techniques but results didn’t seem convincing to us. We were obtaining too many violations (a developer could have drown in that amount of violations!), and sometimes false-positives. But more than that, basic syntactic rules couldn’t detect extensive rules (the ones having an impact on resources consumption) like the Wakelocks recognition on Android. This is the reason why we chose to go with another analysis technique. Here are our feedbacks.
Language-written source code analysis came out in the fifties, and, very early on, people could see the stakes it represented. Indeed, LISP, one of the first languages (1956), is by definition self-referential and let programs analyze themselves. When personal computers got democratized, it took only a decade for IDEs to appear on the market, like Turbo Pascal by Borland, which offered more and more assistance services to programmer. In the meantime, Emacs was leading the way: code analysis (thanks to LISP), color code, etc… Analyzing the source code while it’s in the writing phase is now an integral part of a development environment implemented for a project initiation: Jenkins, Eclipse keeps offering more and more efficient services. GREENSPECTOR is one of these assistants which help developers write an app that is more efficient in terms of power consumption.
Dig in code bowels
GREENSPECTOR offers, among other things, to analyze the source code. The goal is to find ways of writing which could be improved in terms of execution performance, memory consumption or network consumption. Because these three factors have a great impact on a smartphone’s consumption, this improvment process allows your client to enjoy using its smartphone all day long.
Hello world pattern recognition
Let’s illustrate with a super easy example! You all can admit it is smarter to write this :
var arraySize = myarray.length;
for (var i = 0 ; i < arraySize ; i++) {
    aggr += myarray[i];
}
than this:
for (var i = 0 ; i < myarray.length ; i++) {
    aggr += myarray[i];
}
In the second example, we would use the length method for each test loop. In a chart with a rather important size, using this method can become costly.
AST
Obvisously we cannot analyze the code’s raw text, but it is possible for a data representation adapted to manipulation by programming. We call this representation AST, which stands for Abstract Syntax Tree. The name speaks for itself, an AST is a tree… And we will see later on why it is important.
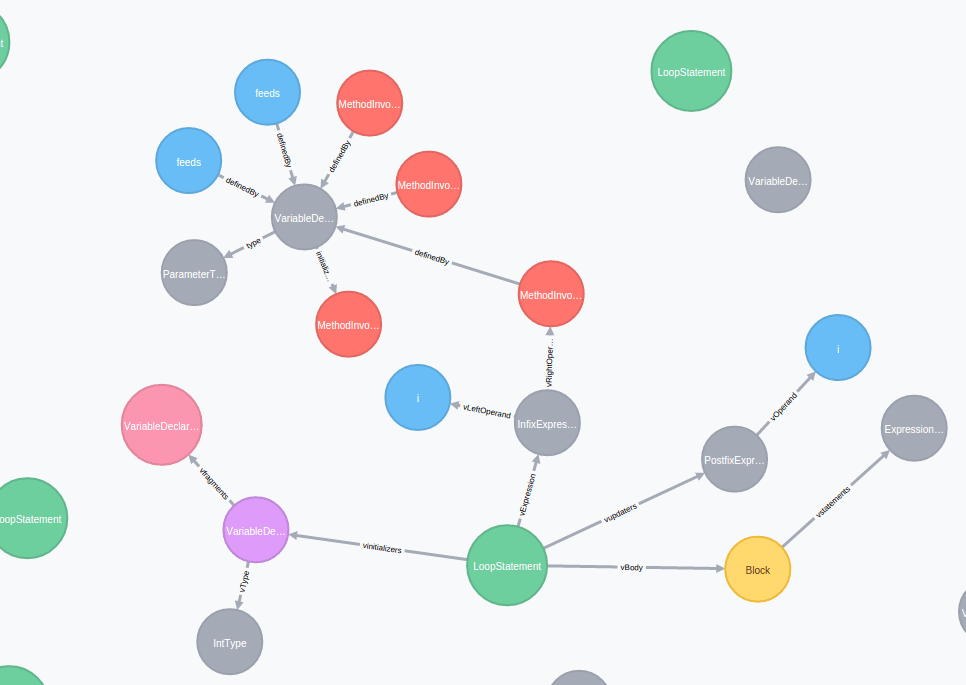
The AST of our first bit of code could look something like that:
Getting this AST is not an easy task. In Java, we have access to JDT and PDT, respectively for Java and PHP. These libraries are proven, and, even if they are a bit tricky to apprehend and they might seem illogical from time to time, they remain efficient.
We, at GREENSPECTOR, chose to use Scala to build our code analysis tool. Scala, the power of functional with the advantages of JVM. In order to perform analyses on the AST, we wrote our own grammar in Scala, which is a mapping of JDT or PDT grammars. This grammar, using Scala’s case classes, allows us to benefit from a pattern matching. that this language stole from OCaml, when it was initiated.
This is how a variable assignment is defined under Scala:
case class AssignmentJava ( id:Long, vRightHandSide : JavaExpression, vLeftHandSide : JavaExpression, vOperator : JavaAssignmentOp, lne : (Int,Int)) extends JavaExpression
Whereas a pattern-matching (sort of a switch-case on steroids) on this structure looks like that:
case AssignmentJava( uid, vRightHandSide, vLeftHandSide, vOperator, lne) => ...
On the right, we can do whatever we want with uid variables, vRightHandSide, vLeftHandSide, vOperator, … This way of doing is very effective to analyze a tree.
Spot the problems
Now we have a tree, we will need to detect problematical spots that we will report to the user. Problem is, you never know what specific problem is going to be reported. As a consequence, writing this recognition in the Scala program, with the pattern-matching, is not really flexible as you have to keep changing the program. Plus, it is not the easiest to write.
As any good lazy person would have done, I searched for the easiest method. Actually, I lied: if you’re lazy, Scala and the pattern-matching is not suited for you. Yet, who says simplicity, means request. There you go, we need a query language! Like SQL or the regexp ones, something you just describe whatever you are looking for, and BOOM, there you have it, brought to you by the system!
Graph database
Fortunately, the always-more-abundant world of open source came to the rescue: Neo4j is a graph database server. Even though it is more suited to analyze who your Facebook friends are or who you discuss with on Twitter, we can still use it for a very simple reason: a tree is a graph’s particular case! But above all, Neo4j is equipped with THE perfect language for a lazy person: Cypher. Cypher is Neo4j’s query language and was specifically made to find any information in a graph.
Hence the idea to integrate our AST in Neoj4 and to use Cypher to find what we look for.
Finding coding mistakes
Most of the time it is only 20% of the code that mobilizes 80% of the CPU!
An AST is just the tree representation of a text, the amount of semantic information remaining limited. We need to increase the code’s semantic density in order to analyze more precisely the code and detect interesting patterns that could be hard to see. To do that, we will turn our tree into a graph, by creating links between our AST elements. For instance, we can connect knots like “Functionality Declaration”, that way we can know what function calls what function. Obviously, every single one of these calls will be connected to the position where the function is called.
We call this the “Call Graph”, and let’s mention that this construction is easier to do in some languages than others. This way Java, thanks to its structure and its mandatory declarations, allow us to retrieve the call graph more easily than languages like… let’s say Javascript or PHP 😉
Difficulty lies in not picking the wrong call: how many different methods are going to be named ‘read’ for instance? Well, potentially a lot of them. You have to make sure you are connecting the two correct functions, and to do so, you need to determine the type of caller, in object-oriented languages.
Knowing the call graph, combined with other analyses, is a way of being aware of what part of the code runs the most often. Most of the time you can sense it, but you don’t always know fore sure, and often, less than 20% of the code mobilizes 80% of the CPU. By acknowledging the most-executed parts of the code, we can draw the developer’s attention on specific optimizations doable on critical portions of the code.
It works just the same to save memory, you have to use the variables you declare in a smarter way. By retrieving declarations and the links with their use you become capable of indicating how to optimize memory usage.
Let’s pick an easy example to illustrate what we just saw, the helloworld of pattern recognition. Often, in java, we observe loops simply iterating a chart, verifying the index is strictly inferior to the chart one. This example has room for improvement; indeed, using the .size() method is costly and could be “cached” in a variable.
The cypher language we were mentionning earlier allows us to detect this type of code:
“`match (n:LoopStatement) where n.loopType = “ForStatementJava” with n match (n)-[:vExpression]->(i:InfixExpression)-[vRightOperand]->(m:MethodInvocation) where m.methodName = “size” return n;
Basically, we ask it to find a classic “for” in Java with a call for size() method in the “for” updater.
Conclusion
Representation in editable graph form provides a better flexibility for the code analysis. It permits to analyze the code with a chosen level of complexity in the anlysis; it also constantly improves the quality of the code analysis. Thanks to the simplicity, power and intuitiveness of GREENSPECTOR, Cypher query language was adopted very quickly and the skill improvement heppenned fast! Now, our rules are way more coherent with way less false-positives. But it’s your turn to check it out and launch a code analysis with GREENSPECTOR! We, on the other hand, still have to explore all this architecture’s possibilities, which will allow us to realize analyzes of an even higher level (soon!).
Digital Sobriety Expert
Books author «Green Patterns», «Green IT – Gérer la consommation d’énergie de vos systèmes informatiques», …
Speaker (VOXXED Luxembourg, EGG Berlin, ICT4S Stockholm, …)
Green Code Lab Founder, ecodesign software national association
Webp is the new image format offered by Google, who promises a reduction between 30 and 80% in transfer size. In addition, this format would be more suitable for current processors. But what should we expect in terms of energy consumption on the user’s device?
Webp format
Webp is a matrix format just like PNG or JPEG. It can handle lossless compressions like PNG, as well as lossy ones like JPEG. This type of format is currently acknowledged by Chrome, Chrome for Android and Opera. Cependant However, the controversy was started by the Mozilla foundation which considers the format isn’t as beneficial as claimed.
By the way, Mozilla is working on its own on JPEG optimization : MozJPEG. Here’s a link to understand how to manage those implementation issues : Google WebP Now, what’s up with this new format’s efficiency? The measure of consumed energy needed to display images will answer this question!
MEASUREMENT METHODOLOGY
In order to do that, I use my favorite tool (you know what’s coming, right?): the Power Test Cloud service by GREENSPECTOR.
Methodology is the following :
Measurement is realized on a real smartphone, a Nexus 6, hosted and managed by GREENSPECTOR ;
We start Chrome and have then access to image examples provided by Google ;
We repeat the process twice, because two measures are always better than one.
Before going further, we have a couple points of criticism about our own protocole :
We are using Google images : are they really representative? We’ll assume so.
We evaluate the unit cost of displaying images, not integrating them in a more general webpage. That is why we are here for after all.
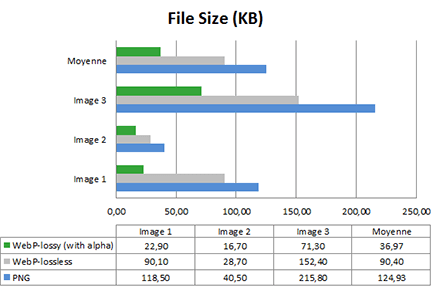
Format comparison : Webp (lossless and lossy) versus PNG
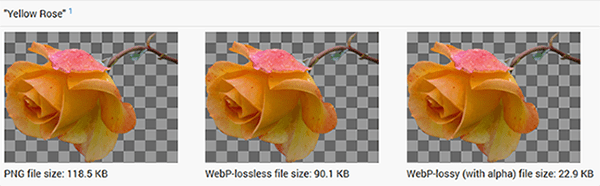
For this test, we picked the three first images in the Google gallery. First of all, let’s check the images’ size :
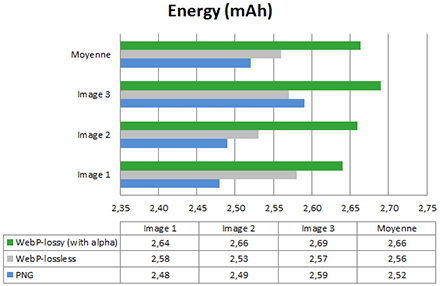
Result is pretty obvious : Webp images are on average 27% lighter than PNG, it even reaches 70% for the lossly version. Promises are kept and respected so far. Let’s have a look at energy consumed on the smartphone whenever it displays those images in the browser :
Aoutch. On average, WebP lead to 1.5% more energy consumption. There is a gain only for image 3 – just when we compare the lossy Webp with the PNG. Regarding image 1, we notice a decrease of 3,8%. Finally, we can see that the lossy Webp with transparency is even more energy-hungry than the lossless Webp. To me, that’s pretty surprising!
In the end, the PNG format is more interesting in terms of energy consumption. However, if you focus on network gains only, then the Webp format will be more appropriate. This statement is even greater when it comes to the lossy Webp with transparency. This could be explained with a rendering algorithm less efficient than PNG, which cancels all energy gains provoked by the nettwork impact reduction.
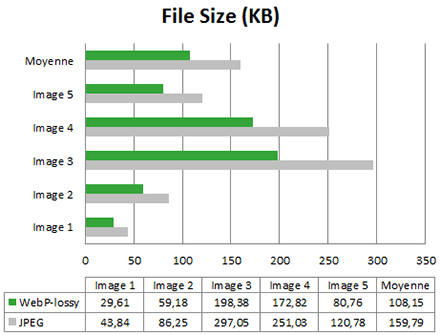
“Lossy” format comparison : Webp versus JPEG
For this test, we chose five images from the Google gallery Again, let’s check first images’ size.
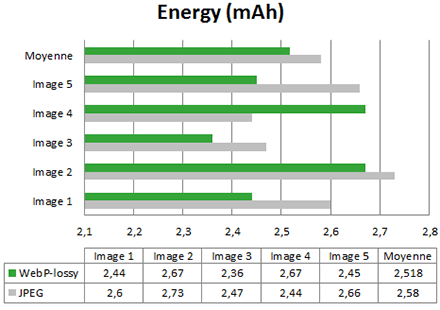
Once again here promise is respected: the size gain brought by Webp is on average 30%. Now let’s have a look at energy consumption.
In 4 out of 5 cases, gains brought by Webp compared to JPEG are interesting (between 2% and 8%). Because of the specific case of image 4, the gain average settles at 2.4%.
If we look more in depth at energy consumption curves, we can notice that the Webp consumption peak is the lowest one of all:
We also observe that Webp solicits less battery than JPEG.
CONCLUSION
It is obvious that the Webp format allows a lower image size than the other formats. It is beneficial for the internet network as a whole, telecom operators in particular and final users even more specifically.
We also identified energy gains for lossy images going up to 8% compared to JPEG. However, in some minority cases for the lossy and in all cases for the lossless, we noticed bigger energy consumptions for Webp than for other traditional formats. In the case you want lossless images (for logos, images with text…), then PNG remains the best option in terms of energy.
Explanation : as images are lighter, it seems like the radio cell is less solicited thus there is less energy consumed. However, when we have a look at the CPU occupation, Chrome spends some time processing to decompress Webp. On a smartphone, network gains are limited, borderline annihilated, because of the additional CPU treatment cost.
Conclusion following the conclusion : Gains in size brought by Webp are real for the network. Associated with an energy consumption decrease, even weak, it makes WebP an interesting format in terms of efficiency as an alternative to JPEG. However, we will have to wait for the alternative to PNG.
Lastly, let’s note that jobs are numerous in this domain. Thus, for the alternative to JPEG, a convergence towards other technological ameliorations like HTTP2, could lead to even greater gains.
Digital Sobriety Expert
Books author «Green Patterns», «Green IT – Gérer la consommation d’énergie de vos systèmes informatiques», …
Speaker (VOXXED Luxembourg, EGG Berlin, ICT4S Stockholm, …)
Green Code Lab Founder, ecodesign software national association
Controlling the energy consumption is becoming more and more critical when developing mobile applications. Recent versions of Android integrate for instance a doze mode in which the smartphone shuts down treatments to only wake them up periodically, however it is not sufficient and application developers still have a role to play.
At the application level, a good start to improve the energy consumption is the choice of appropriate data structures.
Digital Sobriety Expert
Books author «Green Patterns», «Green IT – Gérer la consommation d’énergie de vos systèmes informatiques», …
Speaker (VOXXED Luxembourg, EGG Berlin, ICT4S Stockholm, …)
Green Code Lab Founder, ecodesign software national association
If you ever decided to create a mobile application, you may have looked at Apache Cordova. This technology allows developers to easily write one set of code to target nearly every mobile platforms on the market today and publish to their app stores without worrying about specific constraints.
Technically, Apache Cordovawraps your web application’s HTML/JavaScript code into a native container which can access the device functions of several platforms. These functions are exposed via a unified JavaScript API. So if you want to develop a mobile application targeting multiple devices/OS, Cordova is powerful and seems to be a tool of choice, but have you ever wondered what is the cost of a Cordova application? As Uncle Ben said once, “A great power comes with great responsibilities”, and this is precisely what we’re going to find out!
Today we will dive in the measuring of resource consumption of a basic Cordova application and compare it to its native equivalent. To keep things simple, we will focus on “Hello World” applications. All measures have been made using the GREENSPECTOR Benchmark Runner on a Google Nexus 5 running Android 5 Lollipop. This tool offers to the developer the possibility to launch measures from automated and standardized test cases on any mobile application or website. Before going further, let’s explain a bit about the test cases:
Reference: collects metrics while there is no application running. This is a kind of telltale measure where there is only the operating system consumption.
Launching of application: collects metrics while the application is launching.
Idle in foreground: collects metrics while the application runs in foreground.
Idle in background: collects metrics while the application runs in background.
The cost of a native application
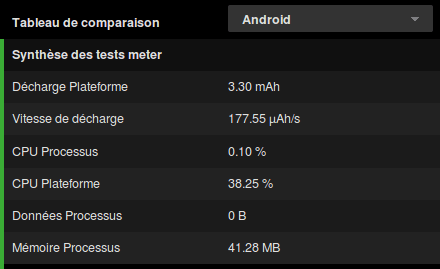
In order to have something to compare with, we will first measure the cost of a native Android app. Here are the results of the measures:
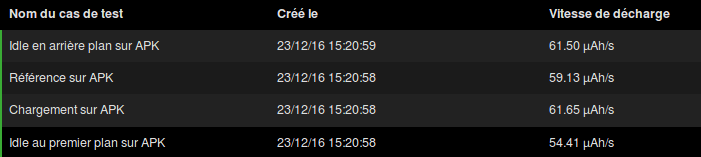
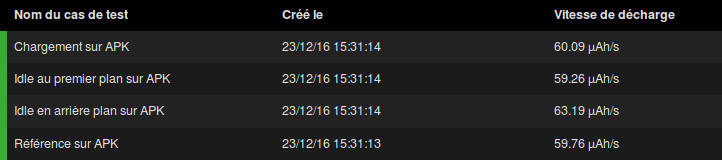
There are three interesting metrics here. The discharge, 3.30mah, corresponds to the total amount of energy consumed during the test. The discharge/second (in mAh/s) represents the discharge speed, and then we have the memory allocation. Let’s see the details of the different test cases:
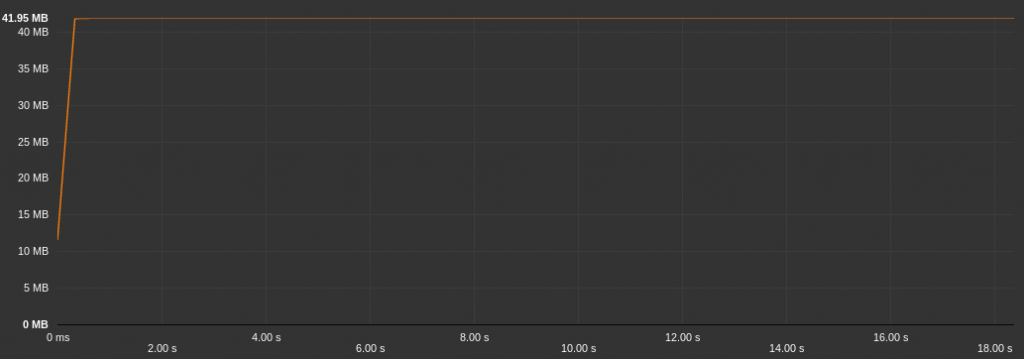
We see we have loading and idle values around 61.50µah/s which is quite on par with the reference value 59.13µah/s. This is surprising but makes sense, because our application is an empty shell and not doing anything at all. Interesting things will start when we’ll look at the memory footprint.
The above graph shows the memory allocation while loading the application. As we can see, the Android Operating System needs about 42MB of memory to load and display an application as simple as an “Hello World”!
What about Apache Cordova ?
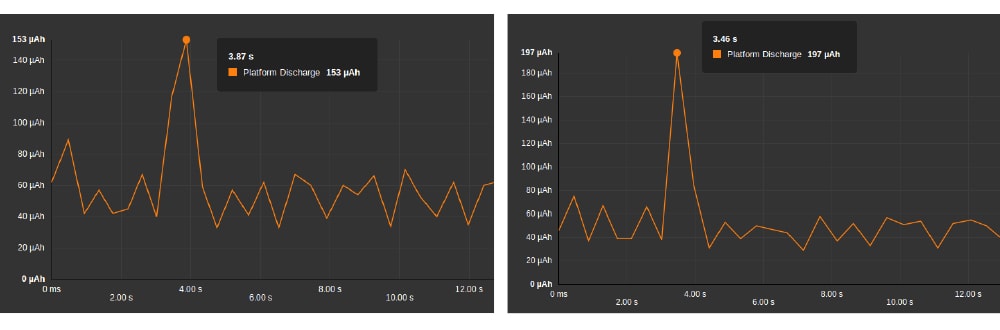
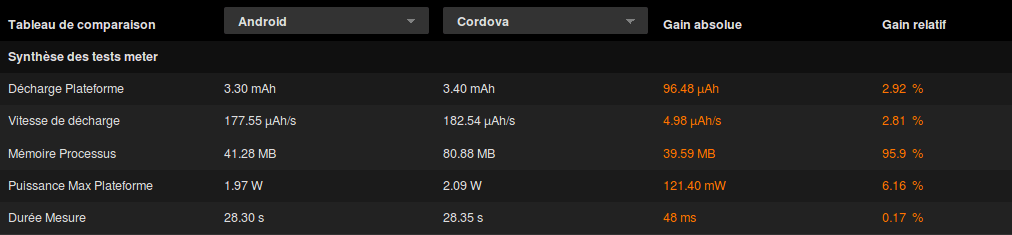
Now that we have seen how much resources are needed for a minimal native Android application, we can finally look at its Apache Cordova equivalent following the same methodology as before:
What do we see ? First, the energy consumption seems slightly higher (about 2.50% more) on the Apache Cordova version of the application, but honestly, if we look at the detailed Cordova test cases below, this is still on par with the reference measure.
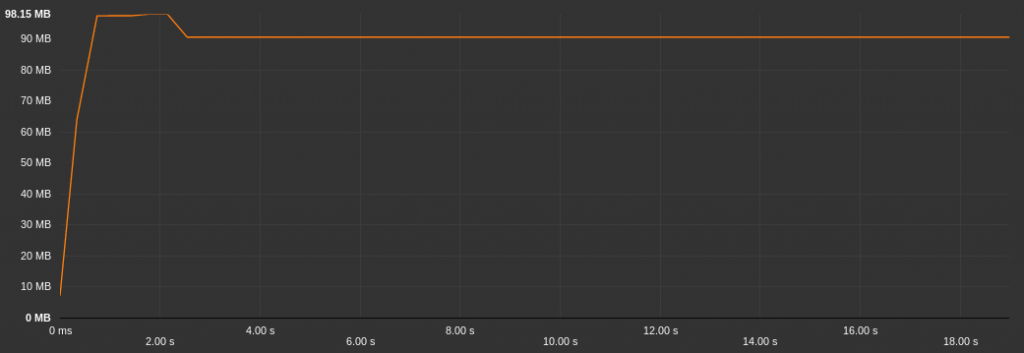
But you should have noticed another thing. The Cordova “Hello World” needs twice as much memory than the native one! Check by yourself the memory allocation graph during launch step below:
This behaviour could be explained. Indeed, while the application is launching, the Operating System loads the bare minimum of an Android application plus the Webview and all of the Cordova’s and plugins javascript code is evaluated, then, our application’s code is loaded in the browser and parsed. This is the price of the “write once run anywhere” philosophy behind Cordova.
Bonus: Crosswalk
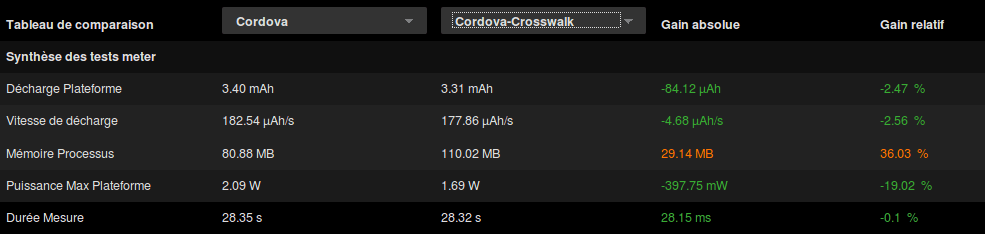
We see more and more Cordova projects using Crosswalk which embed and uses a custom web runtime in the application instead of the System WebView. It has lots of benefits and can help ensure compatibility across platforms with the latest web features. Let’s see how it stands with our previous observations:
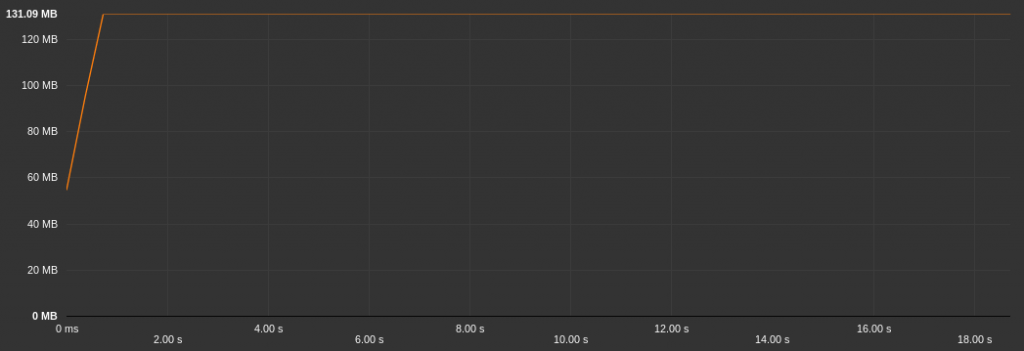
The energy seems at scale with what we have seen before so we will not take a look at details. Again, it gets interesting when we look at what happens in memory. The above table shows an increase of 30MB that is +36% compared to the Cordova version:
On the memory allocation graph above, we can see a stable tendency around 130Mb after the application has launched. If we look back at what we’ve learned before, Cordova alone consumes twice as much memory than the native version, but here, Cordova plus Crosswalk consumes three times as much memory!
Conclusion
Today we’ve learned about the initial resource cost that can be induced by Frameworks like Apache Cordova on your applications. Despite we did not clearly observe an impact on energy consumption, there is a big one on memory allocation. Keep in mind we only looked at “Hello World” applications doing absolutely nothing, but it help us understand one thing, you will carry this impact with you from the start of your project and can not do anything about it. So you should be careful and consider this while developing your application.
Those measures show it’s important to benchmark frameworks and libraries. If your application is composed of several APKs (as we see it more and more with our customers), this cost will become critical. Indeed, the cohabitation between those binaries will be hard and could lead to crashes or dysfunctions. Hence the interest of this benchmark to project a resource consumption of your target application. In any case, and especially if you choose a technology with an initial resource cost, it will be necessary to continuously measure the resource consumption to avoid deviating too much from this initial cost.
Digital Sobriety Expert
Books author «Green Patterns», «Green IT – Gérer la consommation d’énergie de vos systèmes informatiques», …
Speaker (VOXXED Luxembourg, EGG Berlin, ICT4S Stockholm, …)
Green Code Lab Founder, ecodesign software national association
In the numerical services industry, time-to-market has become a crucial criteria in terms of company competitiveness. Current development practices tend to be of a greater agility and deployment is more and more clustered. In this context and to answer this need, DEVOPS methods were created.
Digital Sobriety Expert
Books author «Green Patterns», «Green IT – Gérer la consommation d’énergie de vos systèmes informatiques», …
Speaker (VOXXED Luxembourg, EGG Berlin, ICT4S Stockholm, …)
Green Code Lab Founder, ecodesign software national association
The HTTP 1.1 protocol has been set nearly 20 years ago. With this text-based protocol, the main drawback in terms of performance and efficiency is the latency…
Digital Sobriety Expert
Books author «Green Patterns», «Green IT – Gérer la consommation d’énergie de vos systèmes informatiques», …
Speaker (VOXXED Luxembourg, EGG Berlin, ICT4S Stockholm, …)
Green Code Lab Founder, ecodesign software national association
Web developers know that third-party components can have a negative impact on the performance of web sites. It’s been the case for years. In 2010, Steve Souders wrote a blog post about this issue, mentioning third party components such as Twitter’s or Facebook’s. Many have followed up on that finding.
Digital Sobriety Expert
Books author «Green Patterns», «Green IT – Gérer la consommation d’énergie de vos systèmes informatiques», …
Speaker (VOXXED Luxembourg, EGG Berlin, ICT4S Stockholm, …)
Green Code Lab Founder, ecodesign software national association
It’s not every morning that an Android developer decides to challenge the core of their favourite OS. The AOSP (Android Open Source Project) code comes straight out from Google’s factories in Palo Alto. It’s not perfect, but it’s deemed effective and reliable enough to serve as the heart of more than 1.4 billion smartphones worldwide.
Digital Sobriety Expert
Books author «Green Patterns», «Green IT – Gérer la consommation d’énergie de vos systèmes informatiques», …
Speaker (VOXXED Luxembourg, EGG Berlin, ICT4S Stockholm, …)
Green Code Lab Founder, ecodesign software national association
Greenspector may use cookies to improve your experience. We are careful to only collect essential information to better understand your use of our website.
This website uses cookies to improve your experience while you navigate through the website. Out of these, the cookies that are categorized as necessary are stored on your browser as they are essential for the working of basic functionalities of the website. We also use third-party cookies that help us analyze and understand how you use this website. These cookies will be stored in your browser only with your consent. You also have the option to opt-out of these cookies. But opting out of some of these cookies may affect your browsing experience.