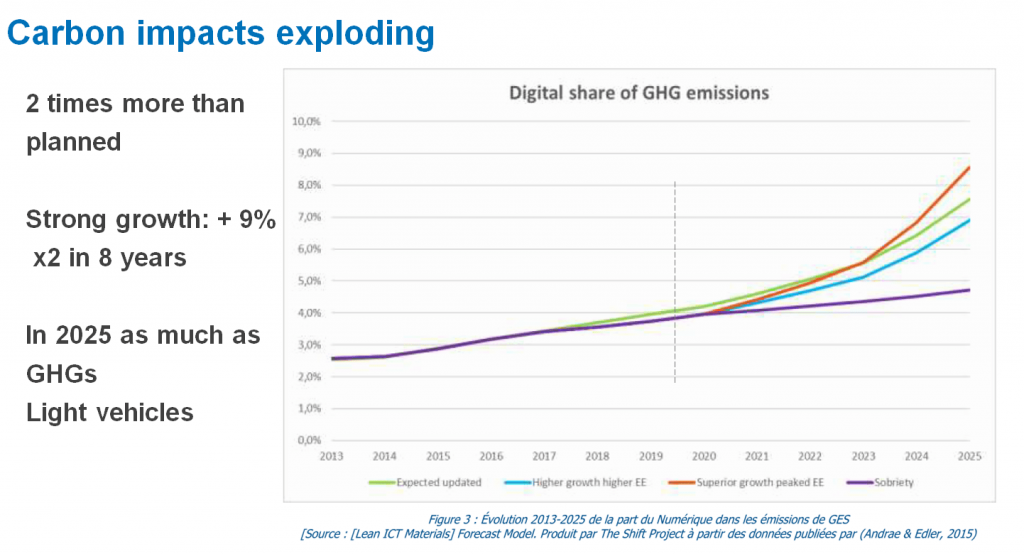
All our digital uses have an impact of energy consumption and in a more global way in technical resources (RAM, CPU, Data, …). The environmental impact of digital is today important and especially in strong progression. Today, according to the project shift * report, the impact of digital in terms of greenhouse gas represents 3.7% of total emissions (GHG) on the planet and could represent, according to the assumptions, between 7 and 8.5% in 2025, the equivalent of the GHG emissions of light vehicles on the planet (8% of GHG). This is reinforced by an annual growth of 8% which remains and will remain sustained despite technological progress.

Access to information, content and services is now predominantly done on smartphones, which has become the flagship of digital activity. We connect more and more, from everywhere, and at any time.
Today, the consumption of smartphones (including the use phase and the manufacturing phase) represents 11% of the digital energy consumption. Sensitive point of this energy consumption for the smartphone that is at the battery and is the focus of all our attention and those of smartphone manufacturers. We often accuse our smartphones of lack and / or loss of autonomy … Yet it is the applications installed on the smartphone that consume! … and which also degrade its battery capacity over time. Mobile applications are now used, for the most deployed, by billions of people (more than 5 billion mobile users). Today, an application like Facebook, the most popular, is used by more than 2 billion active users per month on smartphone. The impact of these applications is therefore considerable and a significant improvement in the sobriety of one of them can have rapidly very positive consequences on the ecological impacts.
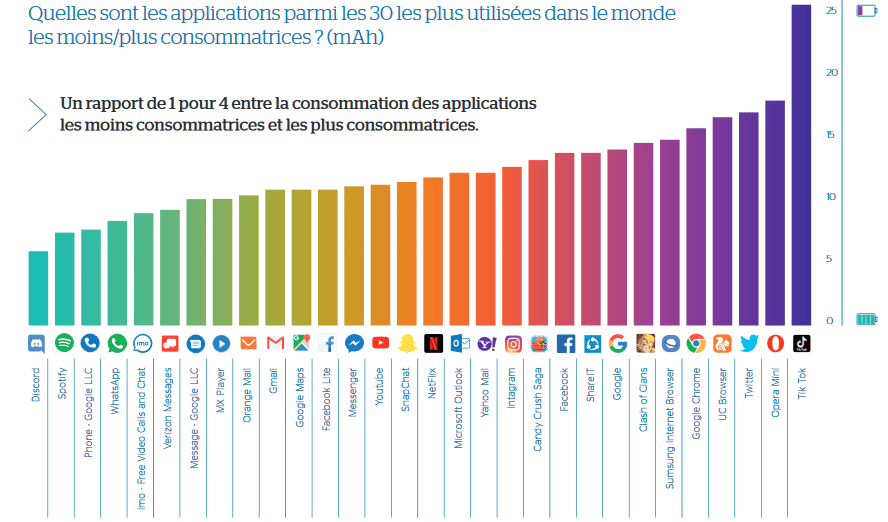
As part of the Vivatech 2019, with our partner ATOS, we wanted to raise the awareness of major digital players by benchmarking the consumption of resources and energy of the 30 most popular applications.

5 key points of this study
- The pre-loading of the time line data is consumption factor. The fact that this content is video type like TikTok makes it a consumer application for the device but even more so on the network and the datacenter. An ecological heresy when you know that this application is used by millions of people around the world..

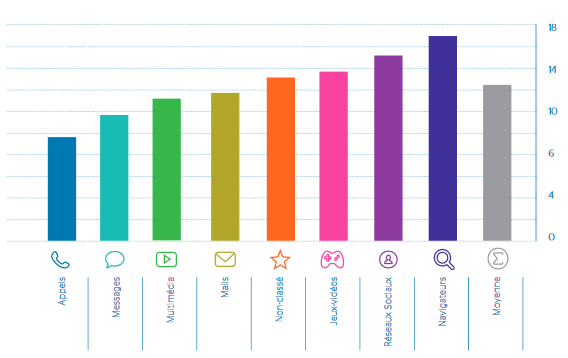
- Web browsing consumes a lot of energy because the pages include many scripts, more and more (trackers, advertisements, differentiating features, …) that are not well managed by the hardware of the smartphone. Calling consumes half the average on average than surfing.

- In each category of applications large discrepancies exist for near functionalities which can translate avoidable mess and thus gains of accessible optimizations. 30-40%?
- Yes, listening to music on Youtube is an ecological “mistake” when you know the consumption of a Spotify. Features “listening music without image” favored on video players are expected.
- The global electricity consumption of digital is at the scale of a continent (Russia + Japan combined), that of the use of applications on smartphones is that of a European country (equivalent to Ireland). 1/3 of gain conceivable when positioning the average of the category on the lowest consumption of the category (equivalent functionality). On a global scale, a nuclear slice avoided. For our smartphones, 2 to 3 hours of autonomy and more!

