For this week’s battle, we are comparing the Facebook application with its web version on Chrome. Note that the measurements were taken from an account connected to the social network.

L’application Facebook created in 2014 and founded by Mark Zuckerberg is an online social network that allows its users to post images, photos, videos, files and documents, exchange messages, join and create groups and use a variety of applications. In 2017, the social network had more than 2.1 billion subscribers.
The fight
All the lights are now turned on the fighters and the match can finally begin.
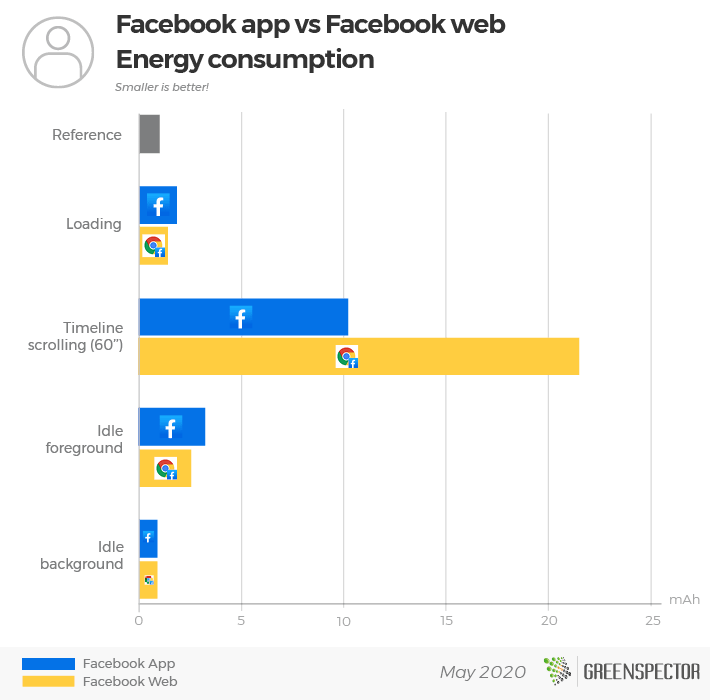
In the first part of the battle to measure the impact of the launch phase of the application, on this side it is the web version of Facebook (2.48 mAh) which wins the first round by consuming 30% less than the application (3,28 mAh). During the second round which corresponds to the usage scenario, it is the application version (10.13 mAh) which leads to that of the web (21.52 mAh) with a energy consumption lower than 53%. To put an end to this confrontation, we have set up two decisive rounds of observation of the rest phases of each opponent. The web version displays a consumption of less than 30% for the inactivity phase in the foreground but is the most consuming side of the inactivity phase in the background with 3% more than the application version.
The bell rings, end of the match!
The winner

It’s the web version of Facebook that wins this match. The Facebook application is the best in terms of energy consumption, with an overall score of 14.06 mAh to 26.33 mAh, i.e. 39% less battery consumption compared to its web version. However, the web version on Chrome displaying Facebook consumes 71% less data on the user scenario side.
If we project the journey for one minute in carbon impact, the Facebook application consumes 1.42 gEqCO2 or the equivalent of 12.71 meters made in a light vehicle against 1.06 gEqCO2 for the web version or the equivalent 9.48 meters. It is therefore the web version of Facebook that should be preferred!
For those who like numbers
| Application | Version | Downloads | Playstore grade | App weighting (MB) | Exchanged data (MB) | Memory consumption (MB) | Energy consumption (mAh) | Carbon Impact (gEqCO2) |
|---|---|---|---|---|---|---|---|---|
| 269.0.0.50.127 | 5 000 000 000+ | 4.3 | 227 | 12.56 | 321.45 | 16.06 | 1.42 | |
| Facebook via Chrome | 81.0.4044.138 | 5 000 000 000+ | 4.3 | 220 | 7.35 | 781.81 | 26.33 | 1.06 |
The measurements were carried out by our laboratory on the basis of a standardized protocol, respecting a specific user scenario (launch of the app, timeline scrolling). The other scenarios are the launch of the application (20”), inactivity in the foreground (20”) and inactivity in the background (20”). This methodology makes it possible to estimate the embedded application complexity and its energy impact during the use phase.
The Carbon Impact calculation is based on a projection according to the OneByte methodology of the Shift Project for the server and network part. Assumption calculated according to network and datacenter impact in France, for network connectivity 50% Wi-Fi, 50% mobile network, device life based on 500 full charge / discharge cycles.
Retrouvez la battle de la semaine dernière : Petit Bamboo vs Meditopia Des idées de battles ? Contactez-nous !
