The world of football is one of the most popular and influential sectors of our society. Millions of fans come together every week to support their favourite team and experience moments of passion and excitement. However, it’s time to be aware of the environmental consequences of this all-consuming passion. In this article, we will look at the eco-design practices of the applications of the 4 semi-finalist clubs in the 2022-2023 Champions League.


Calculation methodology
In our comparative study of the mobile applications of the 4 semi-finalists in the Champions League, we examined various aspects, such as the size of the applications, their compatibility and the greenhouse gas (GHG) emissions caused by their use. The results highlight significant differences between the applications, underlining the importance of implementing an eco-design approach.
First of all, the vast majority of a smartphone’s environmental impact is due to its manufacturing phase. A great deal of energy and materials, some of them rare, have to be used in the manufacture of the product. Consequently, to effectively reduce the impact of a mobile application, it is necessary to ensure that it does not force users to change phones in order to obtain a suitable user experience. This involves a number of criteria, including but not limited to the following:
- Compatibility: an application must be compatible with all users. For example, an application that is not compatible with a version lower than Android 8 would prevent 7.1% of Android owners from using the application.
- Battery use: battery wear and tear is one of the main causes of the need to buy a new phone. One of the factors that wear out the battery is the number of charge/discharge cycles the phone goes through. It is therefore essential that using the application does not require too much energy so as not to accelerate the draining of the battery.
- Performance: this criterion corresponds to the application’s response time. There are 2 reasons why this criterion needs to be taken into account. Firstly, the aim of an eco-design approach is to enable users who do not wish to renew their phone to have a pleasant user experience, even on older devices. Secondly, longer loading times mean more electricity used, and therefore faster wear and tear on the battery.
- Application size: this indicator has 2 different impacts. Firstly, when the application is downloaded, a large application requires more data to be exchanged. Secondly, users who want to keep their phone for a long time may have to deal with problems of memory shortage. In order to encourage this sobriety approach, the amount of memory used by the application needs to be as small as possible. In this article we will focus solely on the size of the application, but a sober approach must also be taken to all the data stored on the phone, such as good cache memory management.
During an environmental impact analysis at Greenspector, we examine all these points to provide recommendations that will enable our clients to gain an accurate picture of their situation and reduce their environmental impact.
Analysis of results
Comparison of application sizes
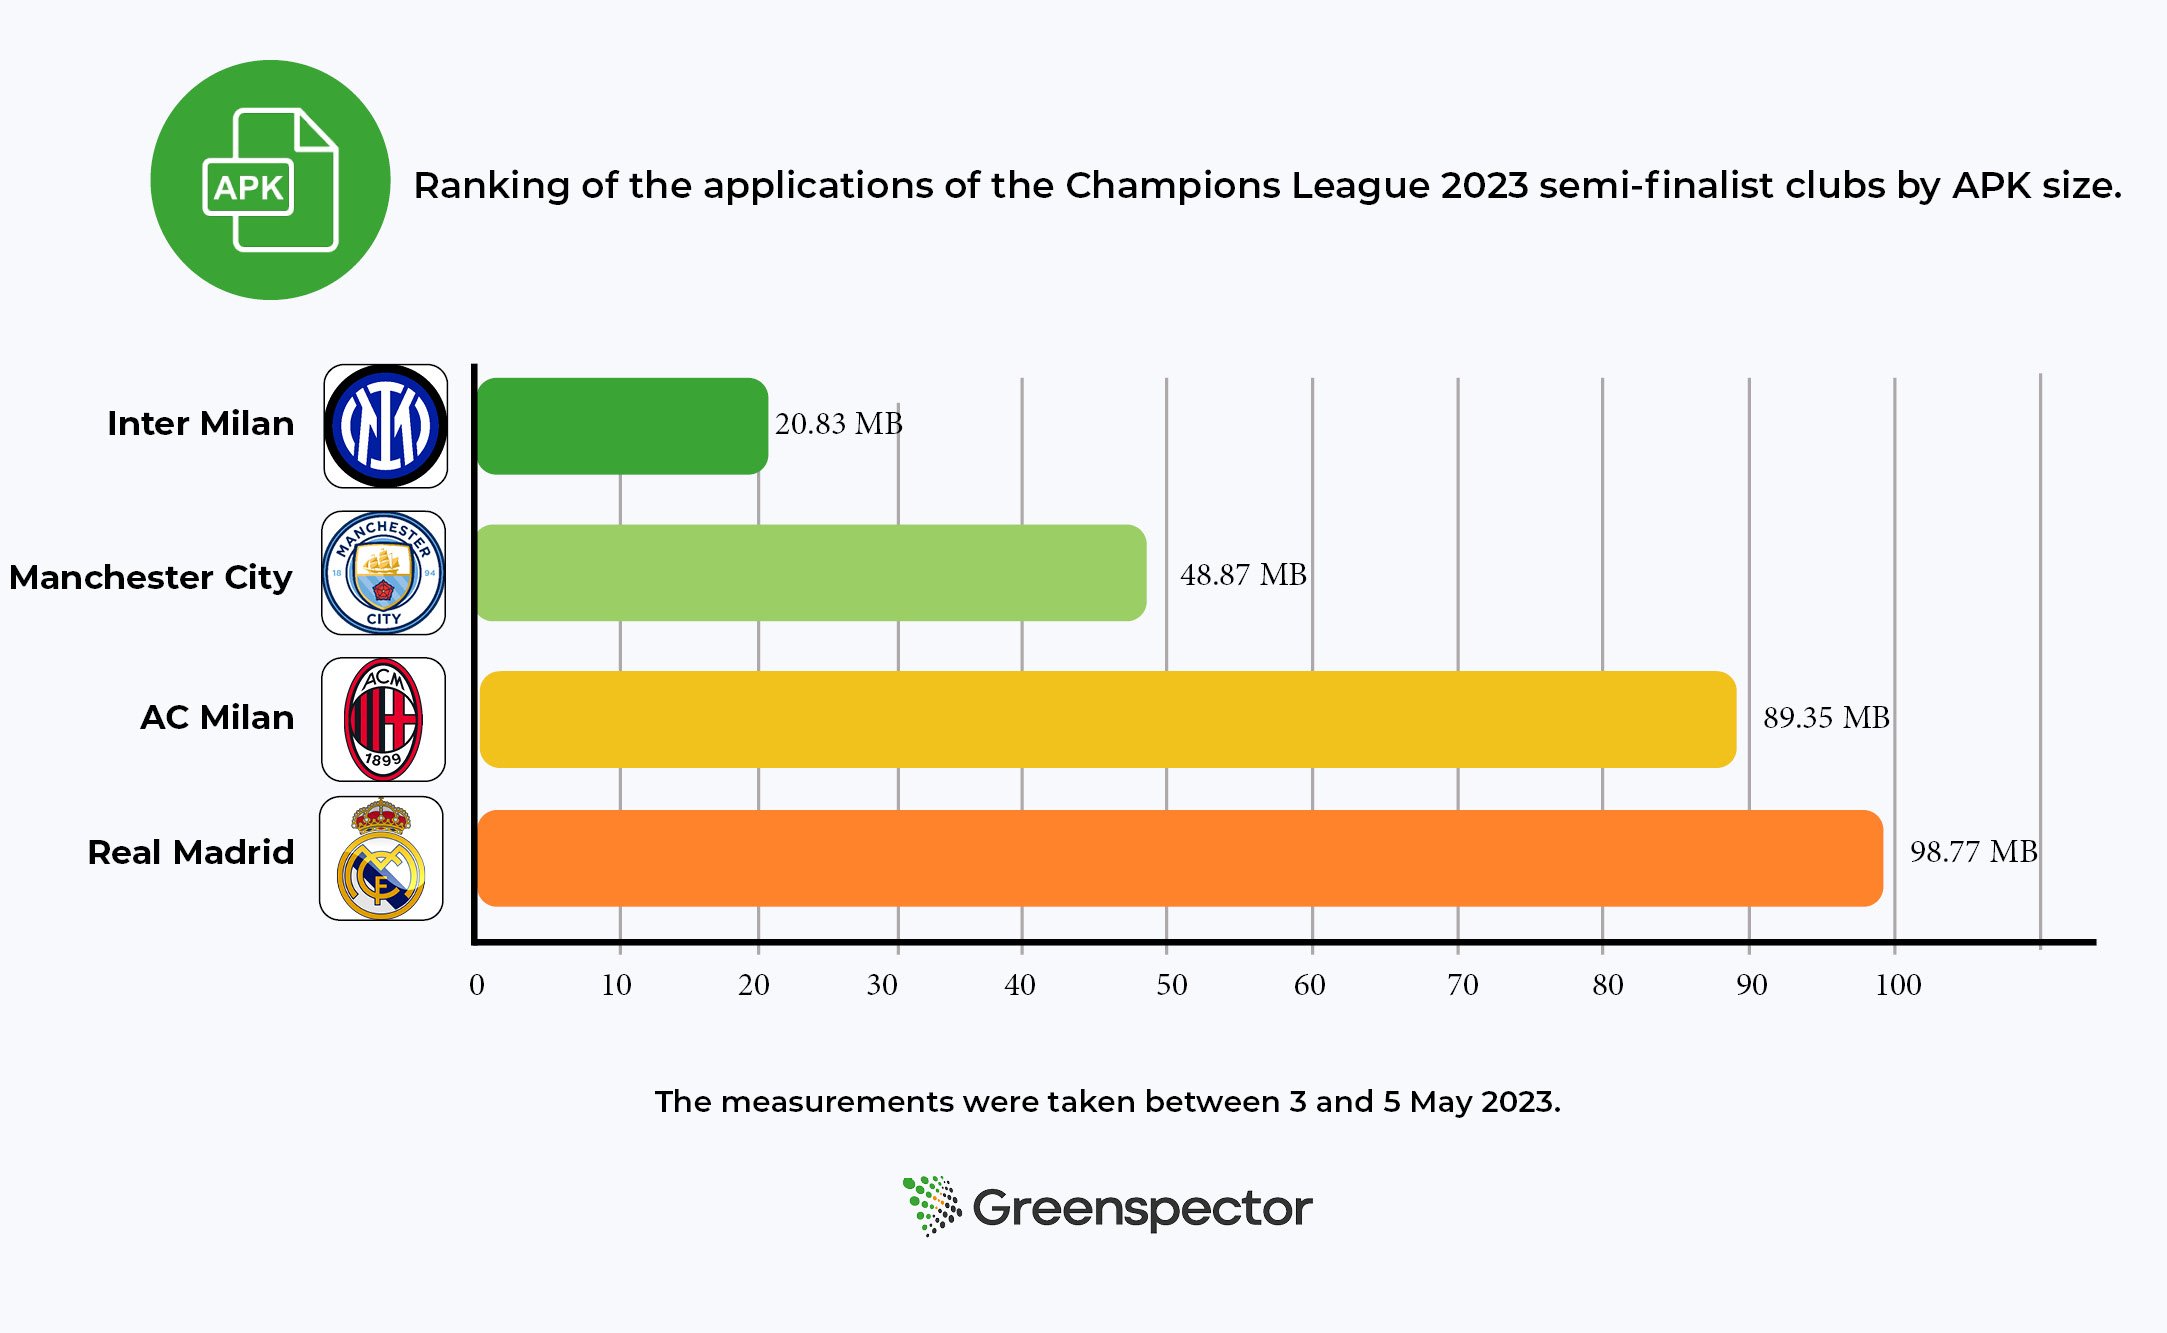
First of all, we evaluated the size of the APK files of the selected applications. We found considerable variations in their size, ranging from light, space-saving applications such as Inter Milan to larger ones such as Real Madrid. These differences can have an impact on mobile device storage memory and data consumption when downloading and updating applications.
The size of the application may vary depending on the phone. The following results were obtained with a Samsung S10 running Android 12.
Application compatibility comparison
Another key criterion we looked at was the compatibility of applications with different versions of Android. We found that some applications were designed exclusively for more recent versions, limiting access for users with older devices. This incompatibility often leads to frequent replacement of devices, which can waste natural resources and increase electronic waste.
| Position | Université | URL | Ecoscore (/100) | Impact Carbone (gEqCO2) |
|---|---|---|---|---|
| 1 | Princeton University | https://www.princeton.edu/ | 66 | 0.22 |
| 2 | KU Leuven | https://www.kuleuven.be | 73 | 0.22 |
| 3 | University of Manchester | https://www.manchester.ac.uk/ | 69 | 0.22 |
| 4 | LMU Munich | https://www.lmu.de/en/index.html | 72 | 0.23 |
| 5 | Heidelberg University | https://www.uni-heidelberg.de/en | 65 | 0.24 |
| 6 | University of British Columbia | https://www.ubc.ca/ | 58 | 0.24 |
| 7 | Northwestern University | https://www.northwestern.edu/ | 71 | 0.25 |
| 8 | Yale University | https://www.yale.edu/ | 61 | 0.25 |
| 9 | King's College London | https://www.kcl.ac.uk/ | 63 | 0.26 |
| 10 | University of Melbourne | https://www.unimelb.edu.au/ | 63 | 0.26 |
| 11 | University of Edinburgh | https://www.ed.ac.uk/ | 62 | 0.26 |
| 12 | Massachusetts Institute of Technology | https://web.mit.edu/ | 57 | 0.27 |
| 13 | Nanyang Technological University Singapore | https://www.ntu.edu.sg/ | 62 | 0.27 |
| 14 | Georgia Institute of Technology | https://www.gatech.edu/ | 61 | 0.28 |
| 15 | University of Oxford | https://www.ox.ac.uk/ | 61 | 0.29 |
| 16 | University of Washington | http://www.washington.edu/ | 64 | 0.29 |
| 17 | University of California Berkeley | https://www.berkeley.edu/ | 74 | 0.3 |
| 18 | Duke University | https://duke.edu/ | 59 | 0.3 |
| 19 | Cornell University | https://www.cornell.edu/ | 67 | 0.3 |
| 20 | University of Pennsylvania | https://www.upenn.edu/ | 67 | 0.32 |
| 21 | University of Michigan-Ann Arbor | https://umich.edu/ | 60 | 0.32 |
| 22 | Imperial College London | http://www.imperial.ac.uk/ | 62 | 0.33 |
| 23 | New York University | https://www.nyu.edu/ | 49 | 0.34 |
| 24 | University of Toronto | https://www.utoronto.ca/ | 58 | 0.35 |
| 25 | McGill University | https://www.mcgill.ca/ | 46 | 0.37 |
| 26 | École Polytechnique Fédérale de Lausanne | https://www.epfl.ch/ | 50 | 0.37 |
| 27 | University of Cambridge | https://www.cam.ac.uk/ | 53 | 0.37 |
| 28 | Stanford University | https://www.stanford.edu/ | 58 | 0.38 |
| 29 | Carnegie Mellon University | https://www.cmu.edu/ | 45 | 0.38 |
| 30 | Johns Hopkins University | https://www.jhu.edu/ | 49 | 0.39 |
| 31 | London School of Economics and Political Science | https://www.lse.ac.uk/ | 58 | 0.41 |
| 32 | Technical University of Munich | https://www.tum.de/en/ | 54 | 0.41 |
| 33 | National University of Singapore | https://www.nus.edu.sg/ | 55 | 0.41 |
| 34 | ETH Zurich | https://ethz.ch/en.html | 44 | 0.42 |
| 35 | University of California San Diego | https://www.ucsd.edu/ | 53 | 0.43 |
| 36 | University of Illinois at Urbana-Champaign | https://illinois.edu/ | 37 | 0.45 |
| 37 | Chinese University of Hong Kong | https://www.cuhk.edu.hk/english/index.html | 42 | 0.46 |
| 38 | Paris Sciences et Lettres - PSL Research University Paris | https://psl.eu/ | 40 | 0.48 |
| 39 | Harvard University | https://www.harvard.edu/ | 6 | 0.49 |
| 40 | California Institute of Technology | https://www.caltech.edu/ | 44 | 0.58 |
| 41 | University of California Los Angeles | https://www.ucla.edu/ | 28 | 0.59 |
| 42 | University of Texas at Austin | https://www.utexas.edu/ | 47 | 0.63 |
| 43 | The University of Tokyo | https://www.u-tokyo.ac.jp/en/ | 40 | 0.66 |
| 44 | Columbia University | http://www.columbia.edu/ | 41 | 0.7 |
| 45 | The University of Chicago | https://www.uchicago.edu/ | 38 | 0.77 |
| 46 | UCL | https://www.ucl.ac.uk/ | 42 | 0.87 |
| 47 | University of Hong Kong | http://hku.hk/ | 21 | 1.61 |
| 48 | Tsinghua University | https://www.tsinghua.edu.cn/en/index.htm | 29 | 2.46 |
| 49 | Peking University | https://english.pku.edu.cn/ | 27 | 3.1 |
Comparison of greenhouse gas emissions
Explanation of our methodology
To assess the greenhouse gas emissions of applications, we have followed a rigorous methodology based on data measured on real phones concerning the energy consumption of mobile devices, execution time and the quantity of mobile data exchanged. Using this measured data and a model developed by our teams, we are able to estimate CO2 emissions. For a more detailed explanation of the methodology, please see our dedicated article.
Defining the journey
These measurements were carried out on the basis of a user journey that we divided into short steps. The criterion for choosing this journey was that it could be carried out on all 4 applications so that a comparison could be made:
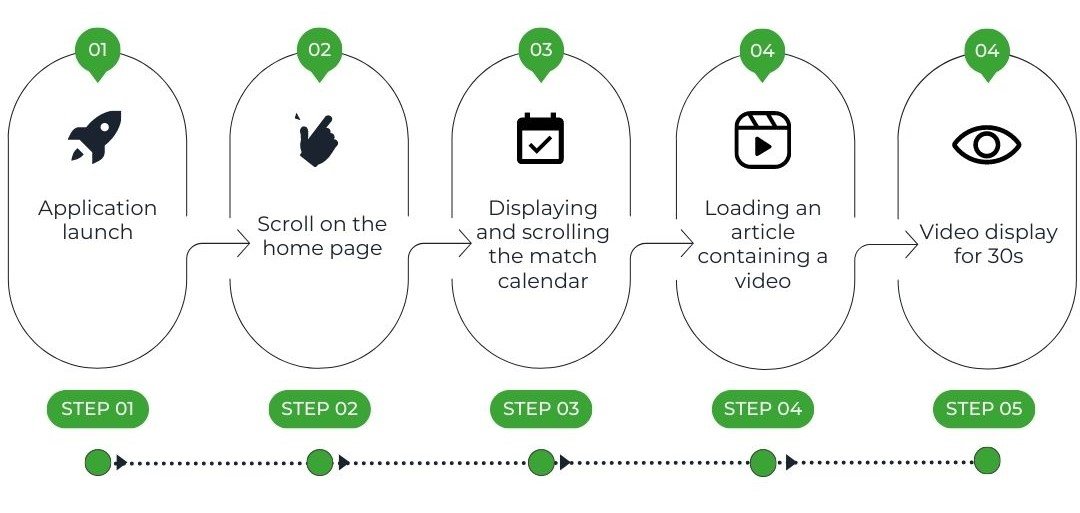
These different steps give us a view of several elements that are typically present in a mobile application, such as a scrollable page, a complex element (a calendar in this case) and a video. The launch steps is also very important, as it can provide us with essential elements of understanding, such as data caching or the time taken to launch the application.
In order to obtain the most reliable measurement possible, we are creating a script to automate the execution of 3 identical series of tests.
The results
After carrying out a detailed analysis, we drew up a comparative table of the results, highlighting the applications with the lowest GHG emissions and those with the largest environmental footprint.
The following results are expressed in tonnes of CO2 equivalent.
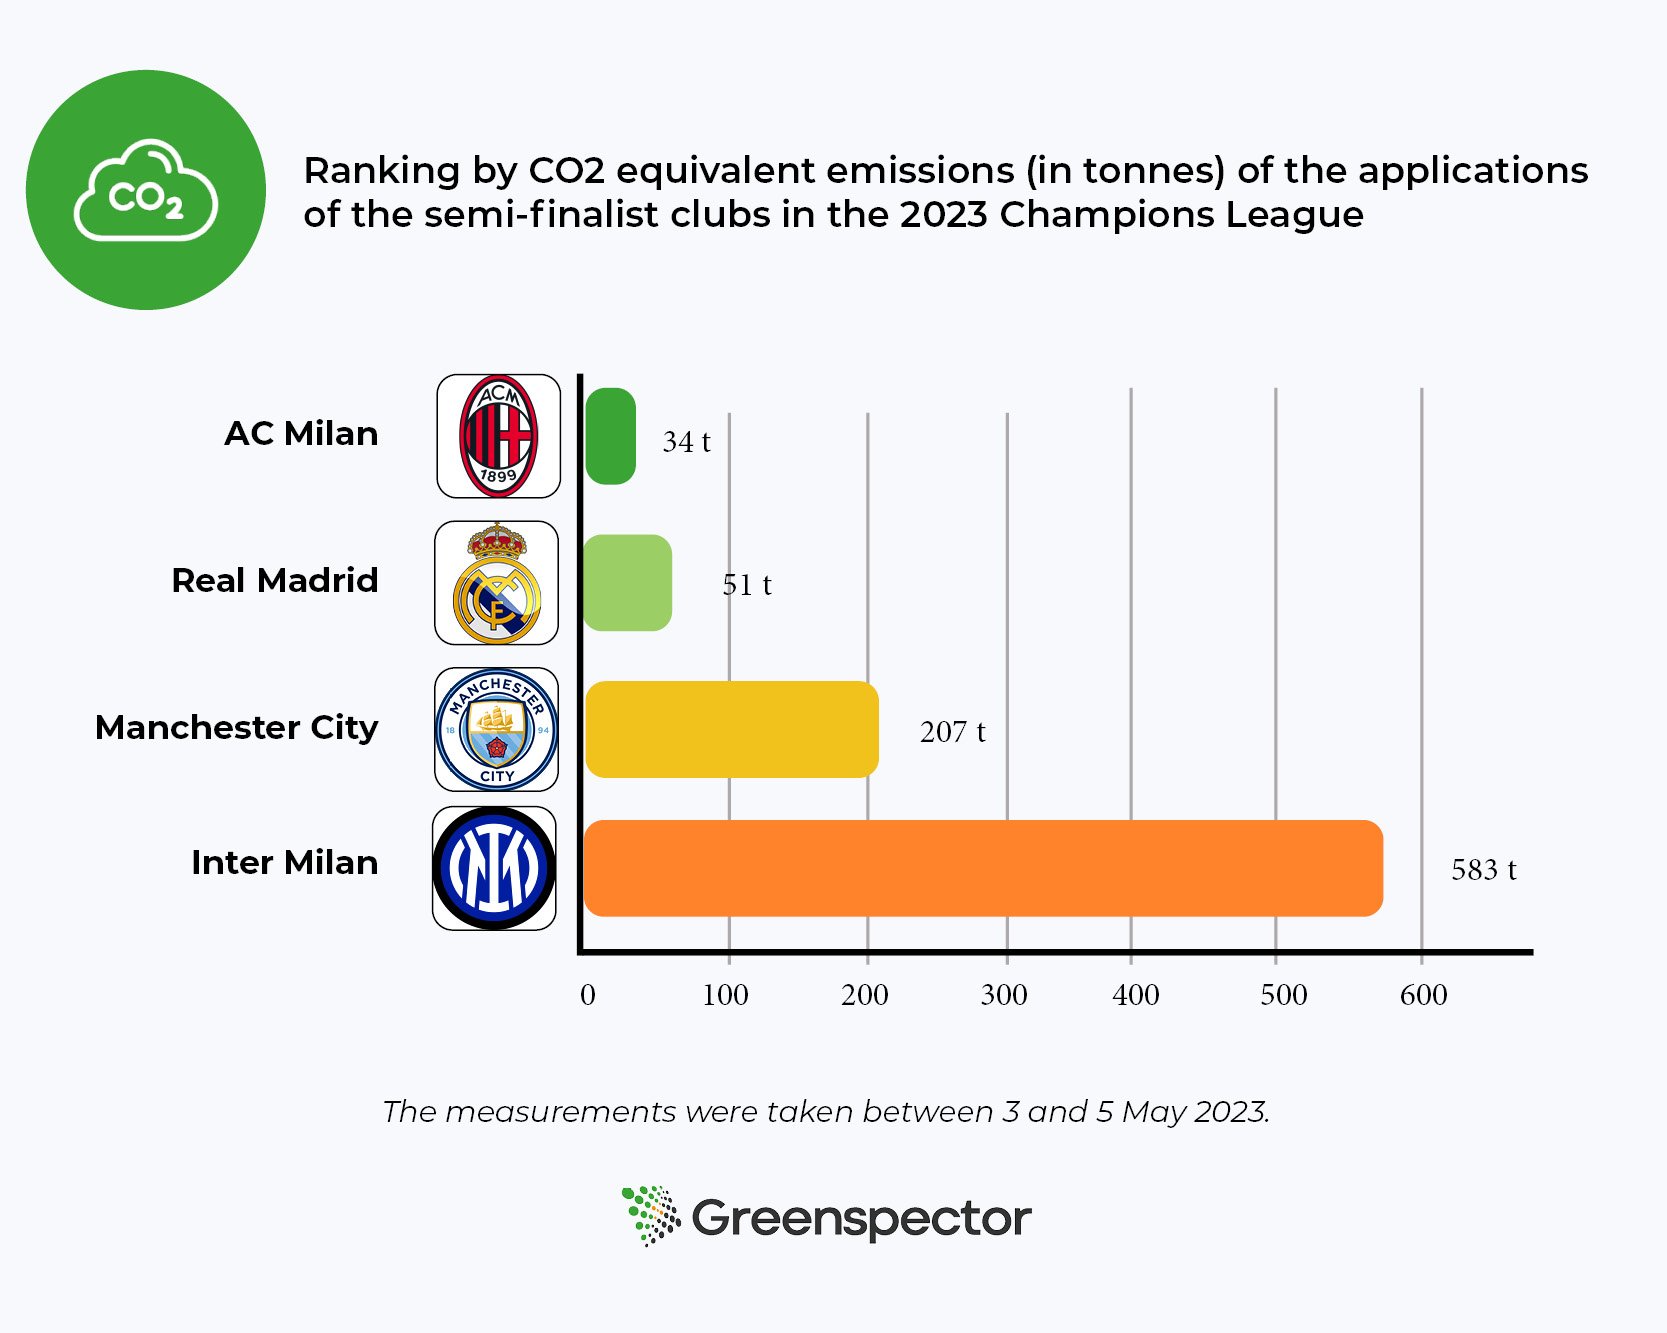
The results obtained show a wide disparity between applications, demonstrating the extent to which the way in which an application is designed and developed has an impact on greenhouse gas emissions. In order to keep this article succinct, we are only going to analyse one element that explains this difference. But bear in mind that the analysis can (and should) be taken further to highlight all the critical points of the applications.
In addition to our study on CO2 emissions, it should be emphasised that the environmental impact of applications goes beyond greenhouse gas emissions alone. Experts such as mining geologist Aurore Stéphant have highlighted other aspects to consider when assessing the ecological footprint of the digital sector. In a recent conference entitled “Mining rush in the 21st century: how far will the limits be pushed?“, she addresses crucial issues such as the consumption of natural resources in the production of smartphones, the extraction of the minerals needed to manufacture them, and all the waste resulting from mining. There are many ethical issues to consider in our use of digital tools.
Video impact
During our comparative analysis, we identified a subject that largely explains the differences in environmental impact: video. Videos have become a central element in many applications, and their growing consumption is contributing to the increase in greenhouse gas emissions from the digital sector. The growing popularity of high-resolution video is leading to intensive use of hardware resources on mobile devices. Smartphones need to be equipped with more powerful processors and batteries to process and display this content, which can lead to more frequent replacement of devices. What’s more, they need servers to store and distribute the content, as well as solid network infrastructures to enable smooth streaming. These servers and infrastructures have material and energy requirements at the time of manufacture, and consume a significant amount of electricity.
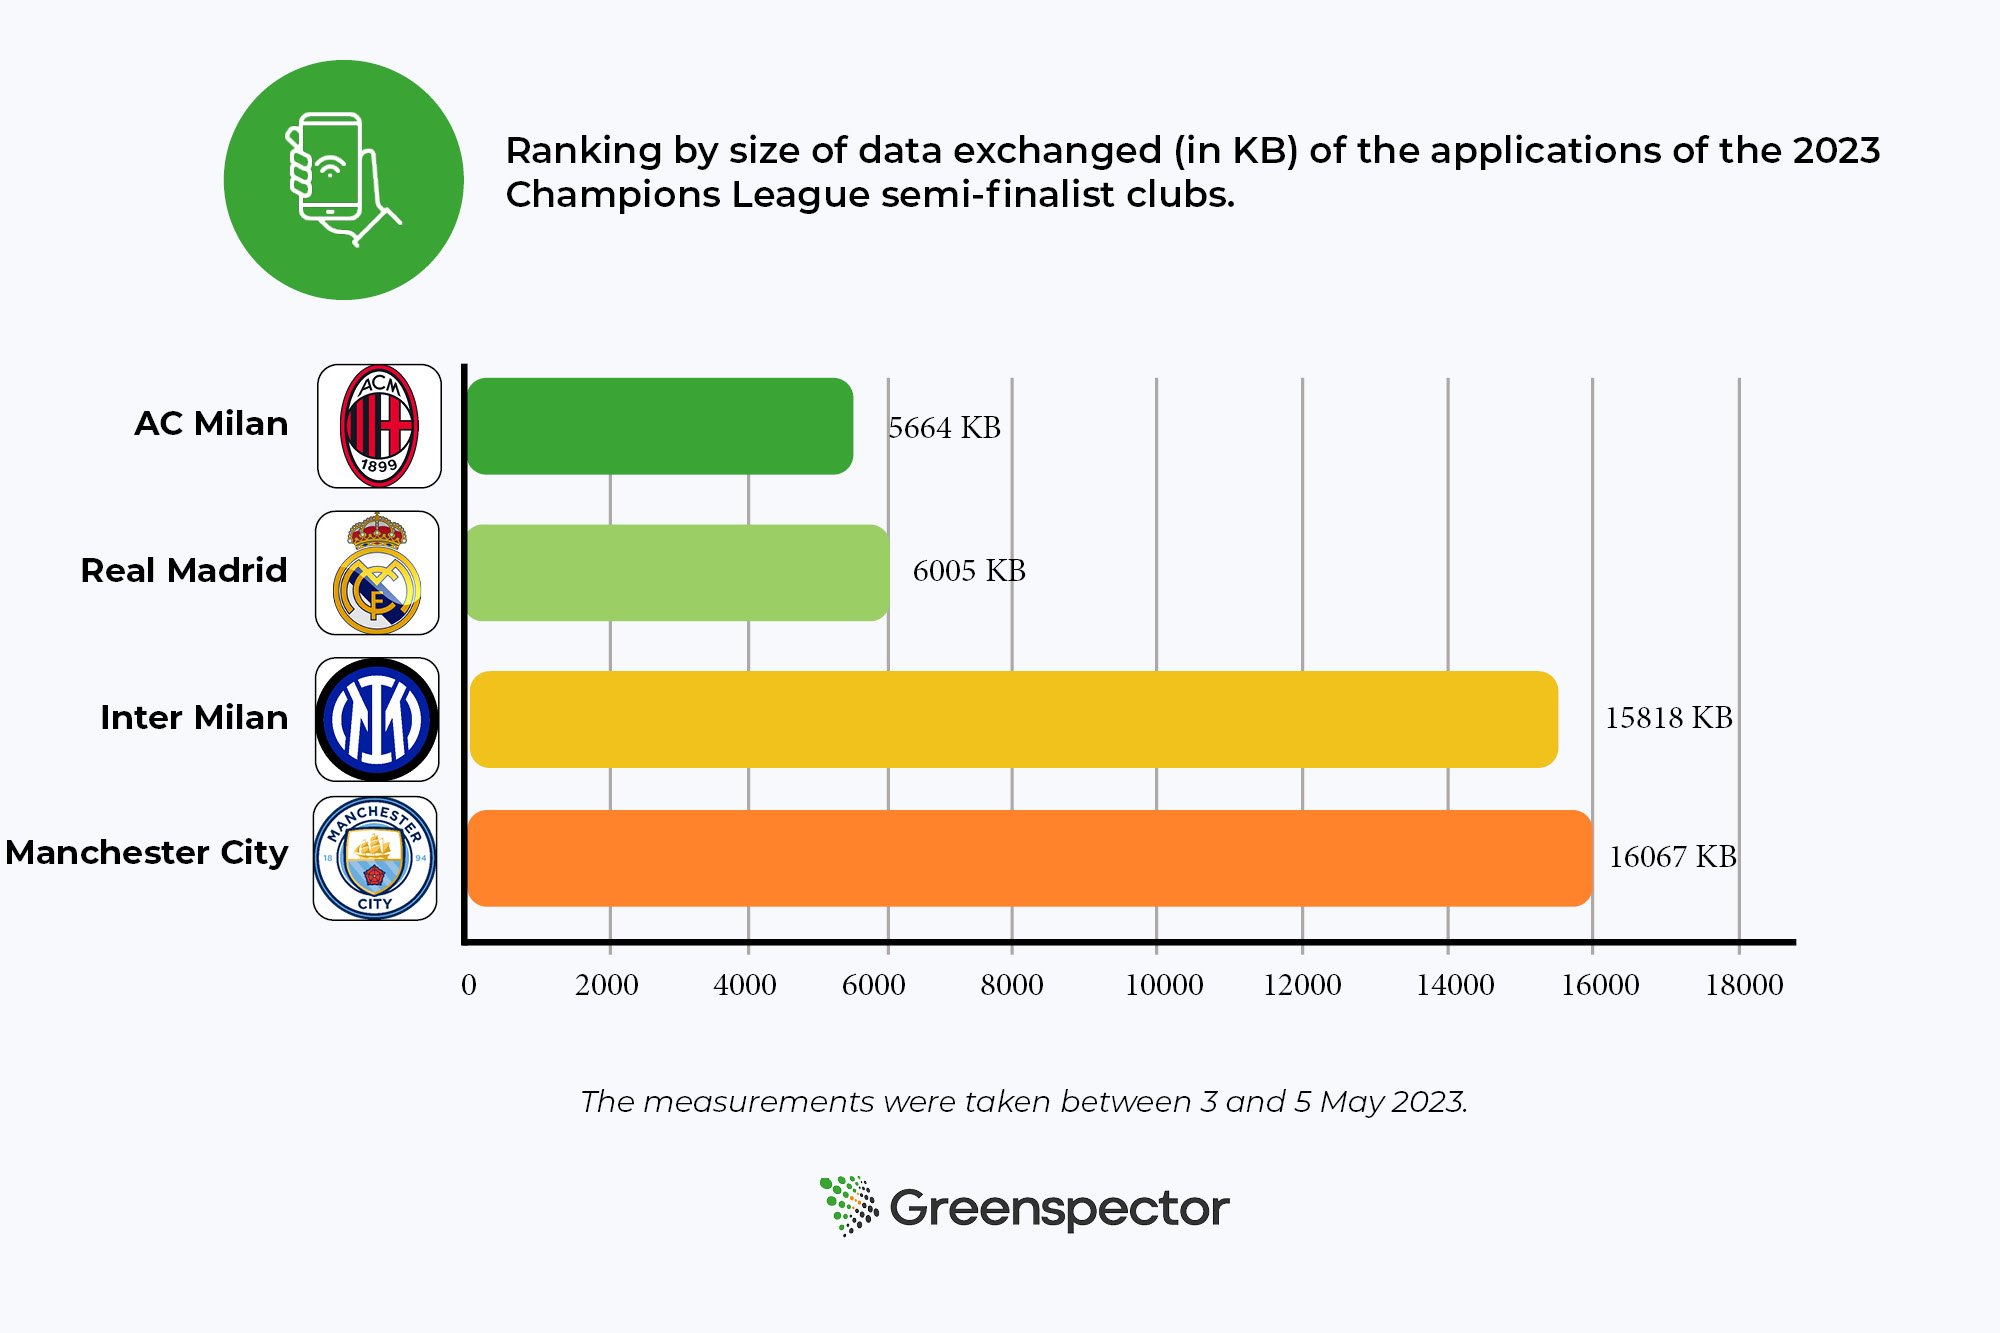
In this case, we see the following results for the amount of mobile data exchanged for each application:
| Position | Université | URL | Ecoscore (/100) | Impact carbone (gEqCO2) |
|---|---|---|---|---|
| 1 | UNIVERSITÉ SAVOIE MONT-BLANC (EX CHAMBERY) | https://www.univ-smb.fr/ | 59 | 0.23 |
| 2 | UNIVERSITÉ PARIS-SACLAY | https://www.UNIVERSITÉ-paris-saclay.fr/ | 63 | 0.25 |
| 3 | UNIVERSITÉ LE HAVRE NORMANDIE | https://www.univ-lehavre.fr/ | 55 | 0.25 |
| 4 | UNIVERSITÉ JEAN MONNET SAINT ETIENNE | https://www.univ-st-etienne.fr/fr/index.html | 66 | 0.27 |
| 5 | UNIVERSITÉ RENNES 1 | https://www.univ-rennes1.fr/ | 59 | 0.28 |
| 6 | UNIVERSITÉ PAU ET DES PAYS DE L'ADOUR (UPPA) | https://www.univ-pau.fr/ | 52 | 0.3 |
| 7 | UNIVERSITÉ CLERMONT AUVERGNE | https://www.uca.fr/ | 54 | 0.31 |
| 8 | UNIVERSITÉ DE TOULON | https://www.univ-tln.fr/ | 57 | 0.31 |
| 9 | UNIVERSITÉ NIMES | https://www.unimes.fr/fr/index.html | 61 | 0.31 |
| 10 | UNIVERSITÉ GRENOBLE ALPES | https://www.univ-grenoble-alpes.fr/ | 68 | 0.31 |
| 11 | UNIVERSITÉ ORLEANS | https://www.univ-orleans.fr/fr?redirect=0 | 60 | 0.32 |
| 12 | UNIVERSITÉ ANGERS | https://www.univ-angers.fr/fr/index.html | 50 | 0.33 |
| 13 | UNIVERSITÉ DE CAEN NORMANDIE | http://www.unicaen.fr/ | 58 | 0.34 |
| 14 | UNIVERSITÉ CLAUDE BERNARD LYON 1 | https://www.univ-lyon1.fr/ | 35 | 0.35 |
| 15 | INSTITUT NATIONAL UNIVERSITAIRE CHAMPOLLION ALBI | https://www.univ-jfc.fr/albi | 39 | 0.35 |
| 16 | UNIVERSITÉ BORDEAUX MONTAIGNE (EX BORDEAUX 3) | https://www.u-bordeaux-montaigne.fr/fr/index.html | 48 | 0.36 |
| 17 | UNIVERSITÉ JEAN MOULIN LYON 3 | https://www.univ-lyon3.fr/ | 40 | 0.36 |
| 18 | UNIVERSITÉ SORBONNE UNIVERSITÉ | https://www.sorbonne-UNIVERSITÉ.fr/ | 39 | 0.36 |
| 19 | UNIVERSITÉ TOULOUSE 1 CAPITOLE | https://www.ut-capitole.fr/ | 41 | 0.36 |
| 20 | UNIVERSITÉ LILLE | https://www.univ-lille.fr/ | 58 | 0.37 |
| 21 | UNIVERSITÉ LA ROCHELLE | https://www.univ-larochelle.fr/ | 49 | 0.37 |
| 22 | AIX-MARSEILLE UNIVERSITÉ | https://www.univ-amu.fr/ | 54 | 0.38 |
| 23 | UNIVERSITÉ POLYTECHNIQUE HAUTS DE FRANCE (EX VALENCIENNES) | https://www.uphf.fr/ | 50 | 0.41 |
| 24 | UNIVERSITÉ REIMS CHAMPAGNE ARDENNE | https://www.univ-reims.fr/ | 40 | 0.41 |
| 25 | UNIVERSITÉ DE PERPIGNAN - VIA DOMITIA | http://www.univ-perp.fr/ | 36 | 0.41 |
| 26 | UNIVERSITÉ LITTORAL COTE D'OPALE | http://www.univ-littoral.fr/ | 38 | 0.42 |
| 27 | UNIVERSITÉ MONTPELLIER | https://www.umontpellier.fr/ | 37 | 0.43 |
| 28 | UNIVERSITÉ STRASBOURG | https://www.unistra.fr/ | 52 | 0.44 |
| 29 | UNIVERSITÉ DE BORDEAUX | https://www.u-bordeaux.fr/ | 41 | 0.44 |
| 30 | UNIVERSITÉ RENNES 2 | https://www.univ-rennes2.fr/ | 61 | 0.46 |
| 31 | UNIVERSITÉ PARIS-EST CRETEIL | https://www.u-pec.fr/ | 51 | 0.48 |
| 32 | UNIVERSITÉ BRETAGNE OCCIDENTALE (EX UNIVERSITÉ DE BREST) | https://www.univ-brest.fr/ | 45 | 0.48 |
| 33 | UNIVERSITÉ PARIS 2 PANTHEON ASSAS | https://www.u-paris2.fr/fr | 37 | 0.49 |
| 34 | UNIVERSITÉ LIMOGES | https://www.unilim.fr/ | 25 | 0.5 |
| 35 | UNIVERSITÉ DE HAUTE ALSACE (EX MULHOUSE) | https://www.uha.fr/fr/index.html | 36 | 0.52 |
| 36 | BOURGOGNE UNIVERSITÉ (EX DIJON) | https://www.u-bourgogne.fr/ | 55 | 0.52 |
| 37 | UNIVERSITÉ TOULOUSE 3 - PAUL SABATIER | http://www.univ-tlse3.fr/ | 65 | 0.52 |
| 38 | UNIVERSITÉ BRETAGNE SUD | https://www.univ-ubs.fr/fr/index.html | 29 | 0.53 |
| 39 | UNIVERSITÉ AVIGNON | https://univ-avignon.fr | 42 | 0.53 |
| 40 | UNIVERSITÉ GUSTAVE EIFFEL (EX PARIS-EST MARNE-LA-VALLEE) | https://www.univ-gustave-eiffel.fr/ | 42 | 0.54 |
| 41 | CY CERGY PARIS UNIVERSITÉ (EX CERGY PONTOISE) | https://www.cyu.fr/ | 58 | 0.55 |
| 42 | UNIVERSITÉ EVRY VAL D'ESSONNE | https://www.univ-evry.fr/ | 36 | 0.56 |
| 43 | UNIVERSITÉ NANTES | https://www.univ-nantes.fr/ | 49 | 0.61 |
| 44 | UNIVERSITÉ CORSE | https://www.universita.corsica/fr/ | 19 | 0.64 |
| 45 | UNIVERSITÉ SORBONNE PARIS NORD (EX PARIS 13) | https://www.univ-paris13.fr/ | 34 | 0.67 |
| 46 | UNIVERSITÉ DE PARIS (EX PARIS 5) | https://u-paris.fr/ | 28 | 0.72 |
| 47 | UNIVERSITÉ NICE | http://univ-cotedazur.fr/ | 23 | 0.94 |
| 48 | UNIVERSITÉ VERSAILLES SAINT QUENTIN EN YVELINES | http://www.uvsq.fr/ | 30 | 1.1 |
If we take the case of Inter Milan, we can see that this application consumes much more data than its competitors. There are several reasons for this:
- Non-optimisation of the video: the results of the 30s video viewing steps are very interesting because they allow us to compare the data exchanged by the applications for a single video.
- Autoplay: feature commonly used on websites and streaming platforms to automatically launch videos or multimedia content as soon as the user accesses a page or application. This practice has a significant environmental impact. Autoplay leads to increased energy consumption, as videos are launched and loaded automatically, even if the user is not actually watching them. The case of the Inter Milan application is quite striking in this respect, as autoplay is activated on all pages containing video. This is particularly the case on the home page, which means that a lot of data is exchanged each time the application is used, even if the user only wants to watch the score of a match.
Video consumption plays a major role in the differences in environmental impact between applications. Mobile developers can help to reduce this impact by optimising video compression, favouring low-resolution delivery by default and encouraging responsible use of video functionalities. Users, for their part, can adopt more conscious viewing practices and limit their video consumption wherever possible. A combination of efforts from all the players involved can contribute to a more sustainable and responsible use of mobile applications.
Video optimisation solutions
Fortunately, solutions do exist and a more in-depth analysis can drastically reduce the impact of videos on the environment.
One approach is to optimise video compression. By using efficient codecs and advanced compression algorithms, it is possible to reduce the size of video files while maintaining acceptable visual quality. This reduces the demand for bandwidth when broadcasting videos, thereby reducing the CO2 emissions associated with their transmission. Intelligent management of video resolution can also help to reduce the carbon footprint of applications.
Alongside these technical measures, it is also important to encourage responsible use of video. Making users aware of the environmental impact of excessive video broadcasting, and encouraging them to adopt practices such as limiting background streaming and reducing resolution when high quality is not required, can have a significant effect on reducing CO2 emissions.
Finally, by combining technical solutions with responsible practices on the part of users, it is possible to considerably reduce the environmental impact of videos in mobile applications. It is essential that developers, content providers and users work together to encourage more sustainable and responsible use of this popular and ubiquitous feature. By acting collectively, we can preserve the quality of our digital experiences while minimising our impact on the environment.
Conclusion
The 2023 Champions League semi-finalists, Real Madrid, AC Milan, Inter Milan and Manchester City, need to consider the environmental impact of their operations. While these clubs enjoy a global reputation and a passionate fan base, it is essential to recognise the environmental footprint associated with their operations, including the use of mobile applications. However, it is encouraging to see that solutions exist to improve this situation. By better understanding these aspects, we can identify opportunities to reduce the ecological footprint while improving the user experience. We are ready to support these clubs as they move towards greater environmental sustainability. Together, we can develop appropriate strategies, implement innovative practices and promote environmental awareness among fans. The aim is to create a genuine synergy between sport and the protection of our planet.
Players in the world of sport, measure the ecological footprint of your application now and take concrete steps to reduce your environmental impact. Together, let’s score goals for sustainability and protect our sport and our planet.
