This document summaries Greenspector’s methodology to assess the environmental impact of mobile applications and websites. It introduces Greenspector’s measure framework, and the reports it generates. The goal of this framework is to assess and reduce the environmental impact of mobile and web applications, by extending the battery life of mobile devices, and by tackling technological obsolescence and bloatware, but also by limiting their weight on network and back-end infrastructures. Greenspector’s methodology is built on the industrial and scientific state of the art, and its technical details are publicly available in Greenspector’s whitepaper and scientific publications.
Measure framework
Greenspector assesses the performance of functional units of applications and websites, rather than the applications and websites as a whole. This granularity allows for evaluating each feature and usage independently and is compliant to existing norms (ISO 14040). These functional units represent user journeys, that is a set of actions performed by a user. They are automated with GDSL, a proprietary language allowing for consistent and replicable measures.
The user journeys are executed on the physical devices of Greenspector’s testbench. These devices are monitored and stabilized to ensure that performance results are valid. Their power and data usage are monitored throughout the executions of user journeys, and the resulting data is aggregated and provided in a report.
Specifically, each journey receives a grade assessing its energy efficiency, data usage, and duration, and an estimation of its environmental impacts, using a method described below. In addition, the data is centralized on a dashboard allowing for monitoring the performance of the analyzed application throughout its development. Other metrics and indicators are also scrutinized, to enable a more in-depth analysis of results.
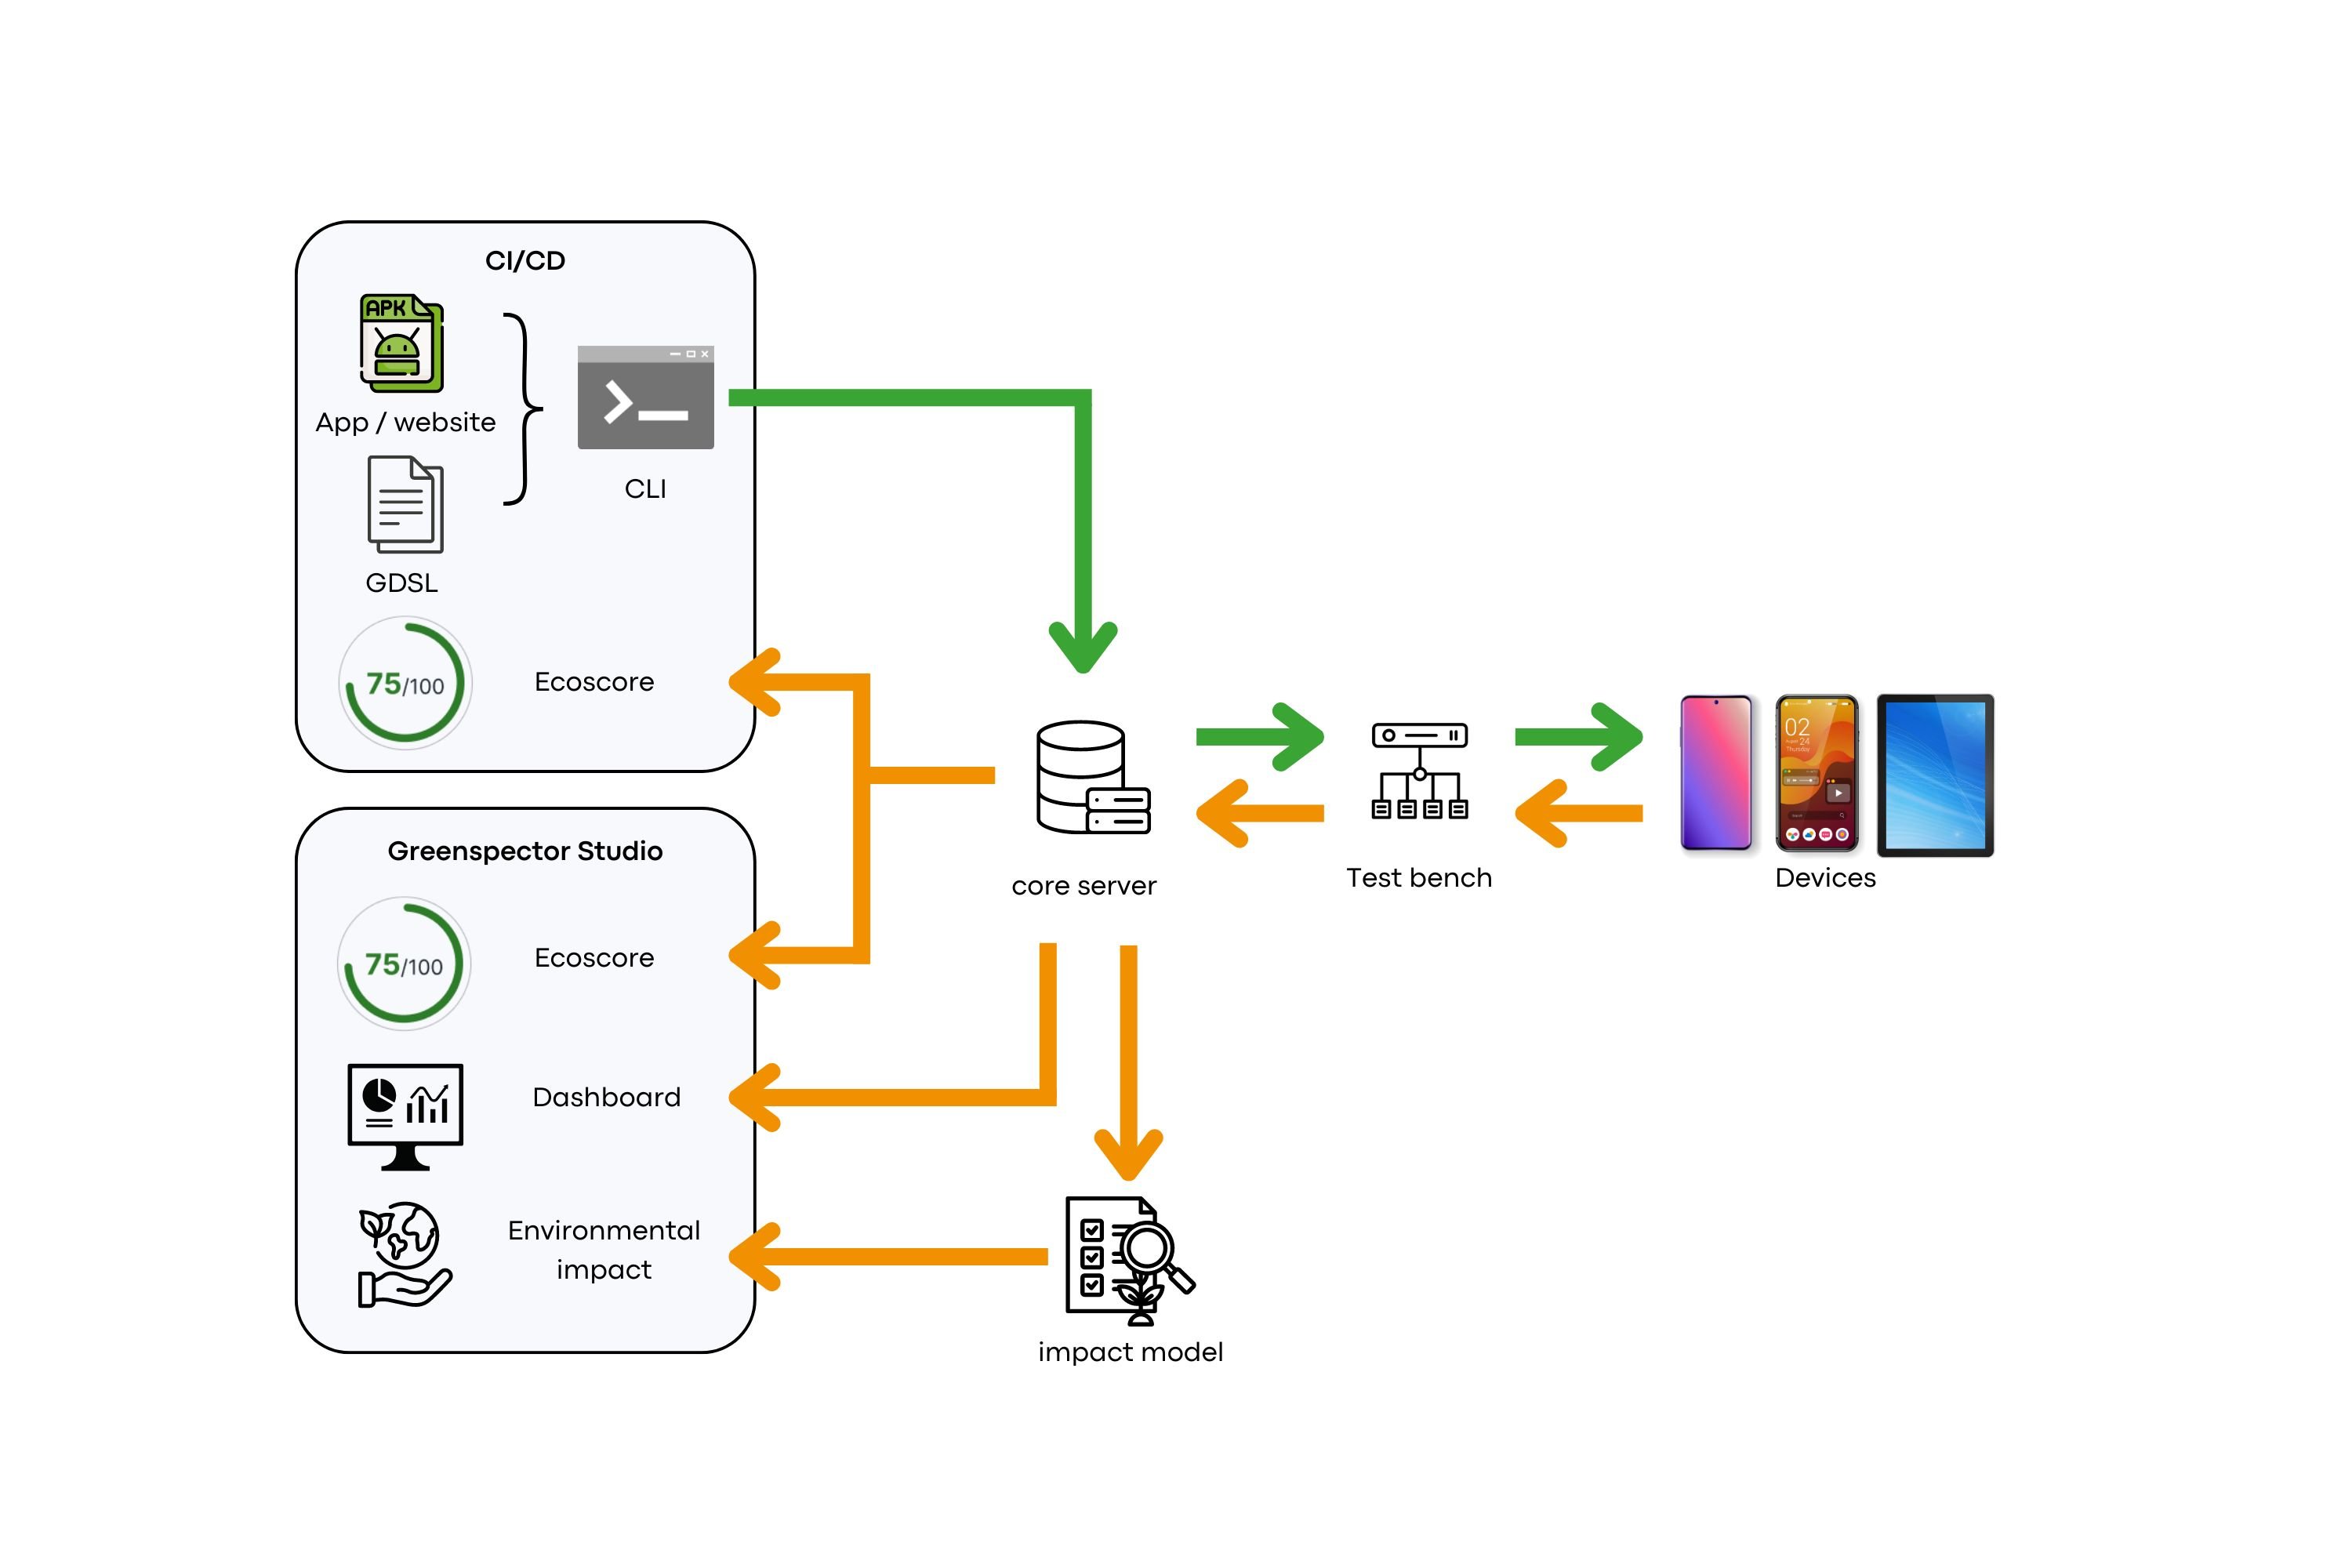
The measure framework is summarized in the following figure. The application to monitor and the associated user journeys are shared to our testbench either manually with the help of a command line tool, or automatically from a CI/CD pipeline. Our testbench executes the user journeys on physical devices and monitors their performance. The resulting data and reports are provided in Greenspector Studio web portal. If the test was triggered from a CI/CD, the grades of the journeys can be used as a success criterion for the pipeline.
Provided reports
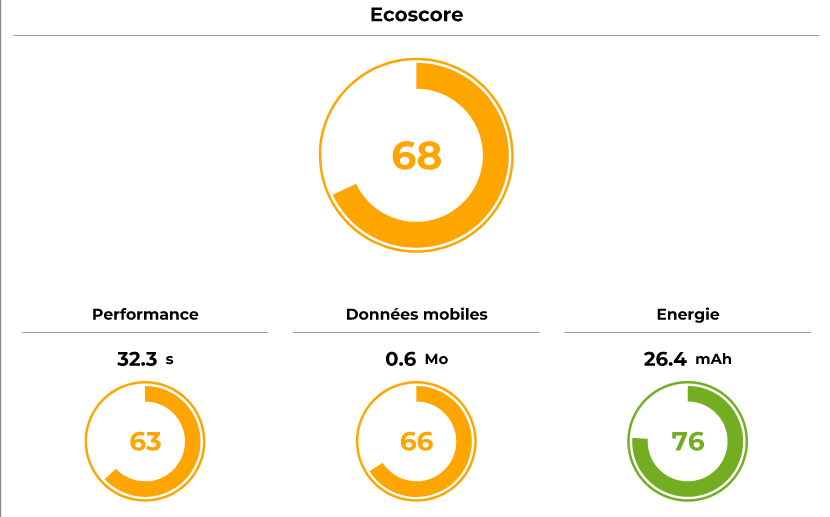
The 3 main monitored metrics are synthetized as a single grade: the Ecoscore. This grade quantifies the quality of a given user journey, on a 0 to 100 scale, based on three criteria: the duration of every step of the user journey, their network usage, and their energy usage on the terminal.
The Ecoscore is provided in a report containing additional details regarding the performance of each step of the journey under review. This report allows for locating technical and design issues, and to prioritize corrections and improvements. Greenspector rewards the highest Ecoscores with eco-design labels.
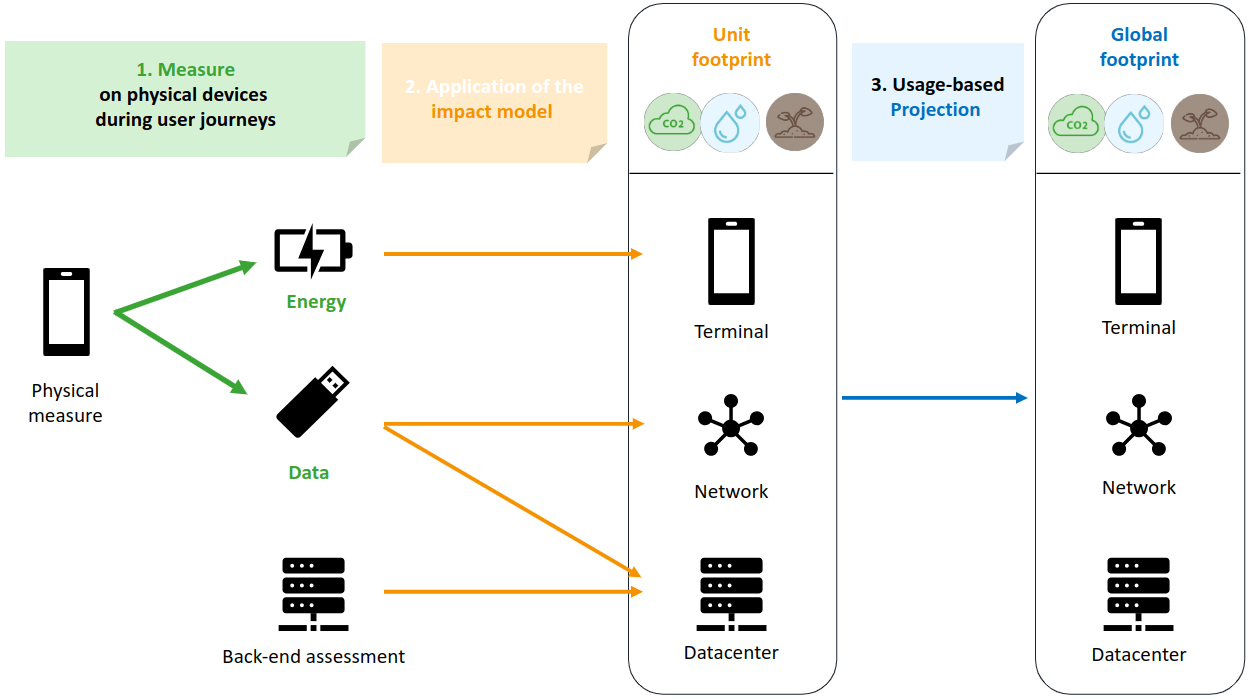
This report also provides the estimated environmental impact of the user journeys regarding seven impact categories, following the Product Environmental Footprint (PEF) recommendations, such as climate change, metal resource depletion, or freshwater ecotoxicity. The environmental impact of a user journey is estimated by accounting for its impact on end-user’s devices, the network, and back-end infrastructures.
This impact also accounts for both the energy consumption and the life-cycle impact of hardware involved in these three layers. Specifically, the impact of end-user’s devices is estimated from the energy consumption of the user journey, while the impact of network and back-infrastructures is estimated from the data usage of the journey. This impact allows for exploring different usage scenarios, such as different types of connectivity or different electricity-mix for each of the three layers. The individual impact for an execution of a user journey can then be scaled to the number of executions of the journey on a given period.