
In this article, we will see in more detail how the ecoscore is calculated in the case of a web benchmark performed by Greenspector.
And in other cases ?
As you may already know, Greenspector also performs measurements on mobile applications. In the case of Android applications, it is possible to easily perform a benchmark. The methodology is standard: measurements on loading stages, pauses and reference. The ecoscore is also calculated from the Network and Client Resources ecoscores. The only notable difference is that the implementation of good practices is not automatically controlled and therefore not included in the calculation.
Also, in some cases, it is more appropriate to measure a user path directly in order to be as close as possible to the behavior of the site in its real conditions of use. Whether it’s for the web or a mobile application, Greenspector performs the measurements (always on real user terminals) after automating the path (via the GDSL language). The ecoscore is then established from the metrics represented via 3 ecoscores: Mobile Data, Performance and Energy.
What is a web benchmark?
In order to evaluate the environmental impacts of websites, Greenspector has several operating modes and tools. The easiest to implement is the web benchmark. This standard methodology allows to measure any web page and compare it with other pages.
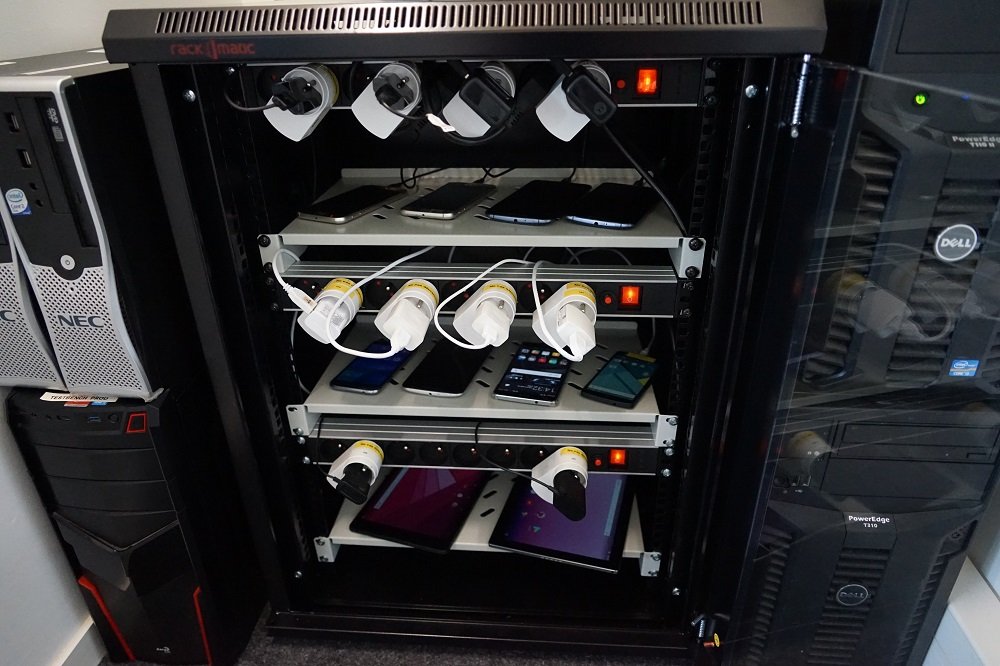
The measurements are performed on a real smartphone available on our test bench, most often in WIFI (even if other connection modes, such as 3G or 4G, are possible) and with the Chrome browser.
Such a measurement lasts 70 seconds and includes:
-The loading of the page
-A pause step with the page displayed in the foreground
-A pause step with the page displayed in the background
-Scrolling on the page
In addition, a reference measurement is performed on an empty tab in Chrome.
Several iterations of measurement are performed to ensure their stability.
We thus recover metrics on the data transferred but also the impact on the user’s terminal and in particular on the battery discharge. In addition to this, the correct implementation of some thirty good practices is automatically verified.
Then, the environmental indicators are calculated taking into account, when possible, the real statistics of the page use. You can find more information about this on the dedicated page on the Greenspector blog.
Once all this information is available, it becomes easy to compare different web pages, whether they are on the same site or not. This is the operating mode that is used in the framework of the website rankings proposed on this blog, but also at the request of a client in order to establish an inventory of one or more of its websites and to propose an action plan. It can also be a way to build a competitive benchmark to position itself in relation to a sample of similar sites.
You can already have an overview of all this via the Mobile Efficiency Index (MEI) made available by Greenspector to evaluate the impact of a web page for free.
For the moment, we only have to see how the ecoscore is calculated in the context of a web benchmark.
Calculating the ecoscore for a web benchmark
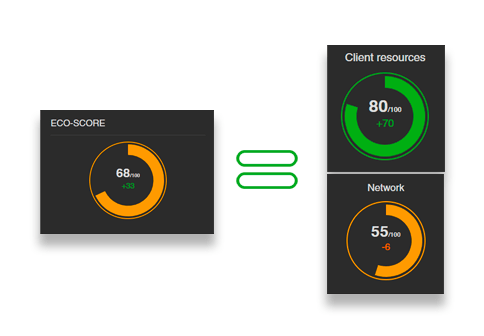
First of all, the ecoscore established for a web page is the average of two values:
-A Client Resources ecoscore which reflects the way client resources are managed from a sobriety point of view when accessing this page
-A Network Ecoscore which reflects the network (and server) load
Client Resource Ecoscore
The Client ecoscore is based on 12 controls performed on the metrics directly retrieved from the user terminal (and collected via its operating system). These metrics concern, among other things, transferred data, but also battery discharge, CPU and memory. For each, 4 to 5 thresholds are defined to determine the acceptable values. According to these thresholds, a score is calculated. The scores for all the metrics are then aggregated to calculate the Customer Ecoscore.
For example:
-The maximum score for data transferred during page loading can only be obtained if its total weight is less than 500 KB
-For the battery discharge, we compare it to the one measured during the reference step described above
The thresholds used are defined via a database of measurements in order to be able, according to the statistical distribution of the measurements previously obtained, to determine the expected thresholds.
Network Ecoscore
Today, the Greenspector methodology is based on measurements only on real user terminals. As a result, the definition of the Network Ecoscore is slightly different. It is based on two elements:
-Comparison of metrics related to data transfer with thresholds defined in a similar way to those used for the Client Ecoscore calculation
-Automatic verification of the implementation of some thirty best practices
For example, we ensure that text resources are compressed on the server side, that images are not resized in the browser and that there are no more than 25 HTTP requests in total. These are therefore good technical practices (rather efficiency-oriented) that can be found in most good practice guidelines for ecodesign or responsible design of digital services.
Conclusion
All these elements make the web benchmark a very efficient process to evaluate the impacts of a web page and compare it with other web pages. It is also an excellent way to start a more in-depth analysis, especially by looking at the most impactful pages of a site. In some cases, it will be more judicious to start with the least impactful pages. A design flaw on a high impact page will often be specific to it, whereas on a low impact page, it will often be common to all the pages.
The web benchmark, among other things through the calculation of the ecoscore, illustrates once again the need to use both measures and good practices in an approach to reduce the environmental impact of a digital service.