For this special “stay at home” battle, two applications offering full-body workout will oppose: 7 Minutes Workout vs Home Workout.
In the left corner 7 Minutes Workout, the application, which has more than 3,000,000 users, offers sports training lasting 7 minutes based on the HICT (high intensity training circuit).
In the right corner Home Workout, app part of the Leap Fitness Group which offers daily exercise routines for all major muscle groups.
The weighting
At weighing Home Workout is the most caloric application with a weight of 43 MB. The 7 Minutes Workout application is 14% lighter with a weight of 37 MB.
The fight
The athletes are getting ready to compete on a full-app challenge program!
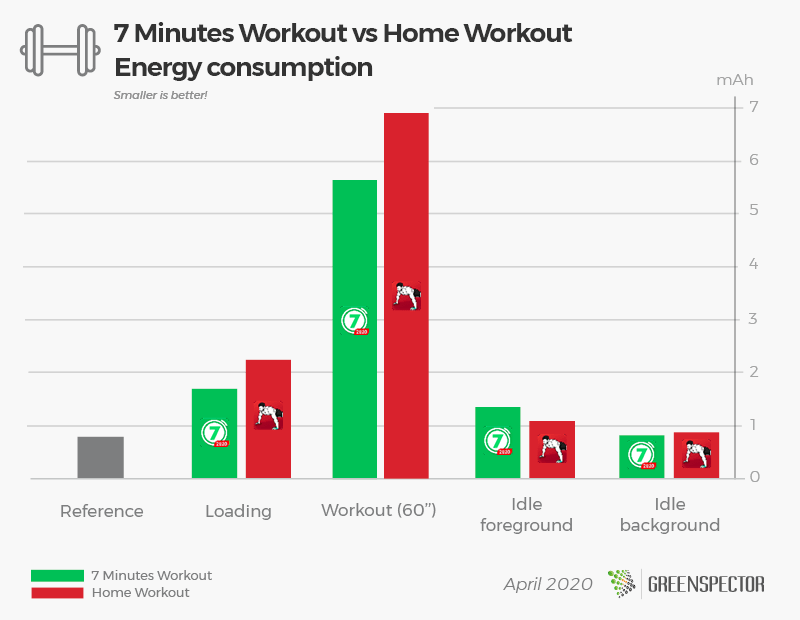
The first part of the program naturally consists of observing the launch phase (or warm-up) of the application. 7 Minutes Workout (1,71 mAh) wins the first round by consuming 24% less than its opponent Home Workout (2,25 mAh). During the second round which corresponds to the scenario of the user journey (carrying out a beginner sports program), it is always 7 Minutes Workout (5,61 mAh) which leads to Home Workout (6,92 mAh) with lower consumption by 19%. To put an end to this confrontation, we have set up two decisive rounds to observe the rest phases of each opponent. While we are at the stretching stage, Home Workout takes over on 7 Minutes Workout by consuming 18% less in the inactivity stage in the foreground. The applications are neck and neck for the inactive phase in the background, however 7 Minutes Workout takes over by consuming 6% less than its opponent!
The bell rings! End of training!
The winner
Without any surprie, the 7 Minutes Workout app won this match with an overall score of 9,48 mAh to 11,19 mAh, or 15% less battery consumption compared to its opponent Home Workout. Note that 7 Minutes Workout is also less consumer in terms of data exchanged, 16 KB against 2,8 MB for Home Workout.
If we project the journey for one minute in carbon impact, the 7 Minutes Workout application consumes 0,10 gEqCO2 or the equivalent of 0.88 meters performed in a light vehicle against 0,39 gEqCO2 for Home Workout or the equivalent of 3.51 meters.
For those who like numbers
Application
Version
Downloads
Playstore Grade
Application weight (MB)
Exchanged data scenario (KB)
Memory consumption scenario (MB)
Energy consumption (mAh)
7 Minutes Workout
1.363.111
10 000 000+
4,8
37
0.016
279
9,48
Exercices à la maison
1.0.42
50 000 000+
4,8
43
2.8
377
11,19
On a 1-minute usage scenario, 7 Minutes Workout’s energy consumption is equivalent to a direct messaging application such as Line. As for Home Workout, its consumption is similar to an application such as a social network such as Facebook Like. (Source: Study Consumption of top 30 most popular mobile applications) .
The measurements were carried out by our laboratory on the basis of a standardized protocol, respecting a specific user scenario (launch of the app, search for a workout, workout exercices). The other scenarios are the launch of the application (20”), inactivity in the foreground (20”) and inactivity in the background (20”). This methodology makes it possible to estimate the embedded application complexity and its energy impact during the use phase.
The Carbon Impact calculation is based on a projection according to the OneByte methodology of the Shift Project for the server and network part. Assumption calculated according to network and datacenter impact in France, for network connectivity 50% Wi-Fi, 50% mobile network, device life based on 500 full charge / discharge cycles.
E-commerce sites are high traffic sites (11 million per month) and therefore have an impact reinforced by the volume of use and significant time of use (visit> 5 minutes). In addition, driven by strong growth in e-commerce, longer journey times and more and more mobility, oversized infrastructures to ensure a good level of response time, the e-commerce site makes an ideal candidate for a Carbon assessment of a digital service with environmental responsibility associated with mass services.
Methodology
The assessment scope is based on the impact of the 100 most visited sites in France over the second half of 2019. It is therefore not exhaustive since the calculations do not take into account all the e-commerce sites with lower traffic.
How to assess the Carbon Impact of an e-commerce site?
To know the Carbon impact of an e-commerce web service, we worked on a simplified method based on real measurements.
On the Datacenter and Network side, we project the Carbon Impact from the consumption of data exchanged with the device (OneByte method of the ShiftProject).
On the User device, a real measurement on a mid-range Android smartphone equipped with a Chrome browser is launched 3 times and averaged before being projected with a Carbon impact factor taking into account the following assumptions: WiFi mix – GPS network, 50% brightness, phone battery wear at 500 full charge/discharge cycles.
The average impact of a course (= 1 visit)
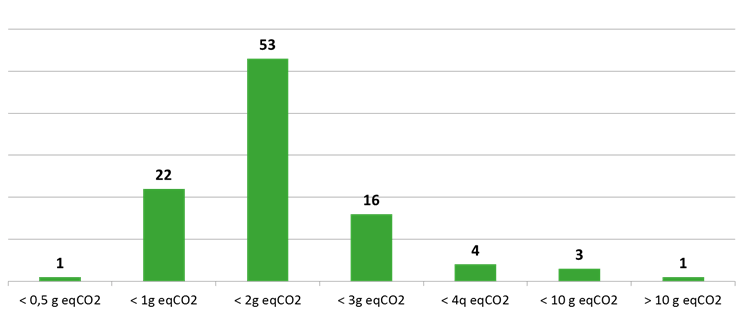
The visit, on average of 5 minutes and 28 seconds on an e-commerce website in France on a smartphone device, has a carbon impact of 2 gCO2eq equivalent to 18 meters traveled by a light vehicle. Or 56 visits to an average e-commerce site impact 1 km driven with an average light vehicle.
The distribution of the sites is fairly homogeneous between 0.5 and 3 grams with some extreme values. Nevertheless, there are large differences: from 0.5 g to 34 g EqCO2, -> ie a ratio of X68 between the 100 Top E-Commerce sites in France. These differences can be qualified by taking into account that the visit time varies by a factor of 5 (from 3 to 15 minutes).
When we project the impacts on monthly visits, an e-commerce website has an average carbon impact of 23.8 Tons CO2eq/month.
The sum of the impacts of the top 100 e-commerce sites is 2380 Tons EqCO2/month, the equivalent of the impact of 21 million km of an average car in France or 531 rounds of the Earth by car or 19,636 average vehicles circulating in France corresponding to the fleet of an agglomeration of 40,000 inhabitants.
Projected over one year, it is 28.6 MegaTons Eq CO2!
Average impact of a page
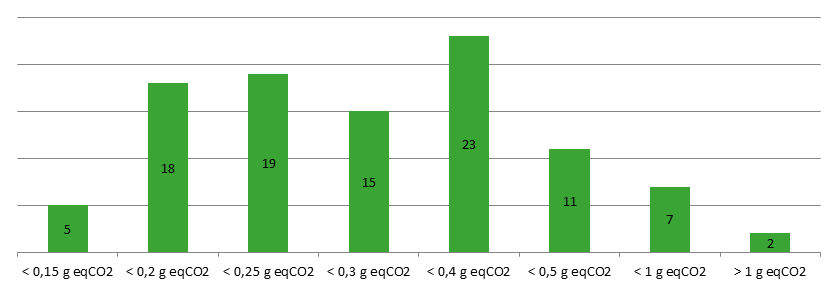
In order to compare e-commerce sites with each other, the visit time or the number of steps or page views during the visit must be isolated. To do this, we go back to the basic measurement of a page for 1 minute.
A page from an e-commerce website in France has an average impact of 0.36 g CO2 eq.
In simple projection: 1,000 pages viewed for 1 minute on an average smartphone have an average carbon impact equivalent to 3.2 km from a light vehicle. The detailed ranking of the Top 100 e-commerce websites is available here. It will be likely to vary during future updates or request for re-measurement.
Breakdown of sites visited
Large difference: from 0.5 g to 34 g EqCO2, i.e. a ratio of X 68 between the 100 top e-commerce sites in France.
To explain this significant variation in impact, we can note that:
The data consumption ranges from 0.6 MB to 55 MB, or a ratio of X 92, this is the most discriminating factor explaining the differences in impact.
the energy consumption on the mobile device varies by a factor of 4.7
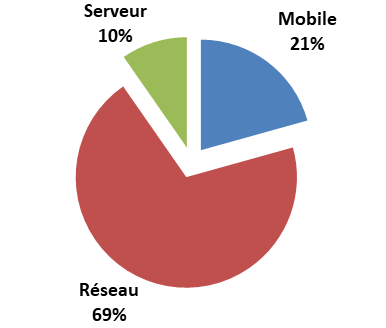
It is the network part that has the most impact with a share of 69% of the average impact of an e-commerce site on mobile.
If the mobile were replaced by a PC with a wired connection, the “User workstation” part would be much more important. This distribution of impact of course varies with the e-commerce site.
Low impact website case
Compliance with best practices on the network and low consumption on the device
Eco score Greenspector: 81/100, best Eco score of the Top 100 E-Commerce
Equivalent of 161,675 km of a light vehicle for 24.5 million visits / month (Source: Similarweb S2 2019)
Heavy impact website case
No respect for best practices on the network and high consumption on the device
Eco score Greenspector: 21/100, the lowest Eco score of the Top 100 E-Commerce
Equivalent to 44,582 km of a light vehicle for 2.1 million visits/month.
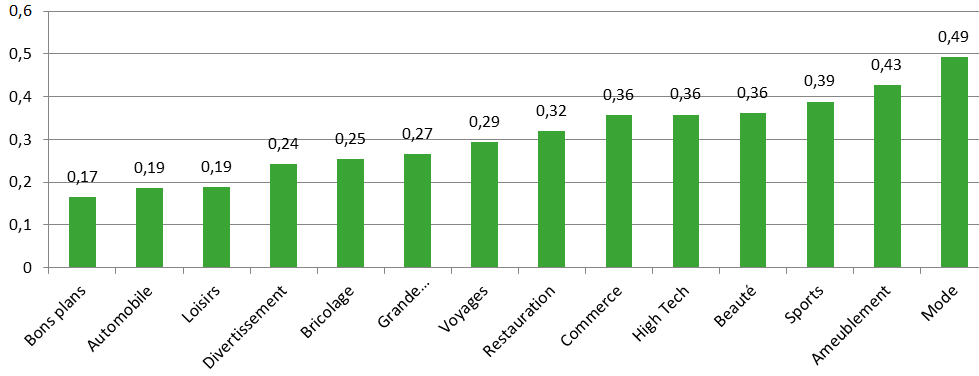
More impactful categories of sites than others?
A ratio of 1 to 3 on the impacts per page between categories
We have about 3 times more carbon impact by browsing a fashion e-commerce site than on an Automotive or Leisure site.
Rq: a single site classified in the Good Plans category
Projected earnings:
If all the sites were aligned with the most virtuous site in our measurements, we could save over a full year:
15,177 tonnes of CO2eq, more than half of the impacts
Or 53% reduction in carbon impact
The equivalent of 4050 rounds of the earth by car
The major levers for improvement:
E-commerce websites can reduce network volume
Adapt content to device / type of connection & connection quality
Compression of rich content
User cache to avoid content already loaded on a previous visit
Limit the number of requests (internal, advertising, external services, etc.)
Beware of unsuitable pre-loads
E-commerce sites that can reduce their energy and battery consumption
Allow rapid interaction
Reduction in the consumption of scripts in the pages (3D animation, graphic animation, etc.)
Reduction of trackers / monitoring
External services to be evaluated / optimized
Reduced travel time
A design / graphics / color to optimize
Correlation analysis of carbon data
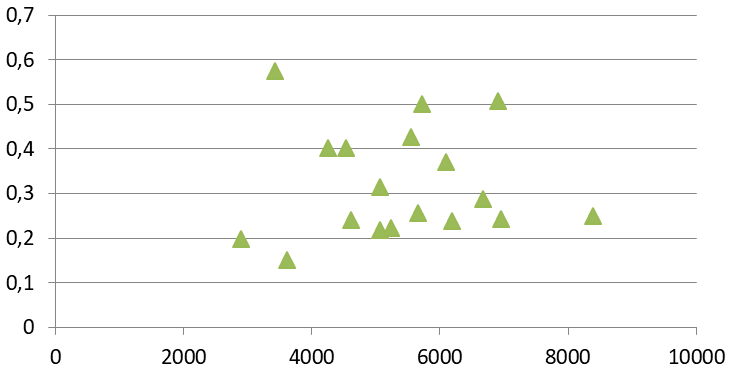
Correlation analysis between carbon impact and display performance
By taking 20 values from our sample for which we collected performance data, we can validate that there is no correlation between Carbon impacts and Display performance.
The 2 best performing sites are nevertheless also the least impactful sites
The Carbon indicator is an indicator in its own right for the management of an e-commerce website
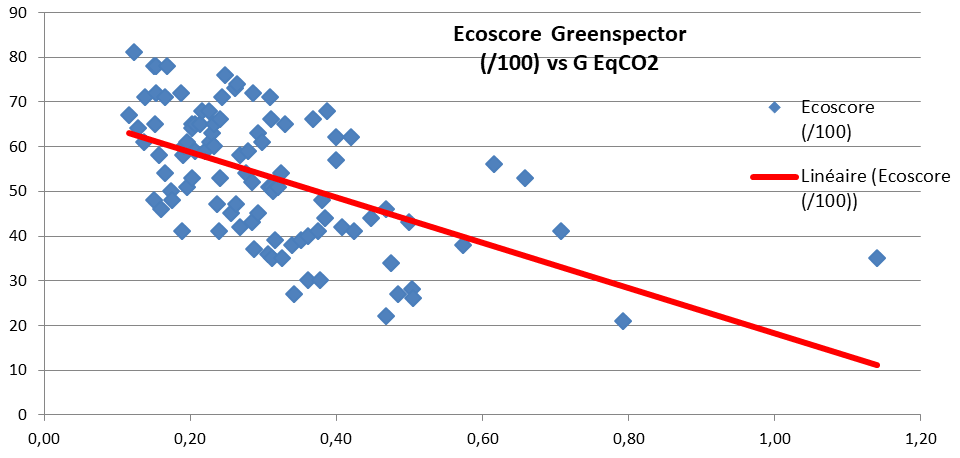
Correlation analysis between Impact Carbone and Eco score Greenspector
The estimated Carbon indicator does not take into account other parameters, such as memory consumption, CPU, number of requests, or compliance with good practices, etc. The Eco score includes both the consumption of resources/energy but also a note on compliance with good practices.
There is a “satisfactory” correlation between the estimated Carbon impact and the measured Ecoscore Greenspector.
Please note, the Carbon indicator does not cover all environmental indicators.
Sales made on e-commerce sites are increasing each year, more and more on the go or from a smartphone at home. We have never consumed so much through these web platforms as we do today. A debate persists between the ecological impact of e-commerce in terms of logistics compared to a purchase made in-store. It all depends on certain parameters (delivery time, geographic location of the store, logistical means used, etc.). In addition to this logistical question, there is the environmental impact of digital technology for e-commerce purchases. How can we estimate the part that these online purchases represent in terms of the environmental impact of our life as consumers?
To answer this question on e-commerce in France, we took as a basis the ranking of the largest e-commerce sites in France (Top 100 E-Commerce: E-Commerce Nation & SimilarWeb study) and we add to your asks other sites. We measure the consumption of energy and resources on a mid-range smartphone which allows us to assess the carbon impacts on the entire chain: device (Greenspector methodology), network, and datacenter (OneByte method of the ShiftProject). This evaluation is done on the basis of the home page of the e-commerce site and on the basis of a 1-minute protocol. The Greenspector eco score completes the assessment of the site both by respecting good practices but also by measuring other metrics of resources not assessed in the Carbon impact.
Ranking of the carbon impact of the Top 100 E-commerce websites
Position
Website
Total gEqCO2 per page/minute
Ecoscore
(/100)
Measurement date
1
https://fr.hotels.com/
0.11
67
13-03-2020
2
https://www.leroymerlin.fr/
0.12
81
13-03-2020
3
https://www.microsoft.com/fr-fr
0.12
64
13-03-2020
4
https://www.naturabuy.fr/
0.13
61
13-03-2020
5
https://www.airfrance.fr/
0.13
71
13-03-2020
6
https://www.decathlon.fr/
0.15
48
13-03-2020
7
https://www.veepee.fr
0.15
78
13-03-2020
8
https://www.norauto.fr/
0.15
65
13-03-2020
9
https://www.galerieslafayette.com/
0.15
72
13-03-2020
10
https://www.rueducommerce.fr/
0.15
78
13-03-2020
11
https://www.thomann.de/fr/index.html
0.15
58
13-03-2020
12
https://www.zalando-prive.fr/
0.16
46
13-03-2020
13
https://www.showroomprive.com/
0.16
71
13-03-2020
14
https://www.groupon.fr/
0.16
54
13-03-2020
15
https://www.laredoute.fr/
0.16
78
13-03-2020
16
https://www.oscaro.com/
0.17
50
13-03-2020
17
https://www.leclercdrive.fr/
0.17
48
13-03-2020
18
https://www.cultura.com/
0.18
72
13-03-2020
19
https://www.booking.com/
0.18
41
13-03-2020
20
https://www.darty.com/
0.19
58
13-03-2020
21
https://www.ticketmaster.fr/
0.19
60
13-03-2020
22
https://www.fnac.com/
0.19
51
13-03-2020
23
https://www.kiabi.com/
0.19
61
13-03-2020
24
https://www.brandalley.fr/
0.20
65
13-03-2020
25
https://www.voyage-prive.com
0.20
64
13-03-2020
26
https://www.gemo.fr/
0.20
53
13-03-2020
27
https://www.trainline.fr/
0.20
59
13-03-2020
28
https://www.etsy.com/fr/
0.20
65
13-03-2020
29
https://www.expedia.fr/
0.21
65
13-03-2020
30
https://www.manomano.fr/
0.21
68
13-03-2020
31
https://www.aliexpress.com/
0.22
59
13-03-2020
32
https://www.leboncoin.fr/
0.22
68
13-03-2020
33
https://www.ugc.fr/
0.22
61
13-03-2020
34
https://www.fnacspectacles.com/
0.22
63
13-03-2020
35
https://www.ryanair.com/fr/fr/
0.23
60
13-03-2020
36
https://www.feuvert.fr/
0.23
65
13-03-2020
37
https://www.but.fr/
0.23
47
13-03-2020
38
https://www.sephora.fr/
0.23
41
13-03-2020
39
https://fr.bazarchic.com/
0.24
66
13-03-2020
40
https://www.bricodepot.fr/
0.24
53
13-03-2020
41
https://all.accor.com/france/index.fr.shtml
0.24
71
13-03-2020
42
https://www.intermarche.com/
0.24
76
13-03-2020
43
https://www.boulanger.com/
0.25
45
13-03-2020
44
https://www.apple.com/fr/
0.26
73
13-03-2020
45
https://www.fr.lastminute.com/
0.26
47
13-03-2020
46
https://www.intersport.fr/
0.26
74
13-03-2020
47
https://fr.gearbest.com/
0.26
42
13-03-2020
48
https://www.promod.fr/
0.26
58
13-03-2020
49
https://www.etam.com/
0.27
54
13-03-2020
50
https://www.blancheporte.fr/
0.27
59
13-03-2020
51
https://www.asos.fr/
0.28
52
13-03-2020
52
https://www.zalando.fr/
0.28
43
13-03-2020
53
https://www.materiel.net/
0.28
72
13-03-2020
54
https://www.alibaba.com/
0.28
37
13-03-2020
55
https://www.bricoprive.com/
0.29
45
13-03-2020
56
https://www.leclercvoyages.com/
0.29
63
13-03-2020
57
https://www.bonprix.fr/
0.29
61
13-03-2020
58
https://www.vertbaudet.fr/
0.30
36
13-03-2020
59
https://www.cdiscount.com/
0.30
51
13-03-2020
60
https://www.cinemaspathegaumont.com/
0.31
71
13-03-2020
61
https://www.auchan.fr/
0.31
66
13-03-2020
62
https://www.ebay.fr/
0.31
51
13-03-2020
63
https://www.yves-rocher.fr
0.31
35
13-03-2020
64
https://www.ldlc.com/
0.31
50
13-03-2020
65
https://fr.shein.com/
0.31
39
13-03-2020
66
https://www.just-eat.fr/
0.32
51
13-03-2020
67
https://www.lahalle.com/
0.32
54
13-03-2020
68
https://www.carrefour.fr/
0.32
35
13-03-2020
69
https://www.spartoo.com/
0.33
65
13-03-2020
70
https://www.zooplus.fr/
0.34
38
13-03-2020
71
https://www.digitick.com/
0.34
27
13-03-2020
72
https://www.maisonsdumonde.com/FR/fr
0.35
39
13-03-2020
73
https://www.camaieu.fr/
0.36
30
13-03-2020
74
https://www.ubaldi.com/accueil/
0.36
40
13-03-2020
75
https://www2.hm.com/fr_fr/index.html
0.36
66
13-03-2020
76
https://www.oui.sncf/
0.37
41
13-03-2020
77
https://www.electrodepot.fr/
0.37
30
13-03-2020
78
https://www.easyjet.com/fr
0.38
48
13-03-2020
79
https://www.privatesportshop.fr/
0.38
44
13-03-2020
80
https://www.sarenza.com/
0.38
68
13-03-2020
81
https://www.vinted.fr/
0.40
62
13-03-2020
82
https://www.castorama.fr/
0.40
57
13-03-2020
83
https://www.instant-gaming.com/fr/
0.40
42
13-03-2020
84
https://www.ouigo.com/
0.42
62
13-03-2020
85
https://www.nocibe.fr/
0.42
41
13-03-2020
86
https://www.amazon.fr/
0.44
44
13-03-2020
87
https://www.samsung.com/fr/
0.46
22
13-03-2020
88
https://www.aroma-zone.com/
0.46
46
13-03-2020
89
https://www.ikea.com/fr/fr/
0.47
34
13-03-2020
90
https://www.nike.com/fr/
0.48
27
13-03-2020
91
https://www.conforama.fr/
0.49
43
13-03-2020
92
https://www.opodo.fr/
0.50
28
13-03-2020
93
https://fr.shopping.rakuten.com/
0.50
26
13-03-2020
94
https://www.gifi.fr/
0.57
38
13-03-2020
95
https://www.airbnb.fr/
0.61
56
13-03-2020
96
https://www.adidas.fr/
0.65
53
13-03-2020
97
https://www.backmarket.fr/
0.70
41
13-03-2020
98
https://www.micromania.fr/
0.79
21
13-03-2020
99
https://www.wish.com/
1.14
35
13-03-2020
100
https://www.zara.com/fr/
5.71
34
13-03-2020
Your e-commerce website is not in this ranking, contact-us to take a measurement and appear in this ranking!
For this special “stay at home” battle, two applications offering cooking recipes will oppose: Marmiton et 750g.
In the left corner Marmiton, a French application launched in 2000 which lists more than 71,000 cooking recipes. Marmiton also has 12.8 million unique visitors each month.
In the right corner 750g, created in 2010, is the second site offering recipes and culinary advice the most visited in France (8 million unique visitors each month). This site and application offers more than 80,000 recipes.
The weighting
At weighing 750g is the most caloric application with a weight of 90 MB. The Marmiton application is 61% lighter with a weight of 56 MB, which makes it still a relatively heavy application.
The fight
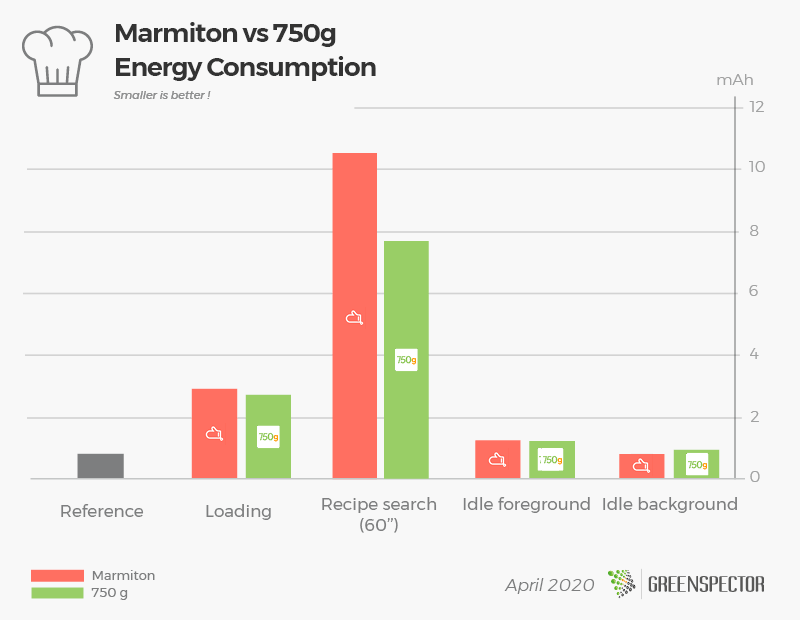
The fighters are getting ready to go on the grill!
In the first part of the match which naturally consists in observing the launch phase of the application, 750g (2.75 mAh) wins the first round by consuming 7% less than its opponent Marmiton (2.93 mAh). In the second round that corresponds to the use scenario (search for a chocolate fondant recipe), it is always 750g (7.69 mAh) which leads to Marmiton (10.48 mAh) with a lower consumption of 36%. To end this confrontation, we have set up two decisive rounds of observation of the rest phases of each opponent. While we are at the tableware stage, the two applications consume in an equivalent manner for the observation phase in the foreground (1.24 mAh). Nevertheless, in the observation phase in the background, Marmiton is in the lead with 14% less consumption.
The timer sounds, end of cooking for our two applications!
The winner
Without any surprise, the 750g application wins this match with an overall score of 12.6 mAh to 15.4 mAh, i.e. 18% less battery consumption compared to its opponent Marmiton, for whom the check is salty… Note that 750g is also less consumer in terms of data exchanged, 286 KB against 693 KB on the side of Marmiton.
Note that these two applications are particularly rich in elements listed by Exodus Privacy as falling under tracking and analytics tools: 11 for Marmiton, 17 for 750g… It makes people squint on your plate.
For those who like numbers
Application
Version
Downloads
PlaystoreGrade
Application weight (MB)
Exchanged data (KB)
Memory consumption (MB)
Energy Consumption(mAh)
Marmiton
5.2.43
5 000 000+
4,5
90
693
642
15,47
750g
4.2.6
1 000 000+
4,4
56
286
339
12,63
On a 1-minute usage scenario, Marmiton’s energy consumption is equivalent to a navigation application such as Google Chrome. As for 750g, its consumption is similar to an application such as a social network such as Instagram. (Source: Study Consumption of top 30 most popular mobile applications)
The measurements were carried out by our laboratory on the basis of a standardized protocol, respecting a specific user scenario (launch of the app, search for a recipe). The other scenarios are the launch of the application (20”), inactivity in the foreground (20”) and inactivity in the background (20”). This methodology makes it possible to estimate the embedded application complexity and its energy impact during the use phase.
Article updated with new measures on StarLeaf, Rainbow and Circuit by Unify on May 19, 2020. Article updated with new measures on Hangouts and Google Meet on May 4, 2020. Article updated with new measures on Tixeo and Infomaniak Meet on April 23, 2020. Article updated with new measures on JITSI and Teams on April 15, 2020.
The current “stay at home” context mechanically increases the use of online collaboration tools, in particular videoconferencing tools. This leads to a pressure on the network and more particularly to a significant load on the servers of each solution. It is therefore important from an efficiency point of view but also an environmental impact one to choose the simplest and most efficient solution.
For this study, we compare 14 videoconferencing applications: Whereby, Webex (by CISCO), Skype, Zoom, JITSI, Microsoft Teams, Tixeo, Infomaniak Meet, Hangouts,GoToMeeting, Google Meet, StarLeaf, Rainbow and Circuit by Unify.
For each of these applications, measured on an Samsung S7 smartphone (Android 8), the following three scenarios were carried out through our GREENSPECTOR Test Runner, allowing manual tests to be carried out over a period of 1 minute:
Audio conference only in one-to-one
One-to-one audio and video conference (camera activated on each side)
One-to-one audio conference and screen sharing
Each measurement is the average of 3 homogeneous measurements (with a small standard deviation). The consumption measured on the given smartphone according to a Wi-Fi type network can be different on a laptop PC with a wired network for example.
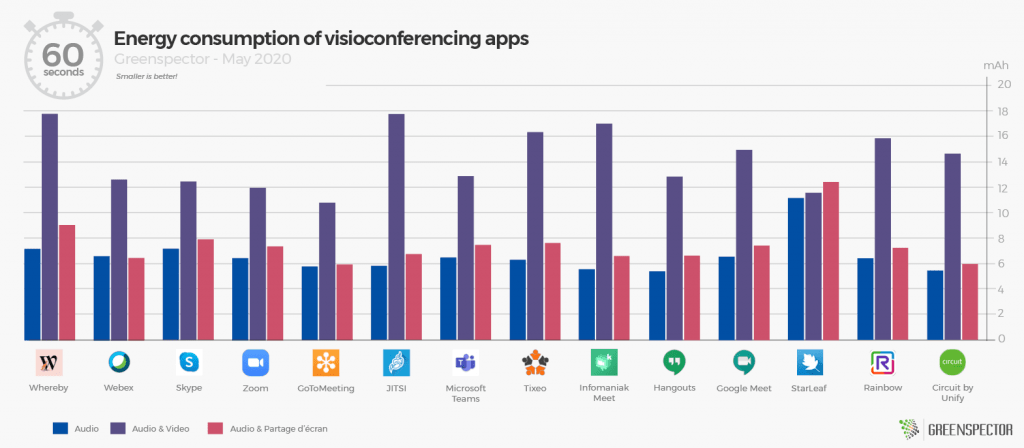
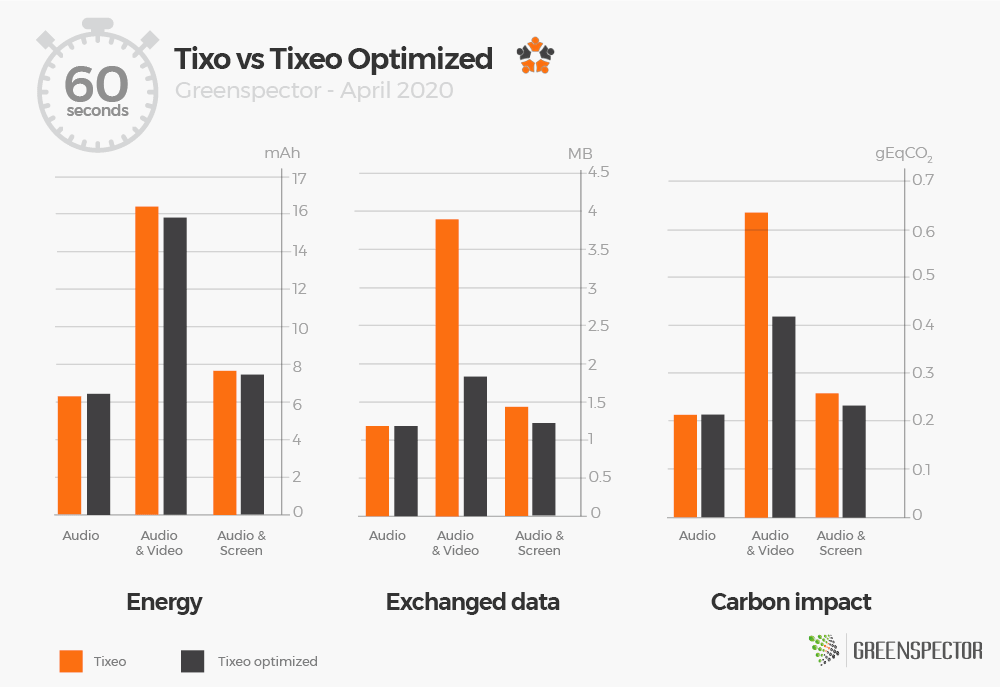
Measurement of energy consumption (mAh)
The StarLeaf application consumes the most of all three scenarios. This is due to the fact that the consumption in audio only mode, audio + screen sharing or audio + video is the same. This is a special case of our study. The GoToMeeting application is the least energy-consuming, closely followed by Hangouts, Zoom and Webex.
The energy consumption of all these applications is on average 2.1 times higher when adding video to audio and only slightly higher when adding screen sharing to audio (+14%). It’s not a surprise, avoid sharing with a camera to consume less energy on your devices during your video conferences and save your autonomy and the lifespan of your battery!
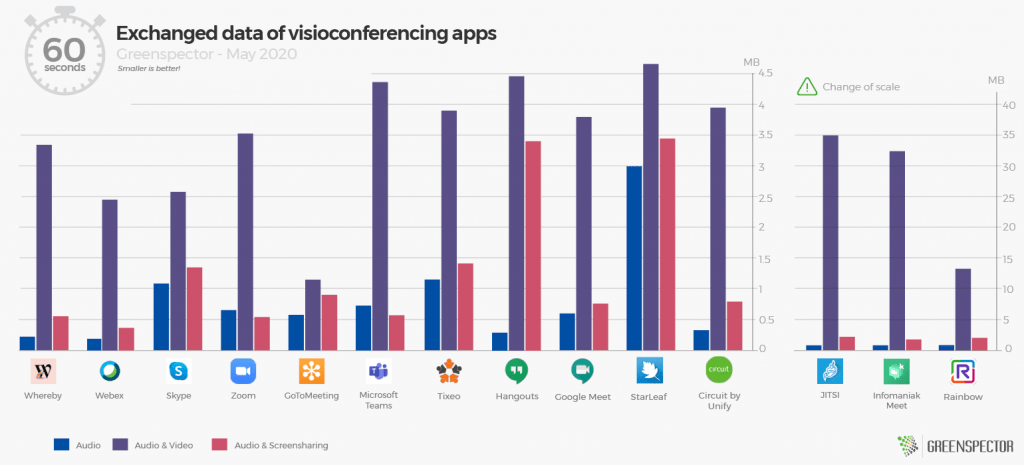
Measurement of data exchanged (MB)
GoToMeeting and Webex are the two applications that consume the least data. JITSI and Infomaniak Meet are the ones that consumes the most. Overall and without any surprise we note that the audio scenario is the one that consumes the least data. While the scenario activating both audio + video stream is the most consuming one.
The data consumption of all of these applications is 13 times higher when adding video to audio and almost doubled when adding screen sharing to audio (+77%). It’s not a surprise, avoid sharing video and limit your screen sharing to consume less data on networks in your video conferences!
It should be noted that these significant differences are mainly due to the significant audio-video consumption of the JITSI application with 35 MB transferred in 1 minute compared to 1.13 MB for GoToMeeting! JITSI‘s optimized mode does not reduce this data impact (33.4 MB / minute). Infomaniak Meet based on the JITSI engine meets the same volume anomaly on average and mainly on the audio + video part without improvement with the optimized mode.
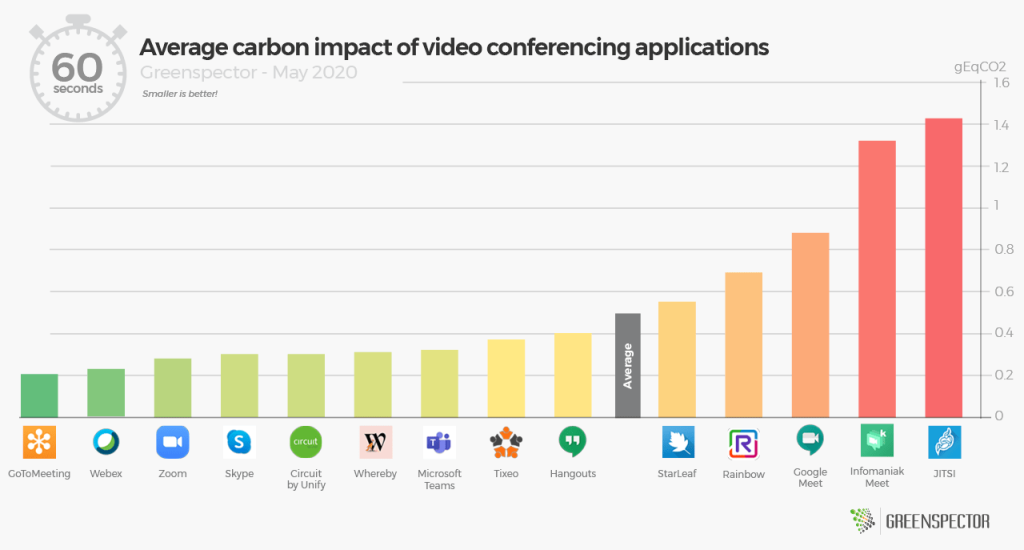
Projection of the measured carbon impact data (gEqCO2)
A conference on mobile is 3 times more impactful for the environment when we add video to audio.
The carbon impact projection of all of these applications is on average 3 times greater when adding video to audio and higher when adding screen sharing to audio (+35%). It’s no surprise, avoid sharing video and limit your screen sharing to less impact infrastructure (network, datacenter) and on your devices in the context of video conferences!
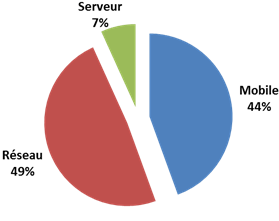
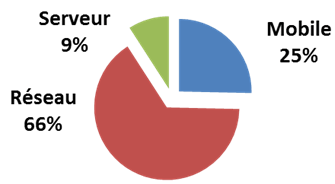
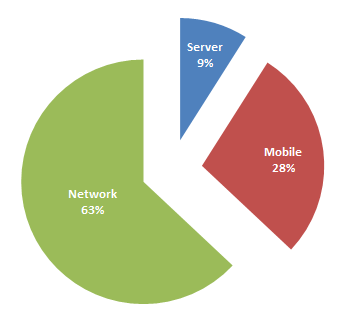
Without any surprise, a large part of the carbon impacts are located on the network part (63%) but the impacts part on the device (28%) should not be overlooked!
The JITSI and Infomaniak Meet apps even averages 5.8 times more impact when adding video to audio and 40% more when adding screen sharing.
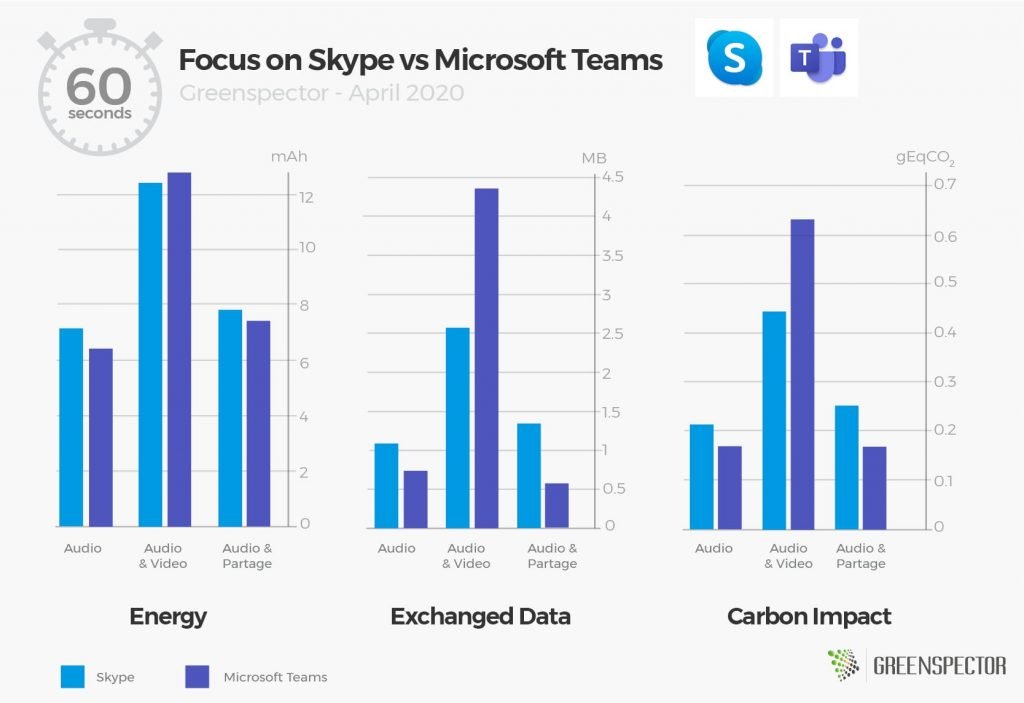
In the Skype vs Teams battle at Microsoft, the overall results are very close (6%). The Carbon impact is lower for Skype with a lower data impact but higher energy consumption on the mobile than Teams.
Which applications optimize energy and data consumption?
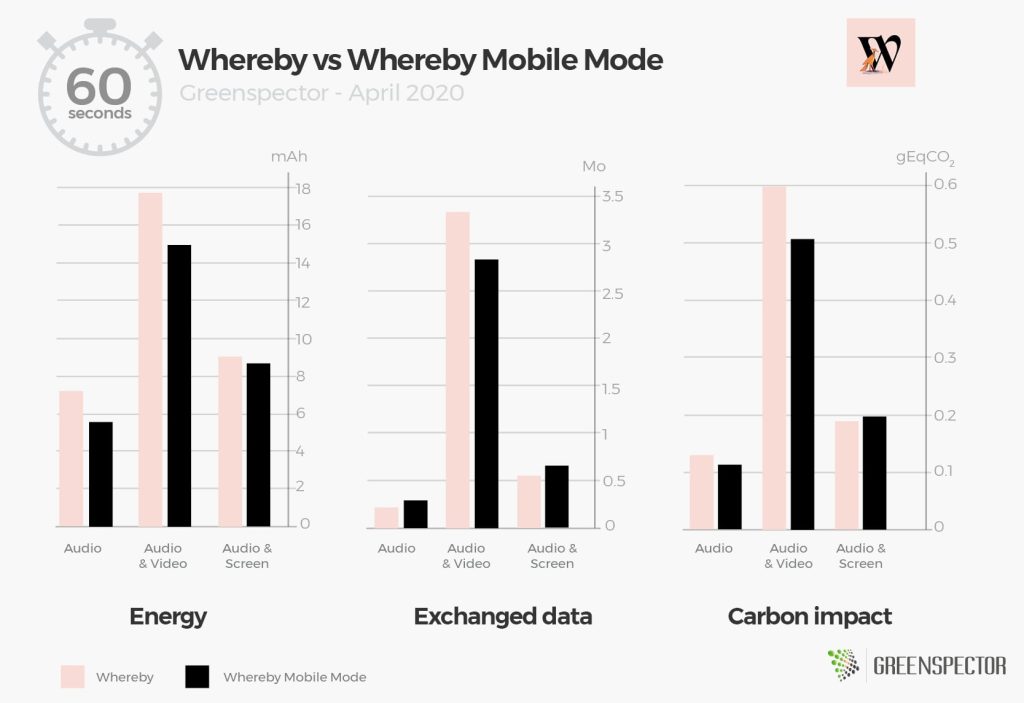
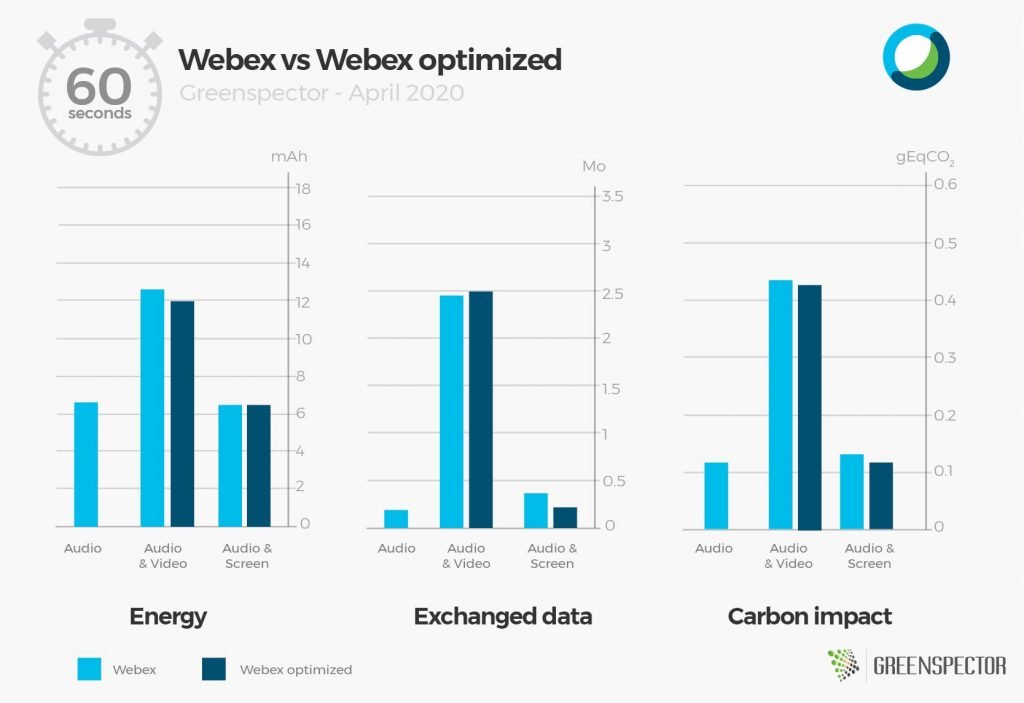
Only Whereby and Webex could be tested on optimization features for the mobile version.
The Whereby application with its “Mobile mode” setting which limits the resolution of the stream as well as other resource consumption optimizations. And Webex thanks to its configuration allowing to deactivate High-definition playback of videos only. Whereby saves 21% on energy consumption on the audio side, 15% on the audio and video side and 3% on the screen sharing side. These gains are nevertheless low considering the results obtained by the application that consumes the most audio and video mode from our panel.
On the Webex side, the gains are barely visible as limited only to the video part. It’s barely 5% gain in the Audio and Video scenario for the energy and carbon impact. The exchanged data is even slightly higher in audio and video mode.
The optimized JITSI application does not improve the data or energy impact. Power consumption is even higher in screen sharing mode in this optimized mode. However, there is a reduction in the data loaded in this optimized but minor mode (11% on average). Same findings for Infomaniak Meet.
The optimization of the TIXEO parameters makes it possible to considerably reduce the impact in audio + video mode and allows it to be classified as the 2nd least impacting application in the panel.
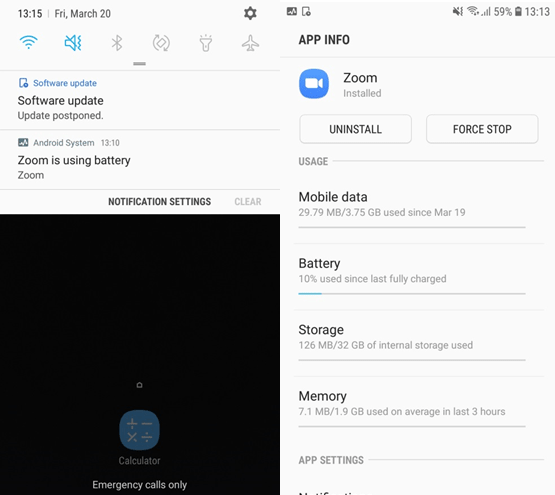
As for the Zoom application, a notification of battery overconsumption appeared several times during the measurements. Although we can optimize the video quality on PC, it does not seem possible to configure this on mobile. Without this optimization, the application becomes the most energy-consuming application in audio + video mode.
GREENSPECTOR advices:
Promote audio only during your conferences: the video stream will tend to consume much more especially when sharing video via camera.
We recommend that publishers provide optimization options to the user and make them as accessible as possible even by default.
Prefer videoconferences over travel by car!
Comparison for 2 people who talk to each other for 3 hours in video + video (1 gEqCO2 on average per minute) when one of the two made 20 kms (112 g eqCO2 / km in France) round trip for a face-to-face face,
In videoconference: 180 * 1 * 2 = 360 gEqCO2.
By car: 112 * 20 = 2.4 kg EqCO2. Or 6.7 times more for the physical one-to-one.
On the occasion of Change Now 2020 which takes place in Paris (Grand Palais) from January 30 to February 1, GREENSPECTOR measured the energy consumption (mWh) of the main partners websites.
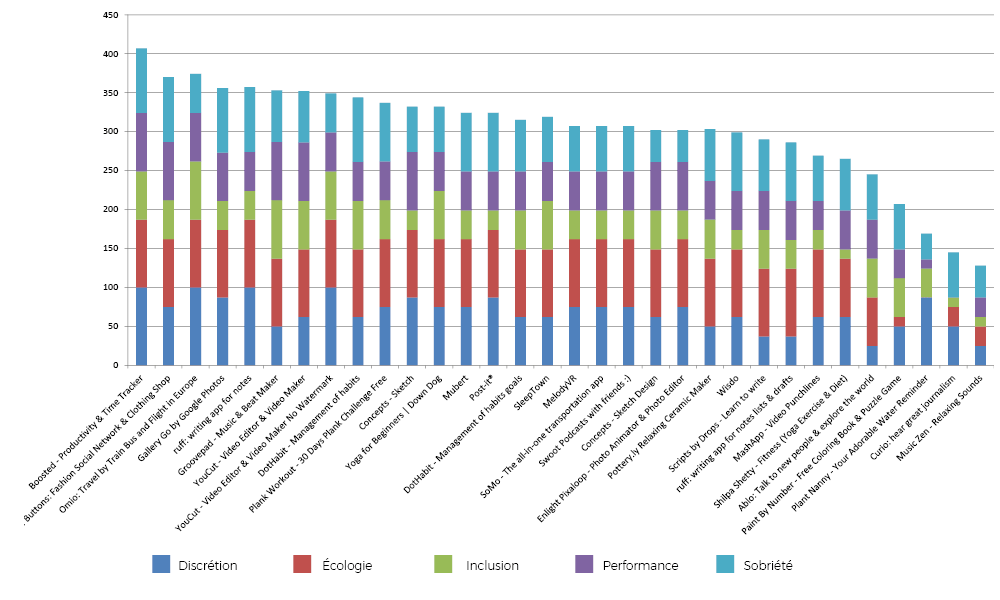
Google unveiled the best of 2019 Google Playstore in early December last year. Thanks to the GREENSPECTOR App Mark technology, we are revealing the ranking of these applications according to the App Mark, which assesses applications according to 5 criteria: performance, sobriety, discretion, inclusion and, of course, ecology.
Favorite 2019 applications ranking
At the top of this ranking we find the following three applications: Boosted, 21 Buttons and Omio. Only 1/3 of the applications are below the global ecoscore average. Among the 3 least sober applications of this ranking, 2 are strongly impacted by a zero score on at least one of the key indicators. In fact, the Plant Nanny application presents a score of zero on the ecological side (32 MB of data loaded during our evaluation), for the Curio application, it is the performance indicator which is zero, impacted by the time of application loading more than 23 seconds.
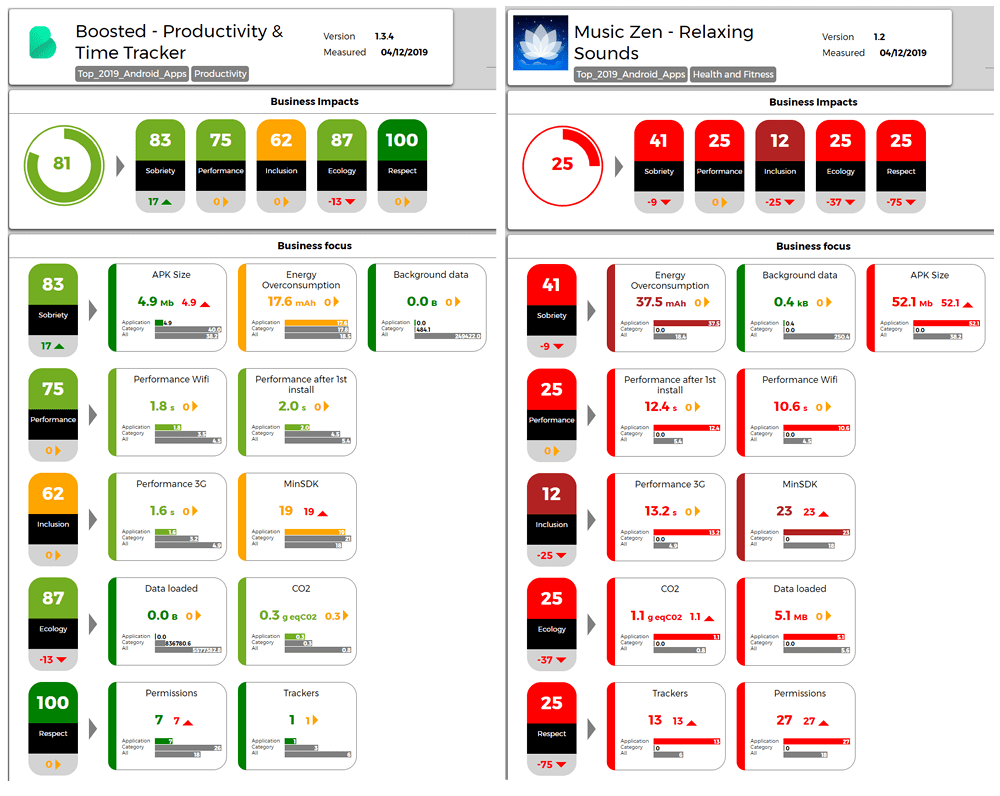
Focus on Boosted vs Music Zen
Here we compare the application with the best GREENSPECTOR App Mark (Bosted) versus the lowest ranked application in this ranking (Music Zen).
Even if the energy consumption is not the strong point of Boosted, MusicZen consumes 2 times more battery than Boosted on an identical route … what not to be “Zen” For its autonomy! Simple explanations: there are many trackers in this application which alters its performance and its sobriety. As a reminder, an added tracker also means an average of 8.5% more resource consumption.
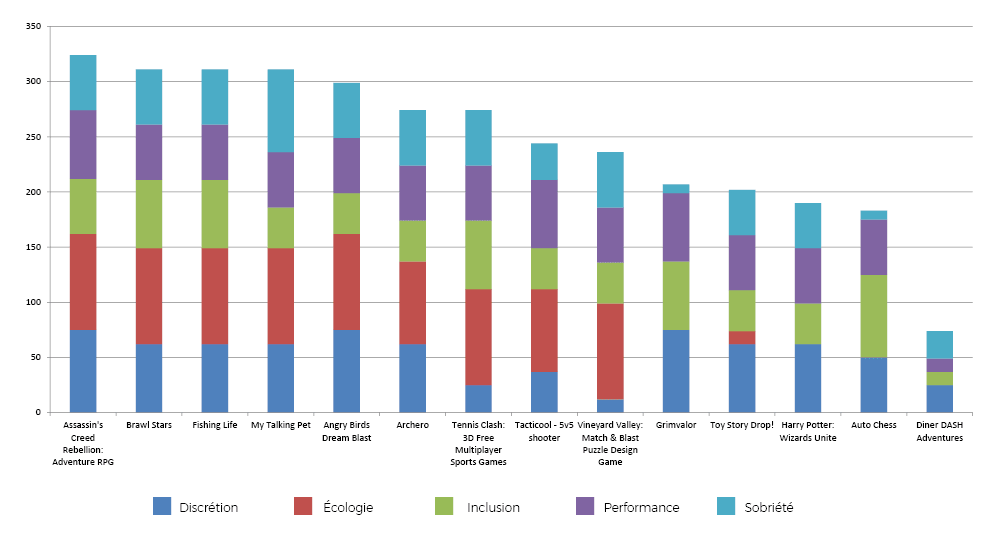
Favorite 2019 games apps ranking
On the podium of the highest ranked game applications, we find: Assassin’s Creed Rebellion, Brawl Stars and Fishing Life. We observe that the last three game applications have a zero score for the ecology indicator. This is explained by two highly high technical criteria: the volume of data loaded as well as the CO2 impact. By the way, gaming applications are also more impactful on average than other applications.
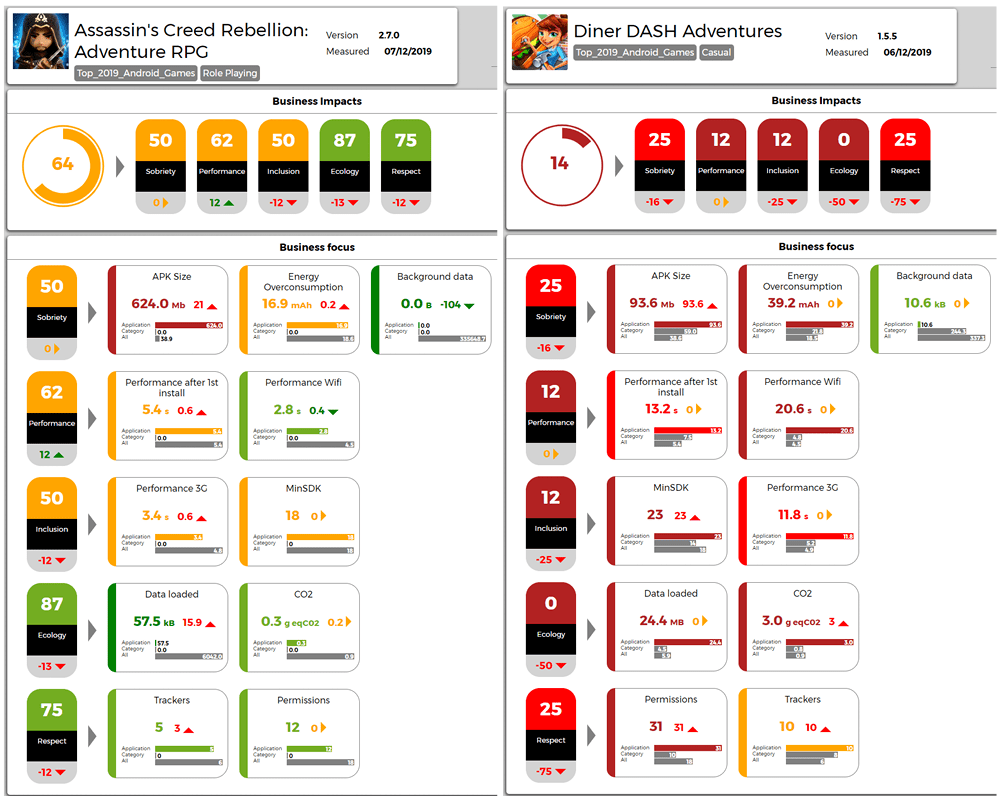
Focus on Assassin’s Creed Rebellion vs Diner Dash Adventures
This time we are comparing the Assassin’s Creed Rebellion application versus Diner Dash Adventures.
The 2024 edition of this ranking is available! Read the study
The web browser is a main tool on a mobile device. Not only for websites but also for new applications based on web technologies (progressive web app, games, …).
In our 30 most popular mobile apps ranking, among the mails, direct messaging, social networks, browsers categories, web browsing and social networks are on average more consuming than games or multimedia applications. The ratio would be 1 to 4 between the least and most energy consuming applications.
Decreasing the environmental impact of the digital life and increasing the autonomy of phones go in part through the choice of a good browser. Just as if you want to reduce the impact of your mode of transport, it is important to take the most efficient vehicle.
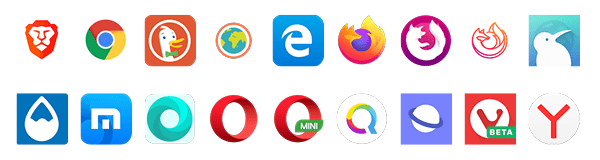
Last year we published the 2018 ranking of the least energy-consuming browsers, we made a new edition for 2020, more complete, made with our GREENSPECTOR App Mark.
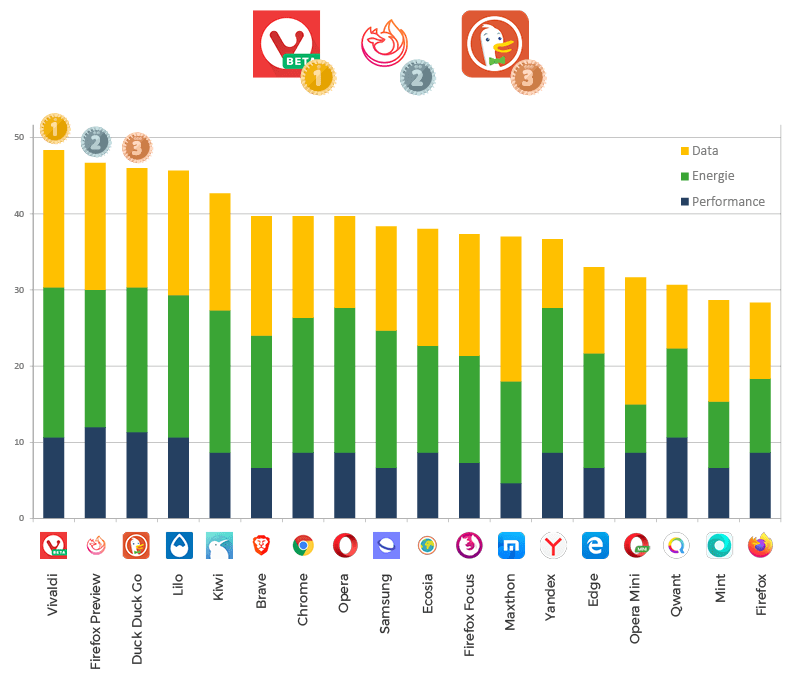
Overall Ranking
The average rating is 36/100 which is pretty mediocre. It can be explained by low notes for each of the metrics. The three least energy-consuming browsers are: Vivaldi, Firefox Preview, Duck Duck Go.
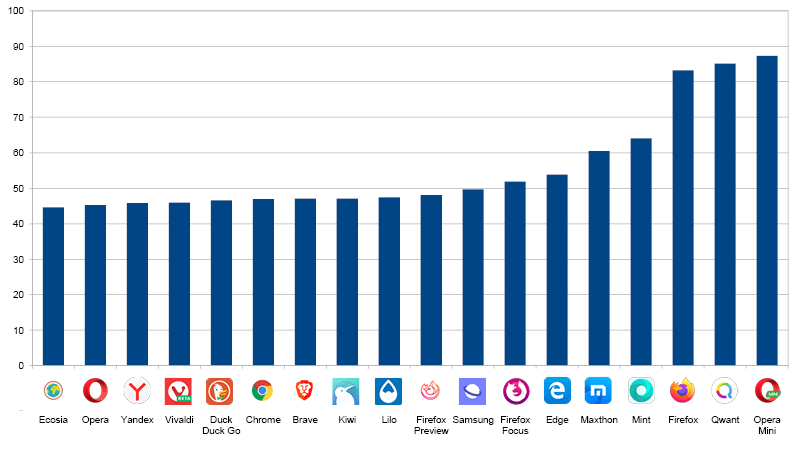
Overall energy consumption (in mAh)
The median is 47 mAh and a large part of the browsers are in this consumption level (8/18 are in the 2nd quartile). Note that the last 3 browsers in the ranking are recognized by a consumption 75% higher than the median. Firefox, Qwant and Opera Mini are indeed very energy intensive.
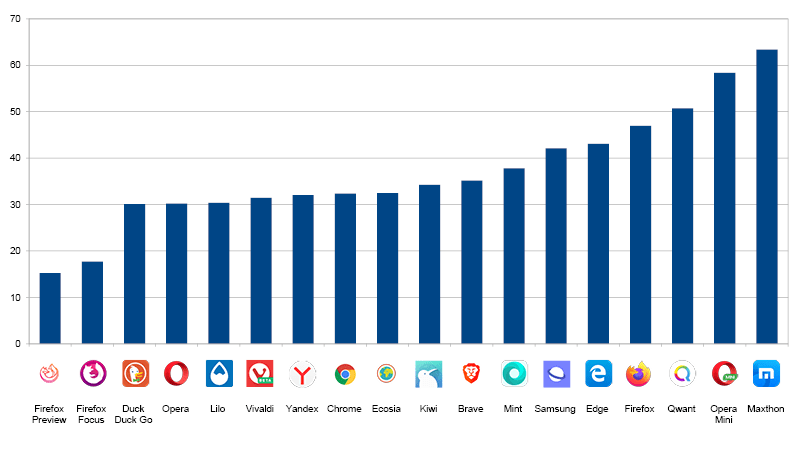
Energy consumption of navigation (in mAh)
The last 3 browsers of the global ranking (Opera Mini, Firefox and Qwant) as well as Mint consume much more than the average (between 20 and 35 mAh against 16 mAh).
It is sufficient to say that for most browsers (apart from the previous exceptions), pure navigation is not going to be the reason for the difference in overall consumption. This is mainly due to the use of visualization engines. Most browsers use the Chromium engine. For Opera Mini, the specificity is that a proxy is used and can compress the size of the sites. It seems that this proxy is not good for the energy, in fact the decompression on the user’s phone consumes a lot of energy.
For the Firefox app, over-consumption of energy is a known and shared thing, this is one of the reasons why Mozilla is under development of a new browser. Internal code name is Fenix and public one is Preview. The measures in this ranking are rather encouraging on consumption (in the average). For Qwant, this is due to the use of the Firefox engine! The measurements between Qwant and Firefox are indeed very close.
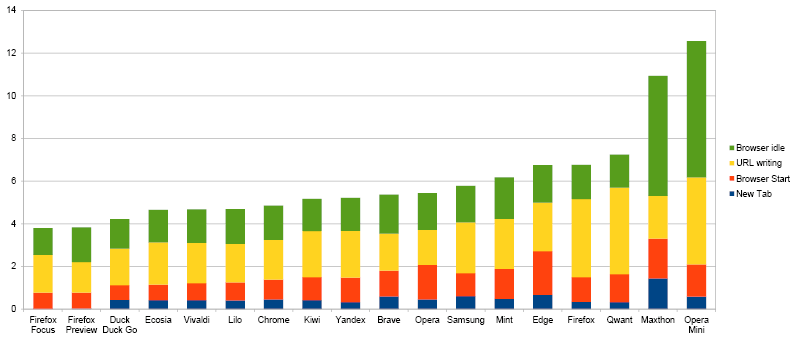
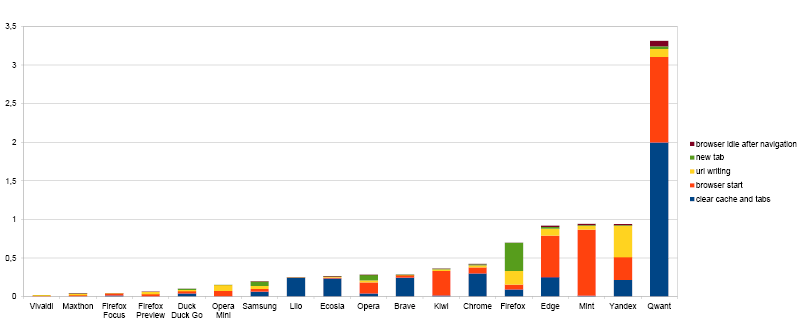
Power consumption of features (in mAh)
The main feature that is browsing the web also requires other important features: new tab opening, enter an address in the taskbar … Indeed, when we open a new tab, each browser offers different features: mainly used websites, latest news, …
On pure navigation, browsers differ little, there are significant differences in energy consumption on other features with a ratio of more than 3 (between 4 mAh and 12 mAh).
Note that the first 3 (Firefox Focus, Firefox Preview and Duck Duck Go) have a simple homepage. The consumption of the browser in Idle (inactivity) is then very low. Functional sobriety pays the consequences!
When launching browsers, the energy consumptions are quite similar to each other. Note, however, that opening a tab and writing a URL are actions that are performed several times. If we take a daily projection of 30 new tabs and 10 URL entries, we can still see the difference between browsers and the large advance of Firefox Preview and Focus!
The basic features are not insignificant in the overall consumption.
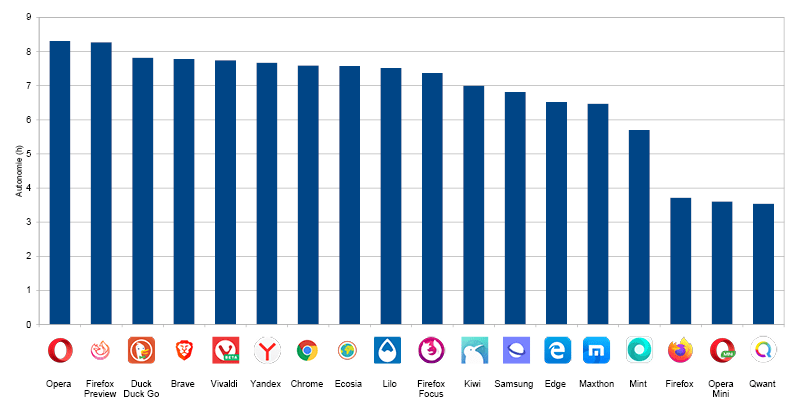
Projection of autonomy (in number of hours)
If we take this energy data and project it for a navigation of several websites, we identify the maximum time that the user can navigate to the complete discharge of his battery:
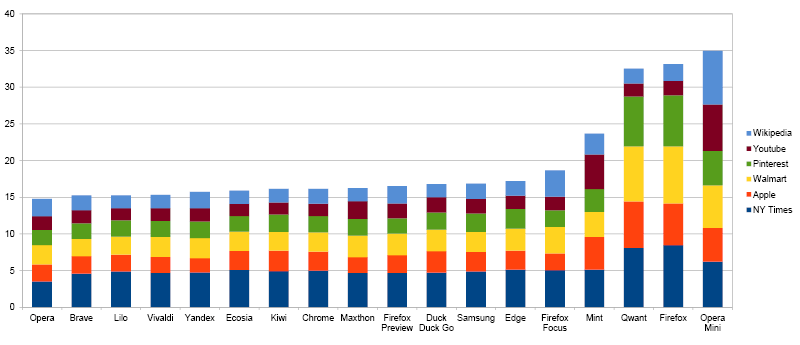
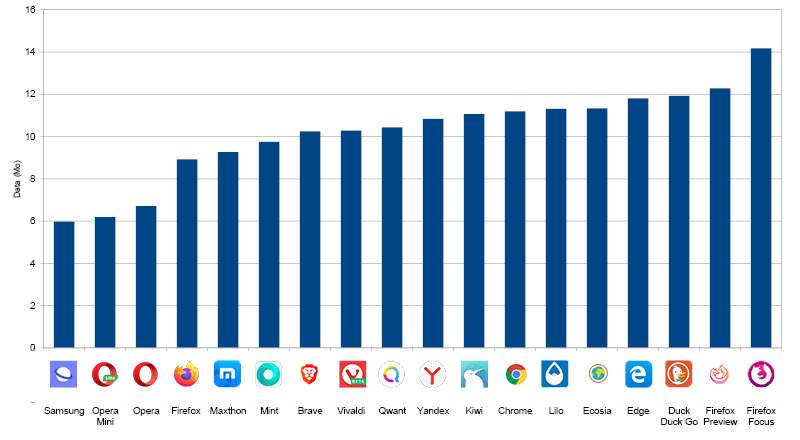
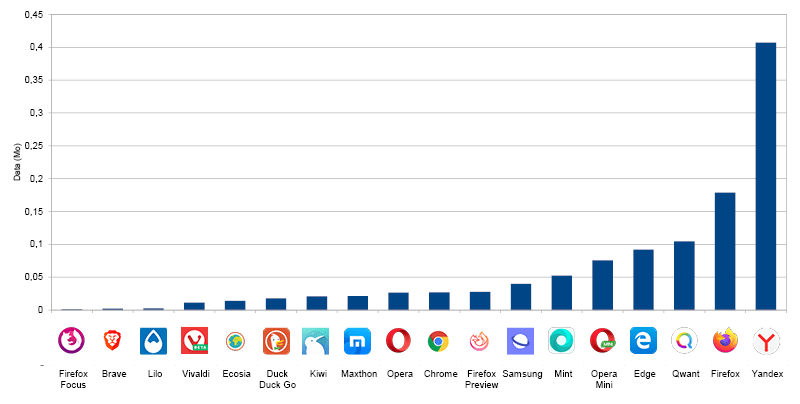
Data consumption (in MB)
The difference in data consumption between browsers (8 MB difference) is explained by the pure navigation and the different features.
On the navigation, we explain this difference:
some applications do not manage the cache at all for reasons of data protection and confidentiality (Firefox Focus)
proxy usage that optimizes data (Opera Mini)
a difference in the implementation of cache management. It is possible that some browsers invalidate the cache and that data is loaded while they are cached.
additional data consumption continues in the background (idle tabs, background data not blocked …)
download performance differences that increase the duration of the measurement. Indeed, if a browser is powerful, the counterpart is that many more data are potentially loaded in the background.
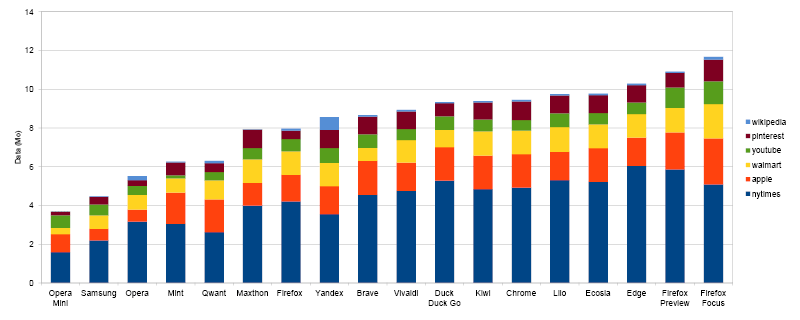
The difference in overall consumption can also be explained by the data consumption of the basic functionalities:
Many browsers are very consuming. We note the 3 MB of Qwant that seem abnormal! It can be considered that for browsers, this consumption should be close to 0. Indeed, the main feature of a browser is to display a website, any feature (and associated consumption) can be considered as “over-consumption”. In this context, many browsers consume data when writing the URL. This is mainly explained by the URL proposal features. There is indeed exchange between the mobile and the servers, either directly by the browser or by the associated search engine.
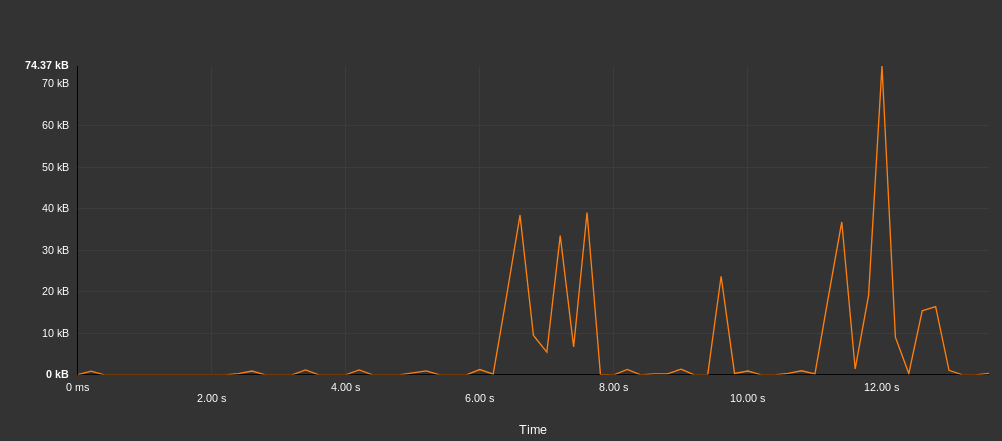
For example, for the Yandex browser below, the details of data exchanges when writing a URL show more than 400 KB of data exchanged.
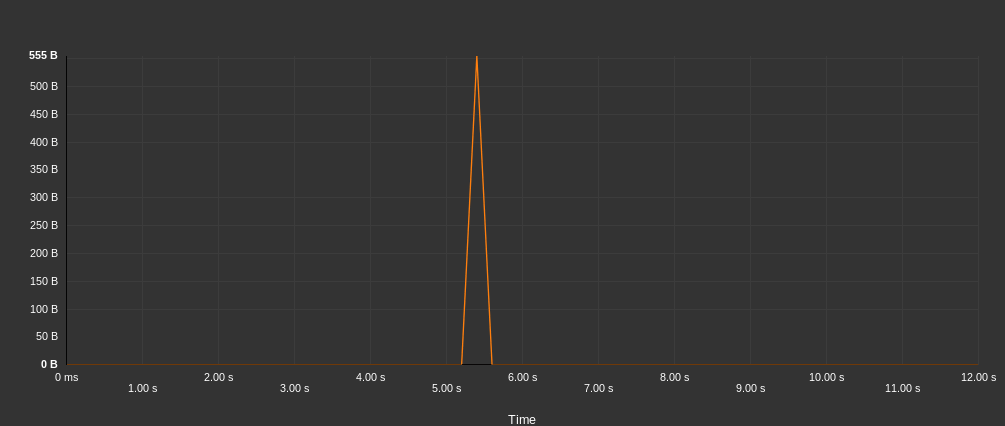
In contrast, below, trading for Brave is frugal with less than 2 KB.
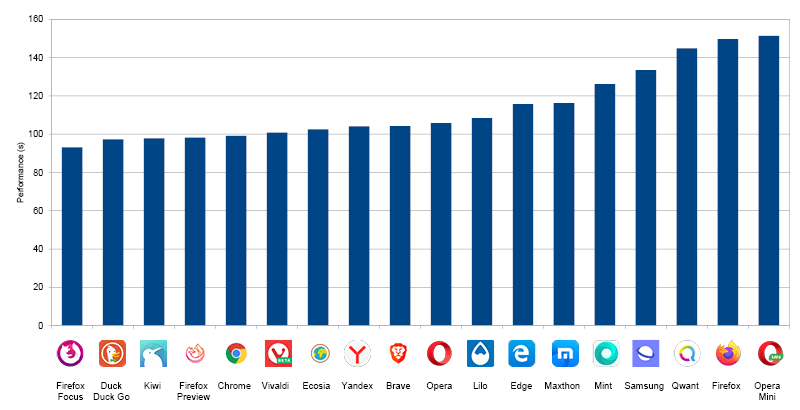
Browser performance (in seconds)
The measures allow us to evaluate the performance of the key features:
Launching the browser
Adding a tab
Writing a URL
Removing the cache
Mozilla Kraken Bench
NB: This study does not evaluate the display performance of websites. However, the Mozilla Kraken benchmark allows this in part by evaluating the functionality of browsers.
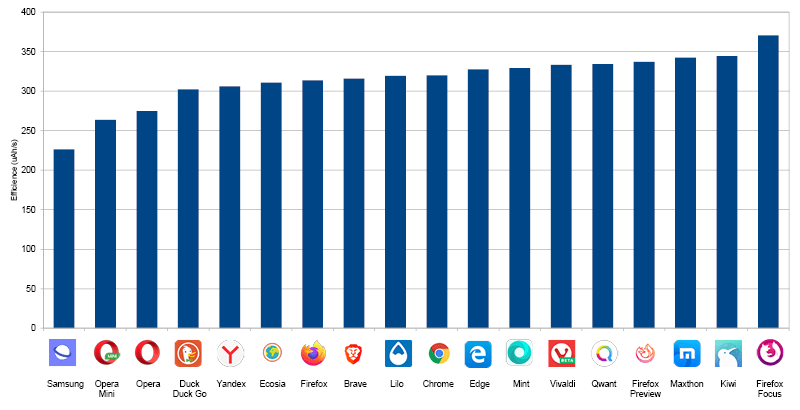
Efficiency of browsers (in mAh/s)
We can evaluate the efficiency of browsers by taking the performance of the Mozilla Kraken benchmark and the associated energy. Efficiency is the energy consumption per unit of time:
Samsung, Opera Mini and Opera are the most efficient browsers. This ranking is different from that of overall energy consumption. For Samsung Internet, this first place in terms of efficiency on a Samsung hardware can be explained by the optimized link that can have the manufacturer with a pre-installed software. The Opera browser has a good positioning (2nd for overall consumption and 3rd for efficiency).
Track of improvements
It is possible to improve the consumption of navigation.
For the user :
Choosing an efficient browser
Use bookmarks or favorites to avoid going through the entry bar
Configure the energy saving options of browsers (mode or dark theme, data server …)
For developers of sites:
Eco-design their site
Test and measure on different browsers to identify different behaviors and take them into account
For browser editors:
Measure energy consumption and efficiency
Eco-design features
Reduce resource consumption of recurring features (url write, new tab …)
Make the homepage as simple as possible.
Measurement protocol
The measurements were carried out by the laboratory GREENSPECTOR App Mark on the basis of a protocol Standardized: Samsung S7 Smartphone, Android 8, Wi-Fi, 50% brightness. Between 4 and 8 iterations were carried out and the value used is the average of these measurements. Measurement campaigns follow a scenario that evaluates browsers in different situations.
Evaluation of features
Launching the browser
Adding a tab
Writing a URL in the search bar
Remove tabs and clean the cache
Navigation
Launch of 6 sites and wait for 20 seconds to be representative of a user journey
At launch (this allows to evaluate the homepage of the browser)
After navigation
After closing the browser (to identify closing problems)
For each iteration, the following tests are performed:
Deleting the cache and tabs (without measurement)
First measure
Second measure to measure the behavior with cache
Remove cache and tabs (with measure)
System shutdown of the browser (and not only a closure by the user to ensure a real closing of the browser)
The average measurement therefore takes into account a navigation with and without cache.
The main metrics analyzed are: display performance, power consumption, data exchange. Other metrics such as CPU consumption, memory consumption, system data … are measured but will not be displayed in this report. Contact GREENSPECTOR for more information.
In order to improve the stability of the measurements, the protocol is completely automated. We use an abstract GREENSPECTOR test description language that allows us to fully automate this protocol. Browser configurations are the default ones. We have not changed any settings of the browser or its search engine.
Rating
A notation out of 100 makes it possible to classify the browsers between them. It is based on the notation of 3 main metrics:
Metric
Definition
Unit
Performance
Duration required for a test step
seconds (s)
Energy
Battery discharge rate found on the device during the test step, compared to the battery discharge rate of the device before the application is launched
Measurements in uAh / s, then classification in multiples of the reference discharge velocity
Data
Total data volume (transmitted + received) during the test step
kilo-bytes (kB)
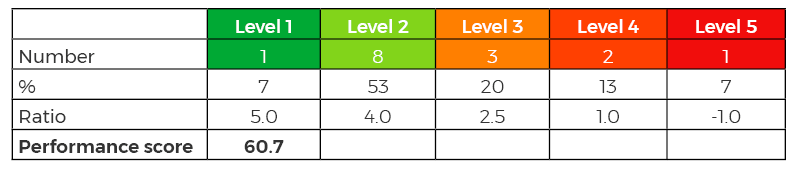
A weighting ratio is applied to the 5 step levels (from 5 for dark green to -1 for dark red) as described in the following example table:
The score of this application is then calculated at 61/100 for the energy metric. Once the score of each of the three metrics obtained on 100 points, the total score of the application is calculated with equal weighting of the three metrics: Total Score = (Performance Score + Energy Score + Score Data) / 3
Browsers evaluated
Browser name
Version
Brave
1.5.2
Chrome
78.0.3904.108
Duck Duck Go
5.32.3
Ecosia
39632
Edge
42.0.4.4052
Firefox
68.3.0
Firefox Focus
8.0.24
Firefox Preview
2.3.0
Kiwi
Quadea
Lilo
1.0.22
Maxthon
5.2.3.3241
Mint
37290
Opera
54.3.2672.502
Opera Mini
44.1.2254.143
Qwant
37714
Samsung
10.1.01.3
Vivaldi
2.7.1624.277
Yandex
19.10.2.116
Some browsers were discarded because they did not allow the tests automation. For instance, UC Browser and Dolphin browsers could not be measured. Beyond automation, this is a symptom of a accessibility issue of the application. To improve the accessibility of applications for people with visual impairments (among others), it is necessary to set up buttons labels. The automation that we realized is based on this information. In the end, these browsers do not appear in the ranking, but we can consider that accessibility problems are in all cases a crippling problem.
Note : The 2020 ranking is hardly comparable to that of 2018. Indeed, our protocol having completely evolved, the tests are thus more advanced and automated.
Greenspector may use cookies to improve your experience. We are careful to only collect essential information to better understand your use of our website.
This website uses cookies to improve your experience while you navigate through the website. Out of these, the cookies that are categorized as necessary are stored on your browser as they are essential for the working of basic functionalities of the website. We also use third-party cookies that help us analyze and understand how you use this website. These cookies will be stored in your browser only with your consent. You also have the option to opt-out of these cookies. But opting out of some of these cookies may affect your browsing experience.