12 Rules to your application success

Reading Time: 4 minutes

In a previous article on this blog, we introduced you the 5 keys to success of a mobile application. We present today the 12 rules by business indicator to respect that will make the success of your application.

Inclusion

  • The application must be usable in degraded network conditions
  • The application should not require a recent OS version like Android to be used. Some users do not follow updates, either voluntarily or because of their platform that does not allow them. According to our “PlayStore Efficiency Report 2019“, only 70% of apps on the store are compatible with all versions of Android.
  • The application must comply with the accessibility rules and must not exclude users with disabilities.
  • The app should work well on older phones too only on recent and latest models. This criterion will be degraded if you do not respect that of sobriety. 1/4 of the Google PlayStore applications are 10% of the oldest mobiles. (Source: PlayStore Efficiency Report 2019)

Sobriety

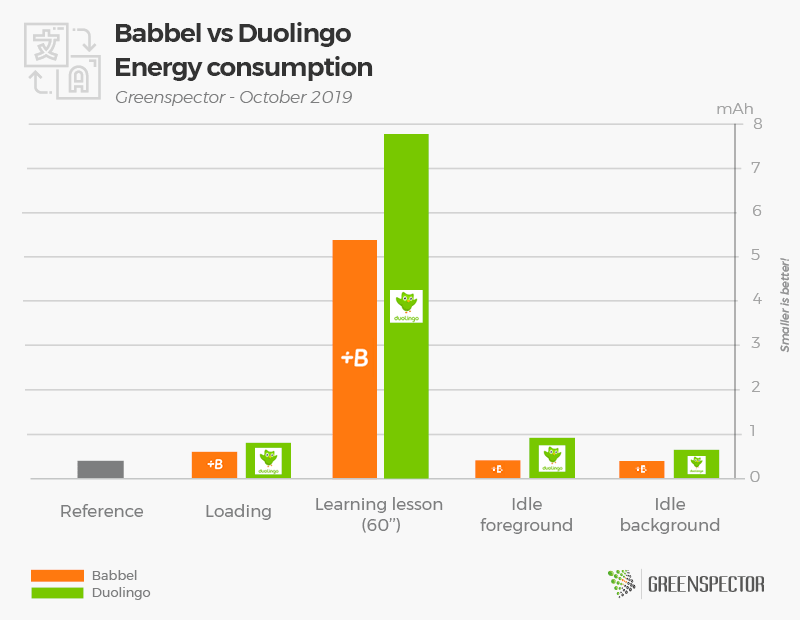
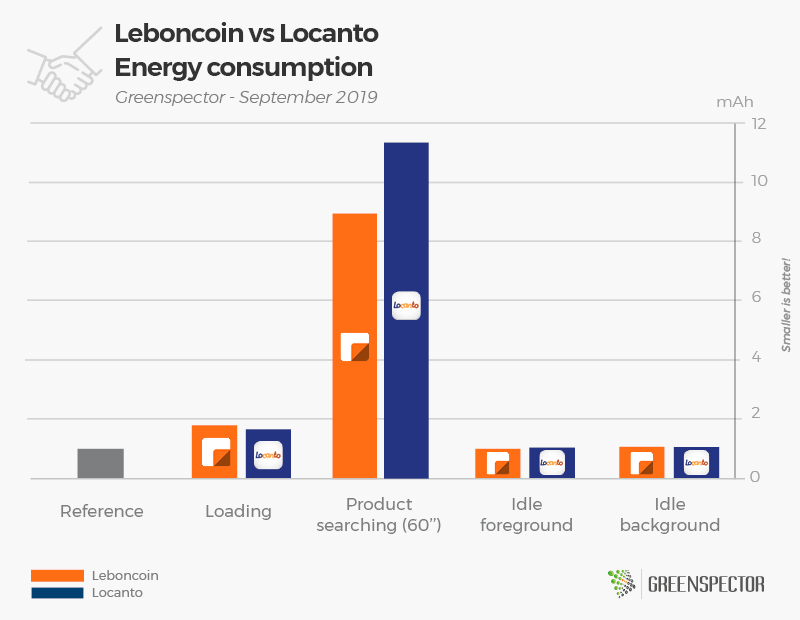
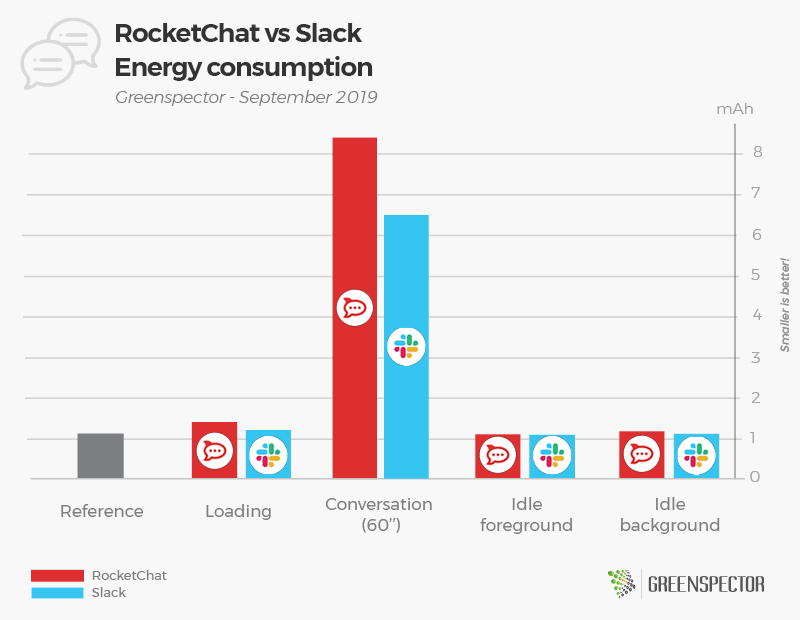
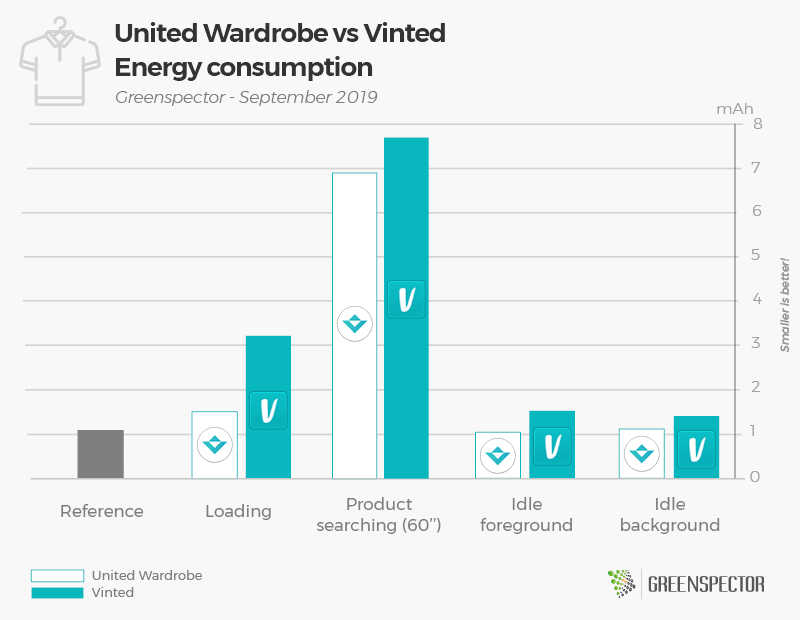
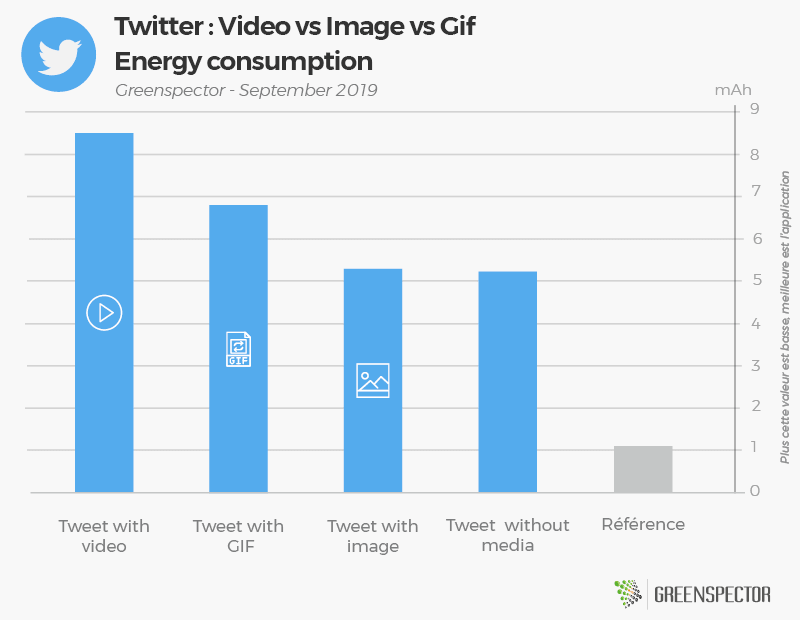
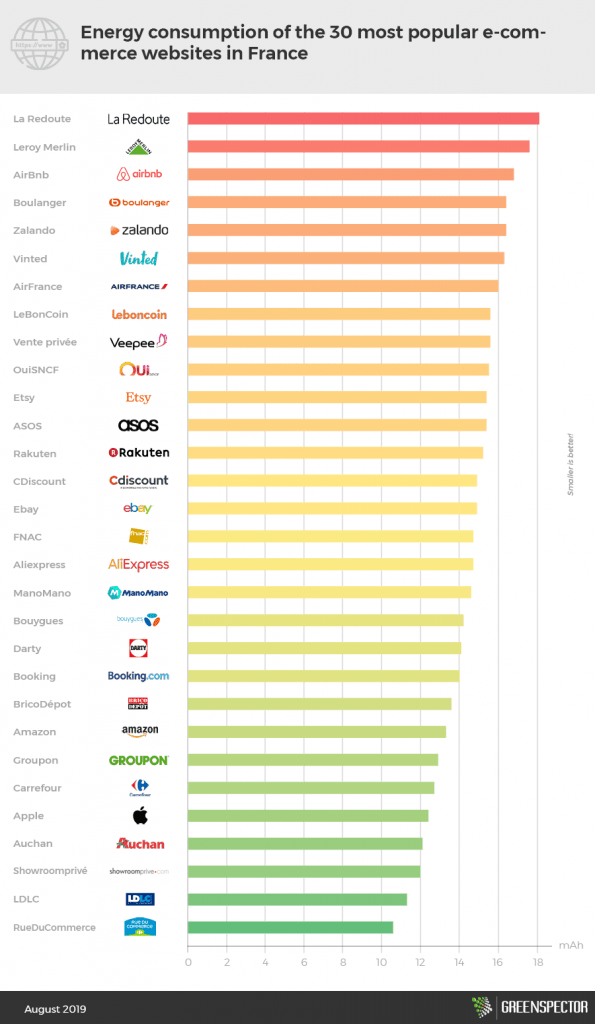
  • The application must limit its energy consumption so as not to empty the user’s battery. Moreover, in case of excessive consumption, the system notifies the user of anapplication as a consumer. Some energy-intensive applications can reduce battery life to less than 3 hours. (Source: PlayStore Efficiency Report 2019)
  • The application must limit its resource consumption (number of CPUs, memory occupied, data exchanged) in order to avoid any slowness or pollution of the other applications (for instance because of the memory leak). 50% of Google PlayStore apps continue to process after the app closes. (Source: PlayStore Efficiency Report 2019)
  • The application must limit its network consumption in order to not involve any load on the data centers and thus avoid the additional costs related to the unnecessary congestion of the servers.

Performance

  • The first launch of the application must be fast: otherwise, it is possible that your users won’t go further, the inclusion criterion will not be respected either.
  • The loading times of the application must be acceptable in all network situations.

Discretion

  • The application requires few or no permission. Do you really need to consult the list of contacts of your user? It’s all the more important to optimize this since the more permissions there are, the more the application consumes resources. This will therefore negatively influence the performance criterion.
  • The application has little or no tracker. The integration of a large amount of trackers implies a greater consumption of resources but can also cause bugs. This observation is even more true that the connection is degraded. On average, adding a tracker causes an over-consumption of resources of 8.5%.(Source : PlayStore Efficiency Report 2019)

According to our “PlayStore Efficiency Report 2019“, trackers, analytics and permissions are ubiquitous (44% applications have more than 5).

Ecology

  • The application must respect the sobriety criterion, the CO2 impact linked to the use is lower as well as the pressure of the resources on the components of the equipment of the user (battery obsolescence, loss of performance). As a result, the user is less likely to renew their equipment, which reduces the risk of obsolescence of his material. Our latest study shows that mobile apps contribute at least 6% of CO2 emissions digital.

Some tracks for the improvement of its GREENSPECTOR App Mark score

Directly improve the application

Several metrics are evaluated by the GREENSPECTOR App Mark and can be directly improved.

  • Minimum SDK version: Allow Android older versions to avoid the exclusion of users using older generation platforms.
  • Number of trackers: the fewer trackers the application has, the more it will respect the user’s data as well as the protection of his privacy. In addition, trackers via processing and data exchange increase the consumption of the application.
  • APK size: the bigger the binary of the application, the more the network is solicited and the less efficient the application. In addition, a large application size will use the limited storage space of some users.
  • Loaded data: number of loaded data throughout the test run. Limiting this data will reduce the consumption of resources on both the smartphone and the network.
  • Data loaded in the background: when the application is not used, it must limit its impact and send or receive as less data as possible.

More global metrics

Some metrics are directly related to the impact of the application and its efficiency. It is possible to act on it via the previous metrics, see by other axes (functional optimization, improvement of the source code …)

  • CO2: the more the application consumes energy, the more the battery is solicited and become obsolete. This may lead to a premature renewal of the battery or even the smartphone and therefore to a higher environmental impact. Let’s not forget that most of the environmental impact of a smartphone is predominant in its manufacturing phase than in its use phase: keeping it longer reduces its overall impact.
  • Energy Overconsumption: if the application overconsumes, it increases the environmental impact but also creates discomfort for the user especially on the loss of autonomy and generates an additional stress factor.
  • Performance after the first installation: applications sometimes perform additional treatments during the first launch, so the launch time is sometimes increased. It is necessary to limit its treatments because this loss of performance can be inconvenient for the user.
  • Performance: the launch time of the application is an important data for the user. It is necessary to reduce it to the maximum while consuming the least possible resources.
  • 3G Performance: in poor network conditions, it is necessary to master the performance to maintain a good user experience. It is even possible that some users do not have access to the application in the case of degraded performance. Having a frugal service that takes into account the constraints of mobility is therefore a key to success.

What about now?

You are certainly wondering how your application is doing on these 5 indicators. Is it rather virtuous? Is there any risk? How is it ranked against its competitors? Do you have quick progress actions? If you ask us, we will tell you! Contact-us, and we will introduce you to your own inclusive, sober, fast, ecological and discreet evaluation – just like your application very soon.

GREENSPECTOR App Mark, first brand new indicator of mobile applications efficiency

Reading Time: 2 minutes

GREENSPECTOR launches the first efficiency indicator for mobile applications: the GREENSPECTOR App Mark. This indicator reflects the quality of an application to be efficient, sober, inclusive, respectful and ecological. These 5 axes are based on 100 technical tests measured in the laboratory on real smartphones and the recovery of data from the store.

Continue reading “GREENSPECTOR App Mark, first brand new indicator of mobile applications efficiency”

Greenspector study of the energy consumption of Google Play Store mobile apps

Reading Time: 3 minutes

During the Mobile One event, GREENSPECTOR announces a survey of the major mobile consumer trends of the Google Play Store. More than 1000 applications were sifted through for Performance, Sobriety and Inclusion by the measurement tools developed by GREENSPECTOR.

Continue reading “Greenspector study of the energy consumption of Google Play Store mobile apps”

Babbel vs Duolingo

Reading Time: 3 minutes

For this week’s battle, two online language learning apps will oppose: Babbel vs Duolingo.

In the left corner Babbel, a paid online language learning app created in 2007 in Berlin. When it was founded, the german startup was the first company to offer an online language learning service. Today, Babbel offers learning 14 languages.

In the right corner Duolingo, created in 2011, the application also offers language learning, but it is free of charge. Duolingo offers a richer catalog than Babbel’s: 37 languages.

The weighting

At weighing Babbel is the heavier application with a weight of 90 MB. Its opponent Duolingo is lighter with a weight of 56 MB, or 61% less.

The fight

All the lights are now turned on the fighters and the match can finally begin.

In the first part of the battle to measure the impact of the launch phase of the application, Babbel (1.5 mAh) wins the first round by consuming 25% less than his opponent Duolingo (2 mAh). In the second round that corresponds to the use scenario, Babbel (13.5 mAh) still leads to Duolingo (19.5 mAh) with a 31% lower consumption. To end this confrontation, we have set up two decisive rounds of observation of the rest phases of each opponent. Babbel is still the leader of the battle with a consumption of less than 34% for the background inactivity phase and 54% for the foreground inactivity phase.

The bell rings, end of the match!

The winner

Without any surprise, the app Babbel wins this game on a global score of 17.2 mAh at 25.5 mAh, or 32% less battery consumed compared to his opponent Duolingo. Note that Babbel is also much less consumer in terms of data exchanged, 224 KB against 4.9 MB on the side of Duolingo.

For those who like numbers

ApplicationVersionDownloadsPlaystore GradeApp weight (MB)Exchanged data (KB)Memory consumption (MB)Energy consumption (mAh)
Babbel20.36.010 000 000+4.5900.224147.917.2
Duolingo4.37.1100 000 000+4.7564.9230.725.5

On a 1-minute usage scenario, Babbel has a consumption equivalent to that of a video games app such as Candy Crush Saga. As for Duolingo, its consumption is similar to a browser app such as Opera Mini.(Source: Study Consumption of top 30 most popular mobile applications)

The measurements were carried out by our laboratory on the basis of a standardized protocol, respecting a specific user scenario (launch of the app, first lesson). The other scenarios are the launch of the application (20”), inactivity in the foreground (20”) and inactivity in the background (20”). This methodology makes it possible to estimate the embedded application complexity and its energy impact during the use phase.

Find the battle of last week : RocketChat vs Slack
Battles ideas? Contact us!

The battle of the week: Leboncoin vs Locanto

Reading Time: 3 minutes

In just a few years, websites connecting individuals through classified ads have been a huge success. Already very popular at its debuts, Leboncoin has quickly established itself in the ranking of the most consulted e-commerce websites in France, in 2019 it occupies the second position. Today’s match therefore pits the French leader Leboncoin with Locanto, the German website present on the international scene.

In the left corner Leboncoin, French leader in classifieds created in April 2006. Leboncoin is also the second most popular e-commerce website in France.

In the right corner Locanto, German free classifieds website created in June 2006, available in 5 languages in 60 countries.

The weighting

At weighing Leboncoin is the heavier application with a weight of 94 MB. Its opponent Locanto is lighter with a weight of 10 MB, or 89% less.

The fight

All the lights are now turned on the fighters and the match can finally begin.

In the first part of the battle to measure the impact of the launch phase of the application, Locanto (1.6 mAh) wins the first round by consuming 11% less than his opponent Leboncoin (1.8 mAh). The difference in consumption is quite marked also on the product searching phase. Indeed, Leboncoin (8.9 mAh) dishes Locanto (11.3 mAh) K.O with a lower consumption of 21%. To end this confrontation, we have set up two decisive rounds of observation of the rest phases of each opponent. During the foreground phase, Leboncoin is still the master of the game, consuming 2% less. For the inactivity phase in the background it is a perfect draw!

The bell rings, end of the match!

The winner

It’s the Leboncoin app that wins this energy battle with a total score of 12.7 mAh at 14.9 mAh, consuming 14% less than Locanto. battery life with Leboncoin. Nevertheless, on the data exchanged side, occupied memory and storage space, it is Locanto which is the least consumer. In economic terms, if your data plan is limited, it will cost you less with Locanto.

For those who like numbers

ApplicationVersionDownloadsPlaystore GradeApp weight (MB)Exchanged data (KB)Memory (MB)Energy consumption (mAh)
Leboncoin4.36.8.010 000 000+3.9942.9585.312.8
Locanto2.7.125 000 000+4.4100.9317.714.9

On a 1-minute usage scenario, Locanto has a consumption equivalent to that of an application of video games as Clash Royale. While Leboncoin is getting closer to the consumption of an application of direct messaging such as Skype. (Source: Study Consumption of top 30 most popular mobile applications)

The measurements were carried out by our laboratory on the basis of a standardized protocol, respecting a specific user scenario (launch of the app, product searching, product overview). The other scenarios are the launch of the application (20”), inactivity in the foreground (20”) and inactivity in the background (20”). This methodology makes it possible to estimate the embedded application complexity and its energy impact during the use phase.

Find the battle of last week : Twitter : video vs image vs gif
Battles ideas? Contact us!

GREENSPECTOR App Scan is now available on iOS!

Reading Time: < 1 minute

This is a great first for GREENSPECTOR: one of our main solutions is now available in the Apple universe.

Long awaited by our customers, this compatibility with iOS makes it possible to complete the analyzes of type GREENSPECTOR App Scan.

The measures of performance and efficiency on the iPhone complement those on Android. Your applications and your websites benefit from a maximum coverage, representative of the uses of your users, no matter what the underlying technology.

So you can now ensure the quality of user experience across all your mobile devices, under control their performance and efficiency.
Note that because of the restrictions imposed by Apple, all the usual GREENSPECTOR metrics are not yet available. But our teams continue to work to offer you, throughout the versions, analyzes always more pointed on your applications.

RocketChat vs Slack

Reading Time: 3 minutes

Today’s match will oppose two collaborative communication platforms for professional teams: RocketChat and Slack. Collaborative platforms have replaced emails to facilitate exchanges between individuals and teams and also have improved their productivity.

On the left corner RocketChat, is an open-source collaborative communication platform launched in 2016 and has one of the largest numbers of members of the GitHub developer community.

On the right corner Slack, collaborative communication platform created in the USA in 2013. Slack has 10 million active users per day.

The weighting

At weighing RocketChat is the heavier application with a weight of 94 MB. Its opponent Slack is lighter with a weight of 90 MB, or 4% less.

The fight

All the lights are now turned on the fighters and the match can finally begin.

In the first part of the battle to measure the impact of the launch phase of the application, Slack (1.2 mAh) wins the first round by consuming 17% less than his opponent RocketChat (1.4 mAh). In the second round that corresponds to the use scenario, Slack (6.5 mAh) still leads to RocketChat (8.4 mAh) with a 29% lower consumption. To end this confrontation, we have set up two decisive rounds of observation of the rest phases of each opponent. Slack is still the leader of the game with a consumption of less than 3% for the background inactivity phase. For the foreground inactivity phase it is a perfect draw!

The bell rings, end of the match!

The winner

Without any surprise, it’s the Slack app that wins this game with an overall score of 9.9 mAh at 12.1 mAh, a 18% difference in consumption against its opponent RocketChat. For the data exchanged, it is the same observation, the application Slack is less consuming by 84%.

For those who like numbers

ApplicationVersionDownloadsPlaystore GradeApp weight (MB)Exchanged data (KB)Memory consumption (MB)Energy consumption (mAh)
RocketChat3.5.1100 000+2.5941.1176.112.1
Slack19.09.10.010 000 000+4.5907.3181.29.9

On a 1-minute usage scenario, Slack has a consumption equivalent to that of an application direct messaging such as Line. As for RocketChat, its consumption is similar to an application such as Microsoft Outlook. (Source: Study Consumption of top 30 most popular mobile applications)

The measurements were carried out by our laboratory on the basis of a standardized protocol, respecting a specific user scenario (launch of the app, product searching, product overview). The other scenarios are the launch of the application (20”), inactivity in the foreground (20”) and inactivity in the background (20”). This methodology makes it possible to estimate the embedded application complexity and its energy impact during the use phase.

Find the battle of last week : United Wardrobe vs Vinted
Battles ideas? Contact us!

The battle of the week: United Wardrobe vs Vinted

Reading Time: 3 minutes

“Second-hand” clothing applications are a hit with fashion lovers and platforms, and platforms have proliferated in recent years. Today we compare two competing apps: United Wardrobe and Vinted on their mobile energy consumption.

In the left corner United Wardrobe, created in the Netherlands, a real community market designed to buy and sell items from the world of fashion. Their mission is to “democratize used clothes”.

In the right corner Vinted, created in 2012 in Lithuania and which landed in France in 2013, is also a community online market whose purpose is to buy, sell and / or exchange used clothes. 1.4 million users in the hexagon.

The weighting

At weighing United Wardrobe is the heavier application with a weight of 81 MB. Its opponent Vinted is lighter with a weight of 71 MB, or 13% less.

The fight

All the lights are now turned on the fighters and the match can finally begin.

In the first part of the battle to measure the impact of the launch phase of the application, United Wardrobe (1.5 mAh) wins the first round by consuming 52% less than his opponent Vinted (3.2 mAh). In the second round that corresponds to the use scenario, United Wardrobe (6.9 mAh) still leads to Vinted (7.7 mAh) with a 10% lower consumption. To end this confrontation, we have set up two decisive rounds of observation of the rest phases of each opponent. United Wardrobe is still the leader of the game with a consumption of less than 30% for the foreground inactivity phase and 18% for the background inactivity phase.

The bell rings, end of the match!

The winner

Without any surprise, it’s the United Wardrobe app that wins this game with an overall score of 10.6 mAh at 13.8 mAh, a 23% difference in consumption against its opponent Vinted. For the data exchanged and memory consumption, it is the same observation, the application United Wardrobe is less consuming.

For those who like numbers

ApplicationVersionDownloadsPlaystore GradeApp weight (MB)Exchanged data (KB)Memory consumption (MB)Energy consumption (mAh)
United Wardrobe3.9.01 000 000+3.3811.57010.6
Vinted8.41.1.25 000 000+4.5716.313713.8

On a 1-minute usage scenario, Vinted has a consumption equivalent to that of an application like ShareIt. While United Wardrobe is getting closer to consuming an video games app such as PUBG. (Source: Study Consumption of top 30 most popular mobile applications)

The measurements were carried out by our laboratory on the basis of a standardized protocol, respecting a specific user scenario (launch of the app, product searching, product overview). The other scenarios are the launch of the application (20”), inactivity in the foreground (20”) and inactivity in the background (20”). This methodology makes it possible to estimate the embedded application complexity and its energy impact during the use phase.

Find the battle of last week : Leboncoin vs Locanto
Battles ideas? Contact us!

The battle of the week Twitter special: video vs image vs gif

Reading Time: 2 minutes

A special battle for this new season: different media on Twitter: video, image and gif. Which one is the most energy and resource consuming media when viewing a tweet?

The fight

All the lights are now turned on the fighters and the match can finally begin.

In terms of energy consumption, a tweet with video consumes 63% more than tweet with image, and 25% more than tweet with gif . The consumption of the tweet with image is equivalent to that of a tweet without media since the images remain relatively small. Nevertheless the consumption increases when the user clicks on an image and displays it in real size.
On the data side exchanged, without any surprise, the tweet with video is the most consuming media with 1.91 MB, unlike tweets with image (112 KB) and gif (92 KB), a ratio of 20 between the heaviest and the lightest. On the occupied memory side, no significant difference in consumption, the values oscillate between 244 and 228 MB.

The bell rings, end of the match!

The winner

The winning media of this match remains the tweet with image, 63% less consumer than a video and 23% than tweet with GIF. So focus on the image to the video for your tweets. In our study on the energy consumption of the 30 most popular apps in the world , we found that the category of social networks was among the most consuming. Video is the new medium favored by users. Application publishers must be vigilant and optimize their use.

For those who like numbers

ApplicationVersionDownloadsPlaystore GradeApp weight (MB)Exchanged data (KB)Memory (MB)Energy consumption (mAh)
Twitter with video8.10.0500 000 000+4.51001.912448.5
Twitter with image8.10.0500 000 000+4.51000.112228.35.2
Twitter with gif8.10.0500 000 000+4.51000.092231.26.8
Twitter without média8.10.0500 000 000+4.51000.042239.85.3

The measurements were carried out by our laboratory on the basis of a standardized protocol, respecting a specific user scenario: displaying a tweet containing a media (image, video or gif)
Kapten vs Uber

Find the battle of last week: Mixer vs Twitch
Battles ideas? Contact us!

You may also like:

Twitter vs Twitter Lite

L’impact des services tiers comme Twitter sur l’autonomie des batteries

WEBP vs PNG vs JPEG

Energy consumption of the most popular e-commerce websites in France

Reading Time: 4 minutes

We measured the energy and resources consumption of the most popular e-commerce websites in France. Thanks to a recent study of SimilarWeb and ECN introducing a ranking of the Top 100 e-commerce websites, we selected the top 30 websites in this ranking and compared them according to their consumption of energy and mobile resources based on a simple functional path representative of their market activity.

Why measure energy consumption?

A website that consumes less energy will be more efficient because it will be “frugal”, with latency times shorter especially on a mobile phone that can sometimes be already crowded, older or low-tech. We can talk about a better “inclusion” business if the service responds in an acceptable way for users who do not always benefit from a favorable network conditions (degraded or saturated network) in their navigation.
The battery life will also be a curb for the user who does not wish to activate services too greedy for its autonomy, especially if it intends to use them very regularly. But surfing the web via mobile is it consumer on a smartphone? In our 2019 study of the Top 30 most popular mobile apps in the world, we had measured web browsing which is on average the most consuming category compared to video applications, video games or social networks. Tt’s enough to make buyers doubt and value their battery life.

In addition, a less energy-consuming website, and this is not the least argument, ultimately improves the website SEO

Indeed, the statistics of several tens of millions of visits in the month make it possible to imagine the extent of the impact throughout the chain of dissemination of the content and services of these websites. Even a slight improvement will benefit from a very important multiplier of reduction on the totality of the impact, whether on the user side or the server and network infrastructure. The digital actors must absolutely take into account this dimension of environmental responsibility in their business digital because as recalls the Shift Project, the digital climate impact will be equivalent in 2025 to that of light vehicles.

The 5 websites with the lowest energy consumption and the 5 most consuming ones

On the podium of the most energy-efficient websites, we find in first place the Rue Du Commerce website (10.6 mAh), LDLC (11.3 mAh) and ShowroomPrivé (12 mAh). Not far behind are the websites : Auchan (12.1 mAh) and Apple (12.4 mAh). The Rue Du Commerce website consumes 6.2% less than the second most energy-efficient one: LDLC and nearly 27% less than the average ranking (14.5 mAh).

On the side of the most energy-consuming websites, we find in last place the La Redoute website (18.1 mAh) followed by [Leroy Merlin] (https: //www.leroymerlin.fr/) (17.6 mAh) and Airbnb (16.8 mAh). Finally, the websites Boulanger and Zalando (16.4 mAh) share the 26th and 27th place. The most energy-hungry website La Redoute consumes 24% more than the average of the ranking.

Projection

If we project the measured consumption on a Nexus 6 (voltage 3, 7 Volt), therefore only on the smartphone of the user, according to the average time of visit on a month: the flop 3 of the navigations the more consumers over the month are the sites: Leboncoin (99.34 MWh / month), Amazon (56.36 MWh / month), Ebay (19.34 MWh / month) . These 3 sites are at the same time penalized by a large number of visits, a rather long average visit time and a strong consumption of the purchase route.

The top 3 is made up of RueDuCommerce, LDLC and Auchan which are much less frequented but which also have the advantage of being in the best students on the market. consumption of the purchase route. If a site like Leboncoin was at the consumption level of the RueDuCommerce website, they could save their smartphone users more than 30 GWh/month, the equivalent of a country’s electricity consumption. like Haiti.

The projection of this Top 30 e-commerce websites, if all users had a Nexus 6 smartphone according to statistics visits indicated, would be about 3.7 TWh per year, the equivalent of the annual consumption of a country like Somalia. The server and network impacts were not taken into account in this study. It would be interesting to be able to estimate server side with the editors.

Energy consumption of 30 e-commerce websites

Only 12 websites are below the average (14.5 mAh) of this ranking. There is a 1.7 ratio between the least energy-consuming site (Rue Du Commerce) and the most energy-intensive (La Redoute).

Methodology

The measurements were carried out by our laboratory on the basis of a standardized protocol: Nexus 6 Smartphone, Android 6, Wi-Fi, low brightness. 3 campaigns were conducted and the value used is the average of these 3 measurements. The measurement campaigns respect a specific user scenario adapted to each website (launch of Google Chrome, access to the URL of the website, search scenario, selection, basket and display basket)

Summary table of the 5 best sites and the 5 worst ones

WebsiteEnergy consumption (mAh)Exchanged data (Mo)Memory consumption (Mo)
RueDuCommerce10.62337.5
LDLC11.36.3356.4
ShowroomPrivé123.7335.6
Auchan12.14.8347
Apple12.46.6353.6
Zalando16.46332.2
Boulanger16.46332
AirBnb16.86.9371.5
LeroyMerlin17.64346.4
La Redoute18.15390.9

Do you want to access the results of a particular site? Contact us!

Find our latest study: GPS Apps
Comparative study ideas? Contact us!