A few weeks ago, the famous American streamer under the pseudonym of Ninja announced that he left the streaming platform Twitch for its competitor: Mixer. In just a few days, the milestone of one million paid subscribers had been reached and the platform was the top spot for the most downloaded free apps in the United States. Today’s match is between these two competing applications: Mixer vs. Twitch.
In the left corner Mixer, (formerly Beam) the video game streaming service launched by Microsoft in January 2016.
In the right corner Twitch, leading platform for streaming video games (and other broadcasts) launched in June 2011. It has more than 35 million unique visitors per month.
The weighting
At weighing Mixer is the heavier application with a weight of 114 MB. Its opponent Twitch is lighter with a weight of 95 MB, or 16% less .
The fight
All the lights are now turned on the fighters and the match can finally begin.
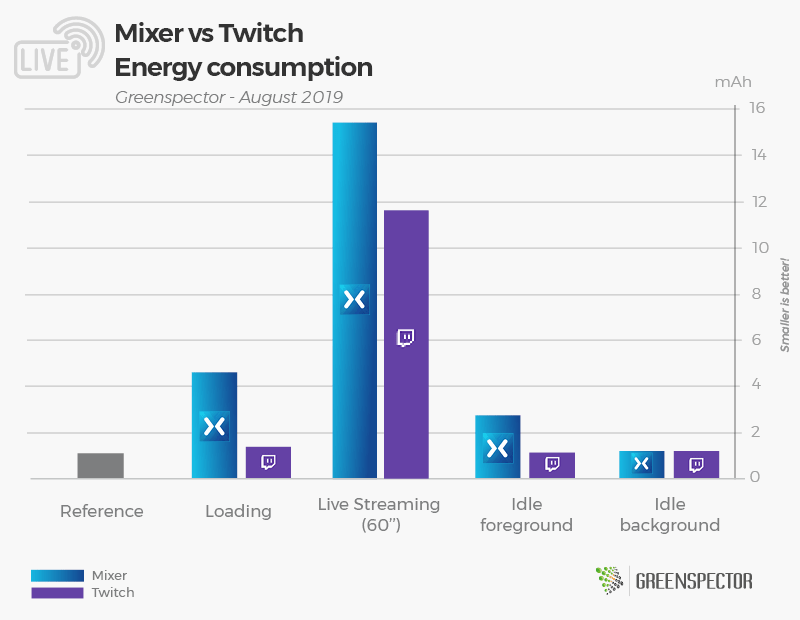
In the first part of the battle to measure the impact of the launch phase of the application, Twitch assom Mixer in consumption more than 3x less energy. The difference in consumption is quite marked also on the streaming phase. Indeed, Twitch (11.6 mAh) dishes Mixer (15.4 mAh) K.O with a lower consumption of 24%. To end this confrontation, we have set up two decisive rounds of observation of the rest phases of each opponent. During the foreground phase, Twitch is still the master of the game, consuming 60% less. For the inactivity phase in the background it is a perfect draw!
The bell rings, end of the match!
The winner
Without any surprise, it’s a knockout victory for the Twitch app, declared victorious against its opponent Mixer on an overall score of 15.3 mAh at 23.9 mAh, either by consuming overall 56% less energy. Note that the Twitch power consumption is still very high. Twitch also dominates its competitor Mixer on memory consumption (-45%) and storage space. Mixer is doing well on data exchanged (-9%).
The measurements were carried out by our laboratory on the basis of a standardized protocol, respecting a specific user scenario (launch of the app, live streaming). The other scenarios are the launch of the application (20”), inactivity in the foreground (20”) and inactivity in the background (20”). This methodology makes it possible to estimate the embedded application complexity and its energy impact during the use phase.
Find the battle of last week : Kapten vs Uber Battles ideas? Contact us!
Today’s match will oppose the two VFH (Vehicle for Hire) leaders of the French market: Kapten (formerly Chauffeur Privé) vs Uber.
In the left corner Kapten, formerly Chauffeur Privé, the French VFH company founded in 2011, quickly established itself as number 2 of the French market. The company renamed Kapten early 2019, wants to conquer more users internationally.
In the right corner Uber, the American giant founded in 2009 of the VFH which has more than 100 million users internationally. Find the battle opposing UberEats vs Deliveroo.
The weighting
At weighing Uber is the heavier application with a weight of 255 MB. Its opponent Kapten is lighter with a weight of 73 MB, or 71% less.
The fight
All the lights are now turned on the fighters and the match can finally begin.
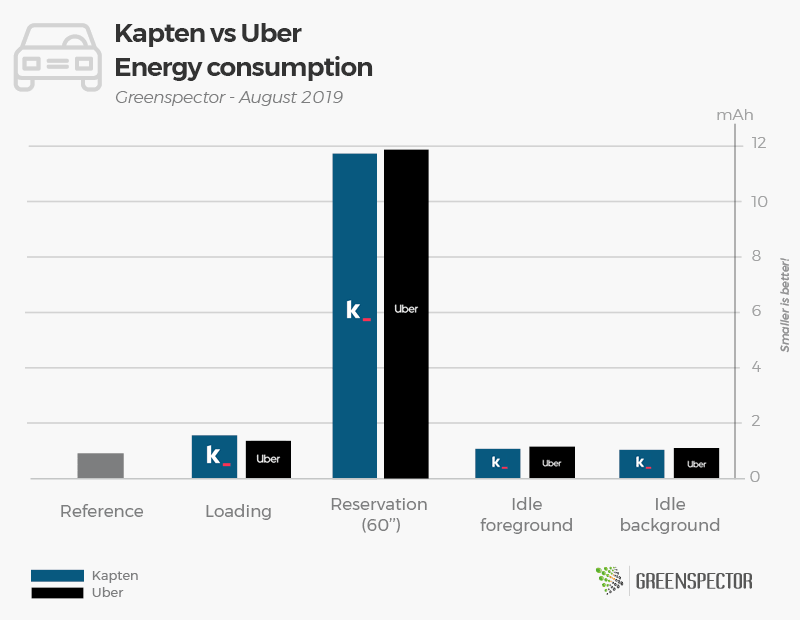
In the first part of the race which consists of measuring the impact of the launch phase of the application, it is Uber which is heading by consuming 10% less than Kapten. On the itinerary and driver research phase, Kapten (11.7 mAh) takes the advantage over Uber (11.8 mAh). To end this confrontation, we have set up two decisive rounds of observation of the rest phases of each opponent. During these periods of inactivity in the foreground and in the background, it is Kapten which is headed with a lower consumption of 7% and 3.7% compared to Uber.
The bell rings, end of the match!
The winner
The race was tight nevertheless it is Kapten which is declared victorious against the American giant Uber on a score very close to 15.4 mAh at 15.5 mAh by consuming globally 1% less energy. Let us note here that these two applications are nevertheless very energy consuming. We can decide between those two apps with the amount of data exchanged because Kapten consumes 21% less than Uber! This is the same finding with the memory consumption, where Kapten is much less consumer (-40%). Finally, if the storage space of your smartphone is precious for you, also prefer the Kapten application.
The measurements were carried out by our laboratory on the basis of a standardized protocol, respecting a specific user scenario (launch of the app, car ordering). The other scenarios are the launch of the application (20”), inactivity in the foreground (20”) and inactivity in the background (20”). This methodology makes it possible to estimate the embedded application complexity and its energy impact during the use phase.
Find the battle of last week : Drivy vs Ouicar Battles ideas? Contact us!
Smartphone navigation apps are our daily tools for car, bike or on-foot navigation. They are regularly used in our business or personal activities. It is also a precious tool for holidays. And it is not uncommon to have two applications installed.
Geolocation activity can be activated on your smartphone but it will cost you an average battery consumption that doubles or even triple depending on the applications and use cases! Pay attention to this parameter for a level of precision that will be in most cases, useless. The particularity of these tools is that they can work in online mode and others only work in offline mode with pre-loading map data before navigation. Even though there are significant differences between these 10 applications for a result of movement and information quite comparable. It’s up to you to choose the most relevant!
For this GPS applications ranking, GREENSPECTOR measured the most used apps on the Google Play Store.
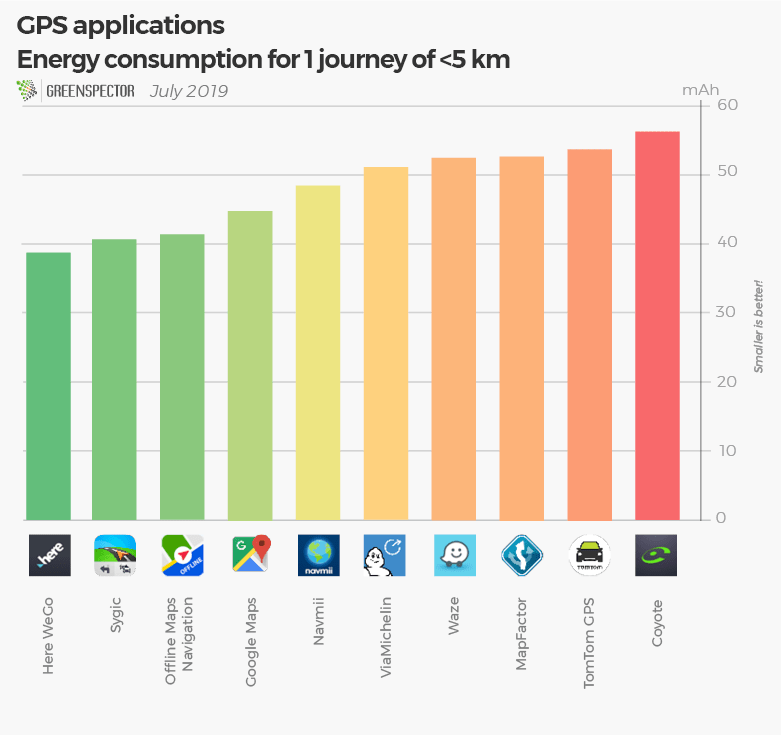
Energy consumption for 1 journey of 3 minutes
Regarding the battery consumption for a simple journey over a period of 3 minutes corresponding to an average simulated movement of 40 km per hour, we observe a very varied consumption between those applications. There is a 45% difference in consumption between Here WeGo and Coyote, both in the online mapping category.
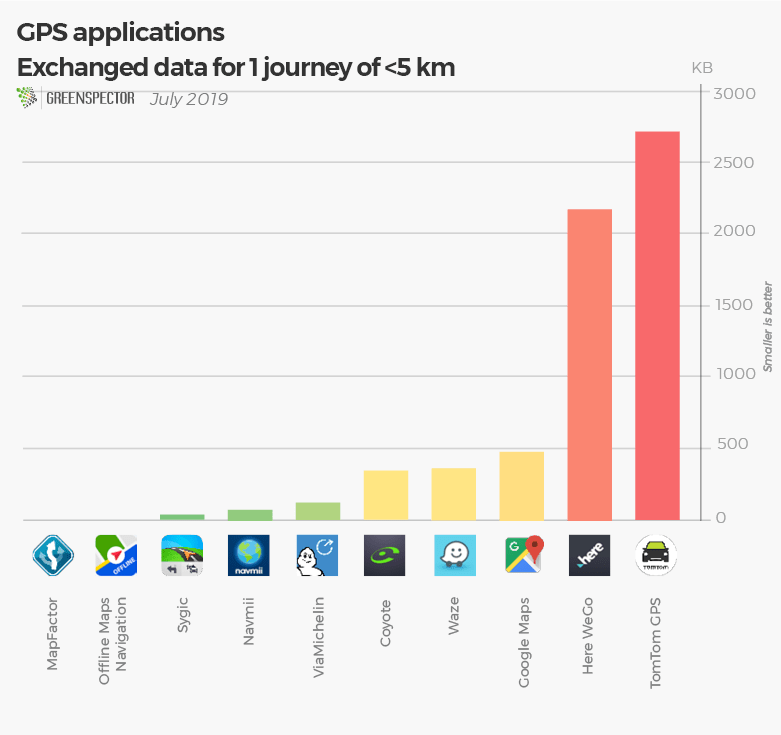
Exchanged data for 1 journey of 3 minutes
In terms of data, Here WeGo and Tomtom GPS are by far the most consuming ones with an exchanged data between 2 and 3 MB. TomTom GPS is both a consuming app in prior mapping (1.3 GB pre-loaded) but also in exchanged data during navigation. ViaMichelin is the least data consuming one for online mapping applications with 113 KB of data consumed.
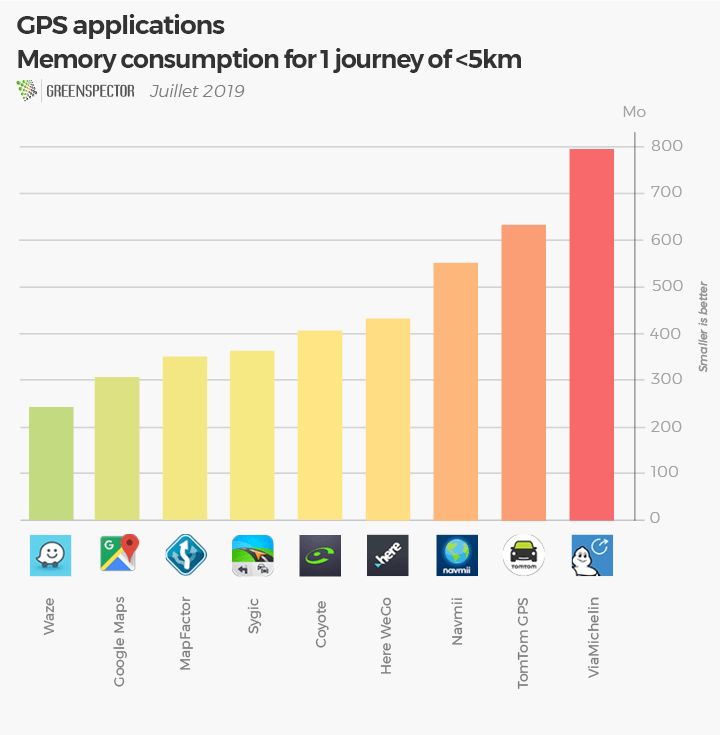
Memory consumption for 1 journey of 3 minutes
There is a 70% difference in memory consumption between Waze and ViaMichelin, to make this journey in a panel where all applications consume between 241 MB and 800 MB. The application Waze, one of the least consuming, will be able to work on older platforms while the ViaMichelin application will be more demanding on the phone’s memory requirements.
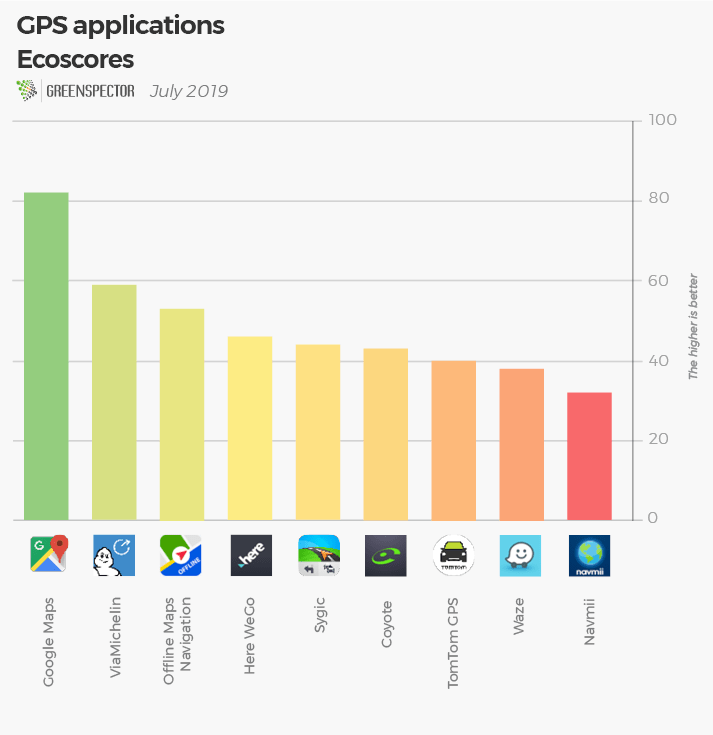
Ecoscore on a standardized journey without movement
The EcoScore reflects the consumption of resources (CPU, memory, data,…) and energy on the first screen of the application. The top 1 award goes to Google Maps, which scores 81 out of 100! In heavy applications in resource consumption and energy TomToom GPS, Waze and Navmii are much more resourceful. MapFactor wasn’t ranked because the application has a different behavior on its first screen compared to the other applications.
Methodology
Application
Version
Downloads
Playstore grade
Offline
Prior download (GB)
Energy consumption (mAh)
Exchanged data (MB)
Memory consumption (MB)
Ecoscore (/100)
Coyote
11.1.920
1 000 000+
3.9
No
0
56.3
0.342
431
43
Google Maps
9.67.1
5 000 000 000+
4.3
No
0
44.8
0.478
304
82
Here WeGo
2.0.13173
10 000 000+
4.4
No
0
38.8
2.2
343
46
MapFactor
5.0.63
10 000 000+
4.5
Yes
1.2
54.6
0
0
N/A
Navmii
3.7.13
10 000 000+
4.0
Yes
2.2
48.5
0.069
550
32
Offline Maps Navigation
17.9.4
10 000 000+
4.7
Yes
France=1.4 Regional= 10-200 Mo
41.5
0
796
53
Sygic
18.1.4
50 000 000+
4.4
Yes
France=2 Regional= 7-250 Mo
40.8
0.035
241
44
TomTom GPS
1.17.7
10 000 000+
4.1
Yes
1.3
55.9
2.75
352
40
ViaMichelin
8.3.3
5 000 000+
4.3
No
51.1
0.113
633
59
Waze
4.52.5.5
100 000 000+
4.6
No
52.5
0.364
404
38
The measurements were made by our laboratory on the basis of a standardized protocol: Smartphone Nexus 6, Android 6, Wi-Fi, low brightness. 4 campaigns were carried out and the value used is the average of these 4 measures.
To carry out these measurements, we measured at the same time a technical course with a phase of loading of the application, a phase of inactivity foreground with displayed app in the foreground and a phase of inactivity with app in the background. This step was done without any movement. Only 9 applications were ranked out of the 10 in ecoscores because one wasn’t comparable with the others on its first screen operation. To measure the movement consumption of these tools, we simulated a movement of less than 5km with a GPS data simulator that allows us to obtain a result very close to a real result.
Today’s match will oppose two carsharing apps: Drivy vs Ouicar. True concept of collaborative economy launched a little over a decade ago, those applications allow car owners to rent their vehicle to individuals or professionals.
In the left corner Drivy, a French car-sharing company founded in 2010. The service is available in 6 European countries and brings together more than 2 million users.
In the right corner Ouicar, application and collaborative platform launched in 2007 by SNCF. It connects car owners with their future tenants and it too, brings together more than 2 million users.
The weighing
At weighing Ouicar is the heavier application with a weight of 65 MB. Its opponent Drivy is much lighter with a weight of 42 MB, or 35% less.
The fight
All the lights are now turned on the fighters and the match can finally begin.
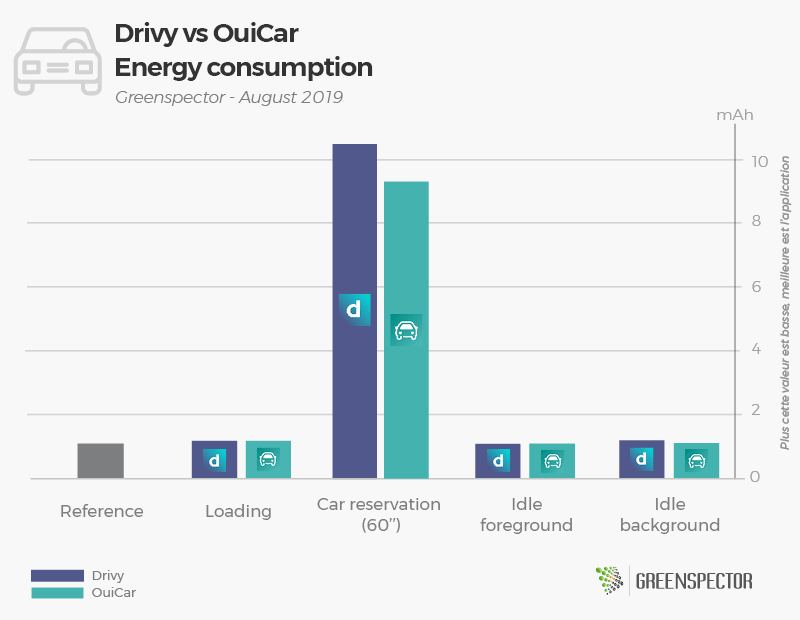
In the first part of the fight which consists of measuring the impact of the launch phase of the application, it’s a draw for the two apps. The second round corresponding to the order of a car is a bit different. Indeed, Ouicar (9.3 mAh) puts Drivy (10.5 mAh) by the side of the road with a consumption lower by almost 11%. To end this confrontation, we have set up two decisive rounds of idle observation for each opponent. During the inactivity phase in the foreground, the two applications are once again at the same speed, however Ouicar go ahead Drivy during the phase of inactivity background, with a lower consumption of 9%.
The bell rings, end of the match!
The winner
The race was tight nevertheless it is Ouicar who is declared victorious against its opponent Drivy on a global score of 12.7 mAh at 14 mAh by consuming overall 9% less energy.
The measurements were carried out by our laboratory on the basis of a standardized protocol, respecting a specific user scenario (launch of the app, car ordering). The other scenarios are the launch of the application (20”), inactivity in the foreground (20”) and inactivity in the background (20”). This methodology makes it possible to estimate the embedded application complexity and its energy impact during the use phase.
Find the battle of last week : Happn vs Tinder Battles ideas? Contact us!
Today’s match will oppose two social and dating apps: Happn vs. Tinder. Based on the same geographical proximity asset, where contact is created after validation of the two people via their profile, the two applications are a real current social phenomenon.
In the left corner, Happn, a French dating application created in 2014. It allows its users to find people they crossed in the day.
In the right corner, Tinder, American giant created in 2012, Happn’s competing application for networking and dating.
The weighing
At weighing Tinder is the heavier application with a weight of 170 MB. Its opponent Happn is much lighter with a weight of 79 MB, or 53% less.
The fight
All the lights are now turned on the fighters and the match can finally begin.
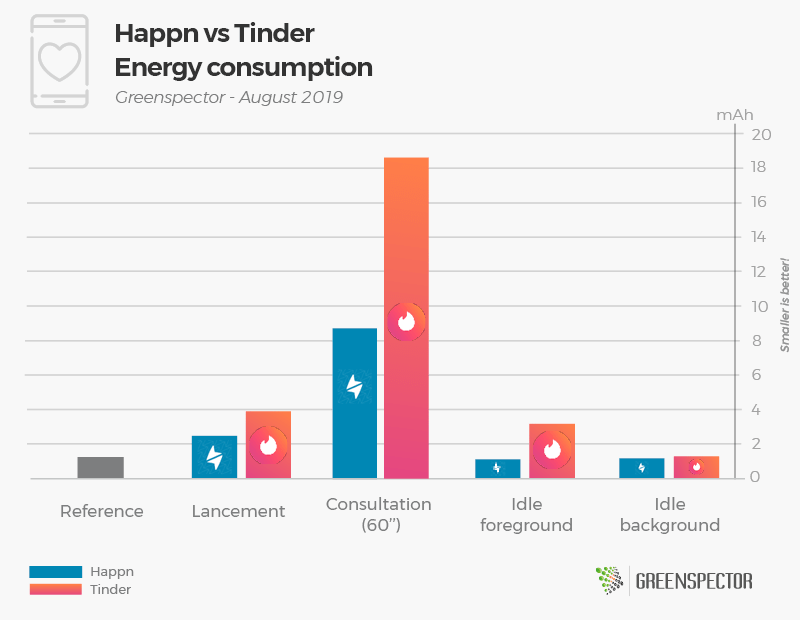
In the first part of the match which consists in measuring the impact of the launch phase of the application, it’s Happn that wins the first round by consumming 35% less than Tinder. The difference in consumption is very marked on the swiping profiles phase. Indeed, Happn (8.7 mAh) puts Tinder (18.6 mAh) K.O with a lower consumption of 53%. To end this confrontation, we have set up two decisive rounds of idle observation for each opponent. During the inactivity phases in foreground and background, Happn still leads with a 65% lower consumption compared to Tinder for this foreground phase and 8% for the background phase.
The bell rings, end of the match!
And the winner is…
Without any surprise, it’s a victory by knockout for Happn app, declared victorious against its opponent Tinder on an overall score of 13.5 mAh at 27 mAh, by consuming 50 % less energy.
The measurements were carried out by our laboratory on the basis of a standardized protocol, respecting a specific user scenario (launch of the app, profiles swiping). The other scenarios are the launch of the application (20”), inactivity in the foreground (20”) and inactivity in the background (20”). This methodology makes it possible to estimate the embedded application complexity and its energy impact during the use phase.
Find the battle of last week : Bankin vs Linxo Battles ideas? Contact us!
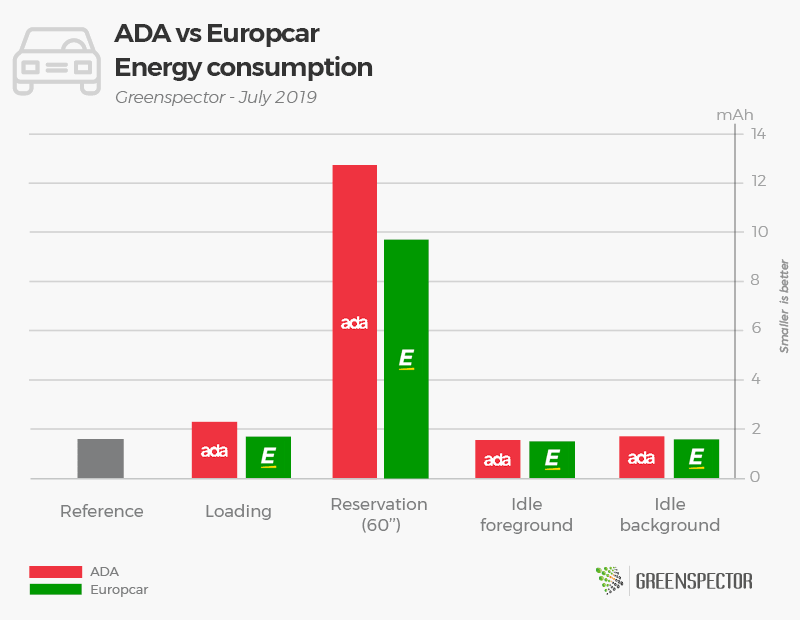
In this period of departure on vacation, we are interested in rental vehicle applications with ADA and Europcar. These two applications make it possible to select and reserve a vehicle for rental for a specified period.
In the left corner ADA, created in 1984, is a French car rental company, a subsidiary of the Rousselet group.
In the right corner Europcar, created in 1949, is also a French company, the European leader in car rental.
The weighing
At weighing ADA is the heavier application with a weight of 94.5 MB. Its opponent Europcar is much lighter with a weight of 55.7 MB, or 41% less.
The fight
All the lights are now turned on the fighters and the match can finally begin.
In the first part of the match which consists in measuring the impact of the launch phase of the application, Europcar takes the advantage, consuming 26% less than ADA. The second part aims to find and choose a rental vehicle by going to the booking phase. Once again, Europcar wins this round by consuming 22.4% less. To end this confrontation, we have set up two decisive rounds of idle observation for each opponent. During the idle background Europcar consumes less than 6%. Finally it is also Europcar who wins the last run by consuming 3% less than ADA on the idle foreground phase.
The bell rings, end of the match! The match went one way with Europcar domination for each round.
The winner is…
Without any surprise, the Europcar application is declared victorious against ADA on a score of 14.5 mAh at 18.3 mAh, by consuming 21% less energy.
The measurements were carried out by our laboratory on the basis of a standardized protocol, respecting a specific user scenario (launch of the app, search for a new car available, selection of a car, reservation during 1 minute). The other scenarios are the launch of the application (20”), inactivity in the foreground (20”) and inactivity in the background (20”).
Find the battle of last week : Deezer vs Spotify Battles ideas? Contact us!
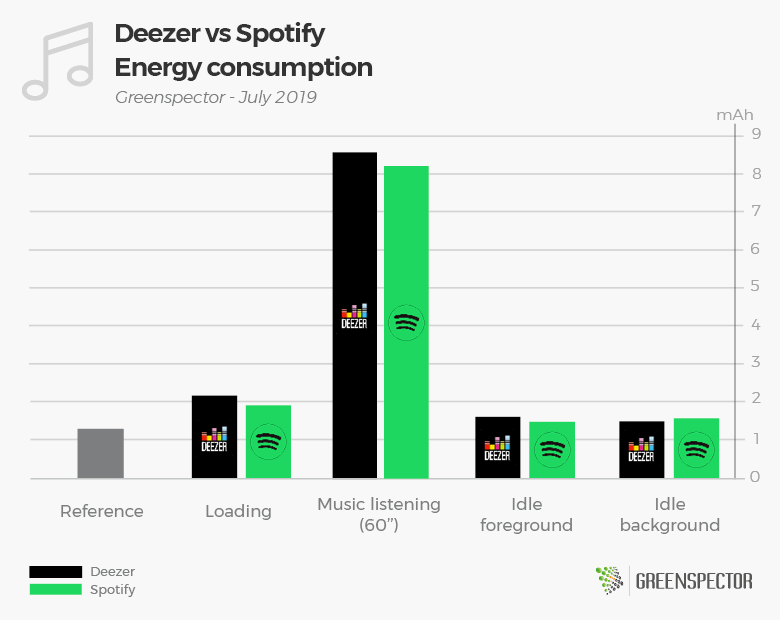
Today we are interested in two streaming music platforms : the pioneer and Swedish leader Spotify and the French Deezer. Audio services have invaded our daily lives and the market share of streaming music is becoming more and more important. While it is sometimes difficult to choose from so many possibilities, we have chosen to study these two actors in order to compare their energy consumption.
In the left corner Deezer, created in 2007, is a french service of streaming music.
In the right corner Spotify, created in 2006, is a swedish service of streaming music, and one of the main competitors of Deezer.
The weighing
At the weighing Spotify is the heaviest application with 115 Mb. It’s opponent Deezer is lighter with 89.5 Mb.
The fight
All the lights are now turned on the fighters and the match can finally begin.
In the first part of the match which consists in measuring the impact of the launch phase of the application, Spotify takes the advantage, consuming 11.6% less than Deezer. The second part aims to search a music in the app and listen to it for a minute. Once again, it is Spotify which dominates its opponent consuming 4.6% less. To end this confrontation, we have set up two decisive rounds of idle observation for each opponent. During the idle background Spotify is consuming 6.25% less, while in the foreground it is Deezer which wins consuming also 6.25% less energy.
The bell rings, end of the match ! Spotify app has been better overall and has won 3 of the 4 rounds of the duel.
The winner
On a unanimous decision, Spotify wins against Deezer on a score of 13.2 mAh to 13.9 mAh, then consuming 5% less energy than its rival.
The measurements were carried out by our laboratory on the basis of a standardized protocol, respecting a specific user scenario (launch of the app, search for a music, select a music, listen for 1 minute). The other scenarios are the launch of the application (20”), inactivity in the foreground (20”) and inactivity in the background (20”).
Find the battle of last week : AirBnb vs Booking Battles ideas? Contact us!
Postal services around the world are changing. Digital has gone through this … the traditional mail business is only 28% for La Poste Group in France. New businesses all based on digital tools are being validated or deployed to take over and allow new levers of growth and profitability for these organizations that have often lived on monopoly situations. All this digital transformation is accompanied by a societal transformation and a consideration of environmental issues.
Where are these companies in this transformation? Few indices or indicators of concrete results of this triple transformation. The website of these organizations is a “visible” symbol of this transformation. The site:
Is it inclusive (People), do you need a lot of resources to navigate and do you put a lot of people in the service?
is he sober (Planet), consumes a lot of energy on a device, a lot of requests on our servers, a lot of data on networks
Is it powerful (Profit)? Is it displayed quickly?
Admittedly, the perimeters of postal activity in the world vary significantly from one country to another in the context of this economic transformation. Admittedly, the proposed benchmark is not exhaustive and does not measure all the pages of the site. It nevertheless allows to get a good idea of the level of maturity of digital eco-design.
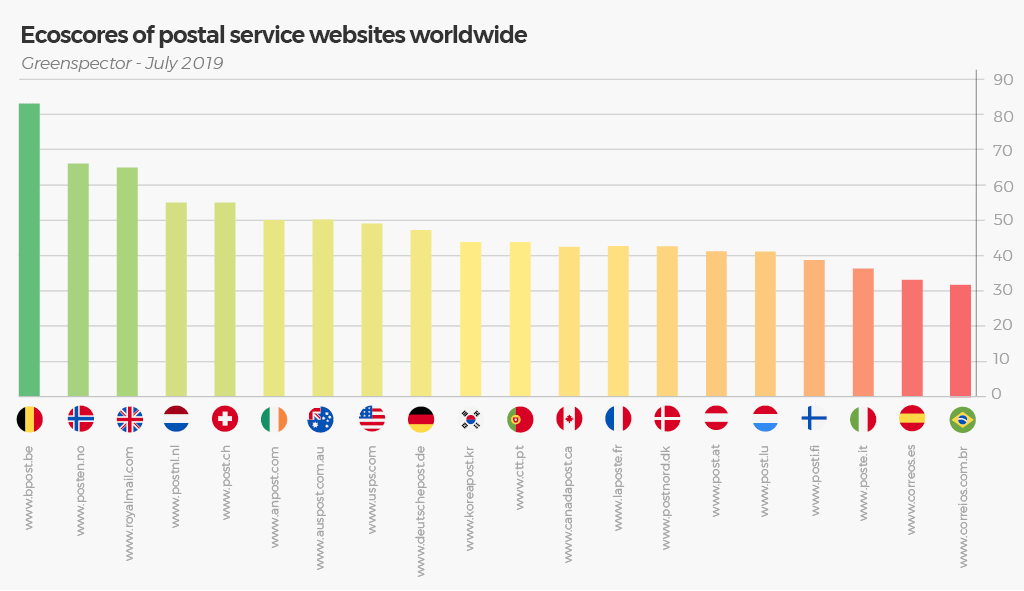
Synthesis of results by Greenspector ECOSCORE
The Ecoscore takes into account the energy consumption, the memory used, the data exchanged, the number of queries and other metrics that contribute to the level of eco-design of a Web to a score of 100 for a website or a page. It is a perfect synthesis of this study and all the indicators presented below that will make it possible to explain the main points of work to analyze and improve.
An excellent result for Belgium, example of sobriety on all the fields and which surpasses all the other countries in our benchmark. Good job for Norway and Great Britain ! To be improved for South Korea, Portugal, Canada, France, Denmark, Austria, Luxembourg and Finland. France in the second third must progress on this topic of digital eco-responsibility. Last rankings for Italy, Spain and Brazil.
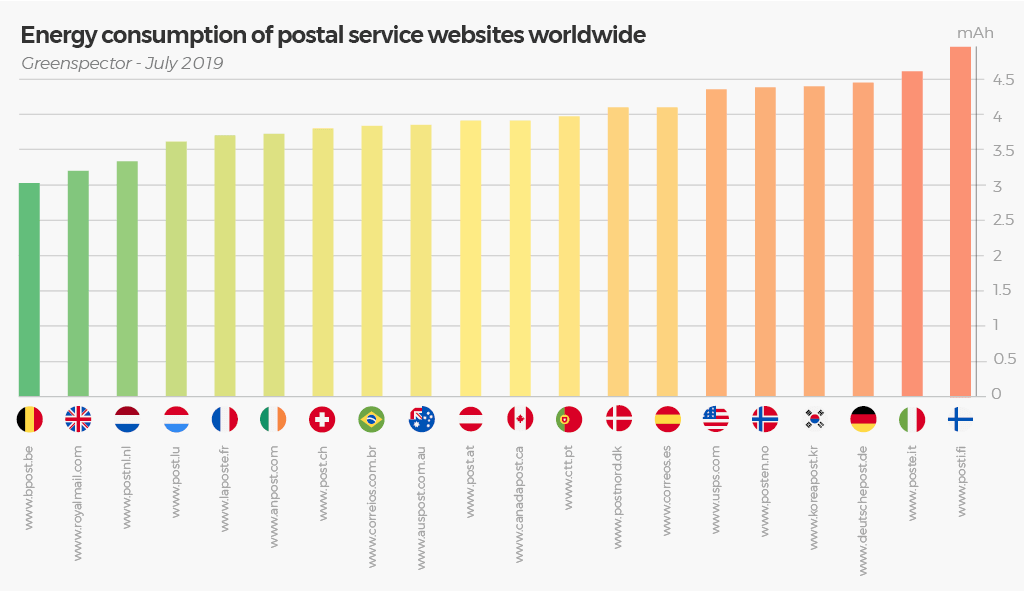
The energy consumption of a website:
This energy consumption will vary between 3 and 5 mAh, or 66% difference on a simple scenario between the Belgian website and the Finnish website. Note that the distribution is rather homogeneous and that the average is about 4 mAh. The French Post is in 5th place with 3.71 mAh.
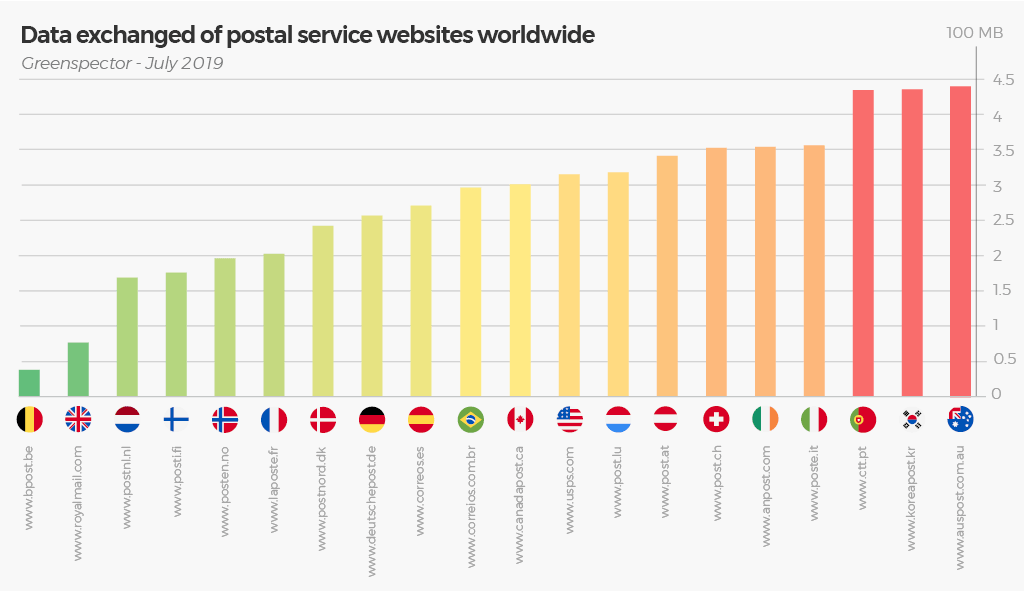
Data exchanged:
The difference is very important between the less and the more “voracious in data”. we can divide by 11 between the Belgian Post Office (0.38 MB) and the Australian Post (over 4.4 MB). The French company ranks 6th.
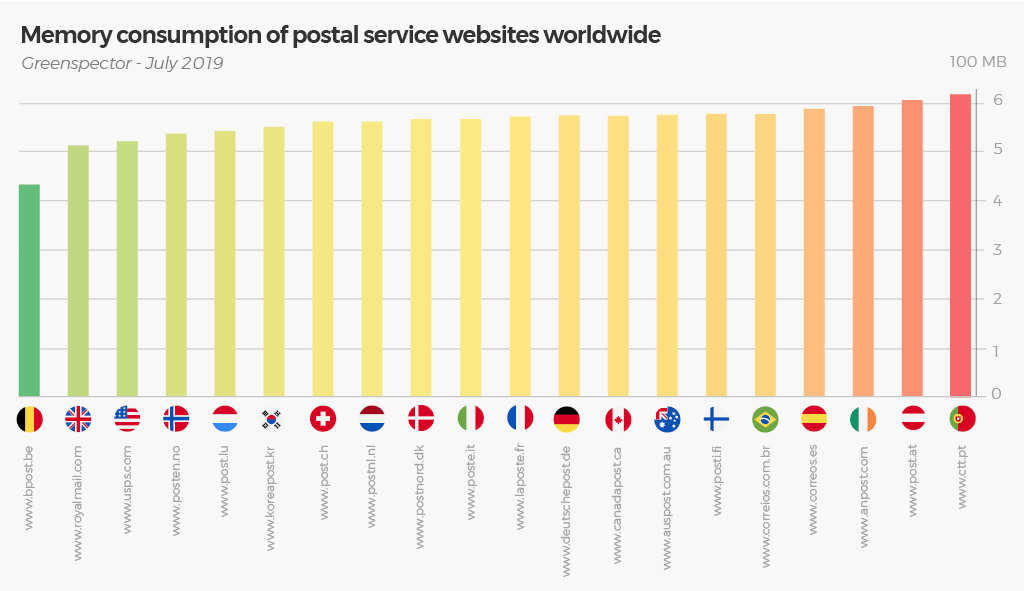
Memory Consumption:
Belgium still has the place of honor in this classification with a consumption very lower than all other websites with a small difference between the best and the last, Portugal (42%) but a gap of 20% between the second and the last. latest. France ranks in 11th position.
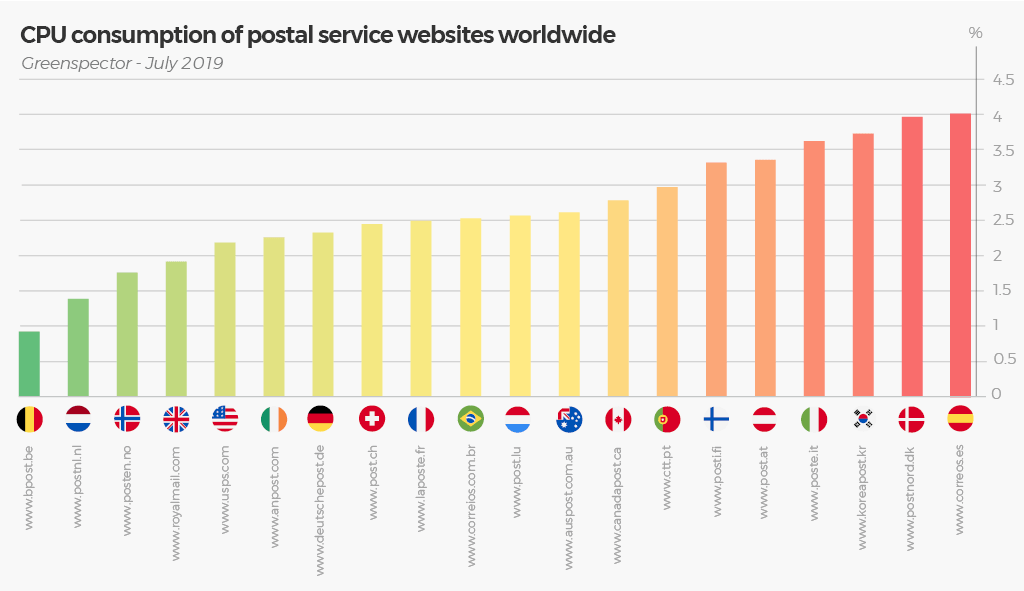
CPU Consumption:
A significant consumption ratio between the first, Belgium and the last Spain (ratio of over 4). France ranks 9th.
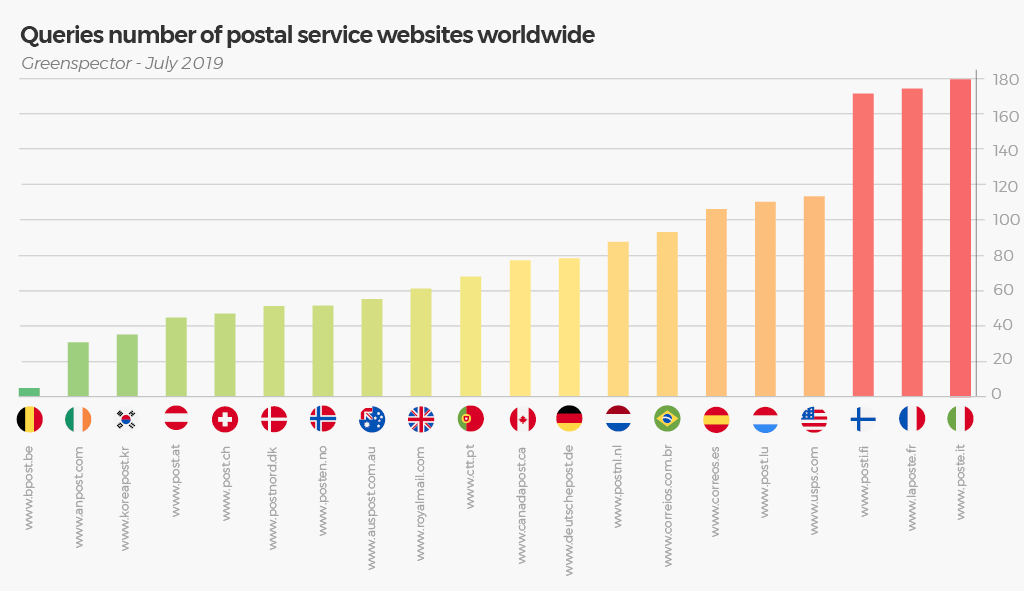
The number of requests sent to the data centers:
An important ratio between the first, Belgium and the last, Italy with a ratio of 36! Many requests for Finland (171), France (174) and Italy (180). France and Finland share the last places with about 10 kb of data averaged per query versus 117 kb on average for Ireland. The number of requests is a factor increasing the consumption on the device of the user but also on the solicitation of the servers. Objective: group queries to limit the consumption.
Table of raw results:
Countries
Websites
Energy consumption (mAh)
Data exchanged (100 MB)
Memory consumption (100 MB)
Number of queries
CPU (%)
Ecoscore (on 100)
Germany
www.deutschepost.de
4,4
2,5
574,4
78
2,3%
47
Austria
www.post.at
3,9
3,4
604,6
45
3,3%
41
Australia
www.auspost.com.au
3,8
4,4
575,5
55
2,6%
50
Belgium
www.bpost.be
3
0,3
433,2
5
0,9%
83
Brazil
www.correios.com.br
3,8
2,9
579,4
93
2,5%
32
Canada
www.canadapost.ca
3,9
3
575,2
78
2,7%
43
South Korea
www.koreapost.kr
4,3
4,3
552,2
35
3,7%
44
Spain
www.correos.es
4,1
2,7
587,6
106
3,9%
33
Danemark
www.postnord.dk
4,1
2,4
567,5
51
3,9%
42
Finland
www.posti.fi
4,9
1,7
578,4
171
3,3%
39
France
www.laposte.fr
3,7
2
572,7
174
2,4%
43
Great Britain
www.royalmail.com
3,2
0,73
514,2
61
1,9%
65
Irland
www.anpost.com
3,7
3,5
594,7
31
2,2%
50
Italy
www.poste.it
4,6
3,5
568,2
180
3,6%
36
Luxembourg
www.post.lu
3,6
3,1
544,0
110
2,5%
41
Norway
www.posten.no
4,3
1,9
537,8
51
1,7%
66
Netherlands
www.postnl.nl
3,3
1,6
562,8
88
1,3%
55
Portugal
www.ctt.pt
3,9
4,3
618,6
68
2,9%
44
Swiss
www.post.ch
3,8
3,5
561,5
47
2,4%
55
USA
www.usps.com
4,3
3,1
522
113
2,1%
49
Average
3,9
2,7
561,2
82
2,6%
47,9
Min
3
0,3
433,2
5
0,9%
32
Max
4,9
4,4
618,6
180
3,9%
83
This test was performed under the following conditions:
Measured the 06/28/2019 on real device Galaxy S7 (Android 8)
Private Wi-Fi network, Chrome browser
Protocol used 1 minute and 10 seconds of test on the homepage: 20 seconds of loading, 20 seconds of idle foreground, 10 seconds of scroll, 20 seconds in idle background.
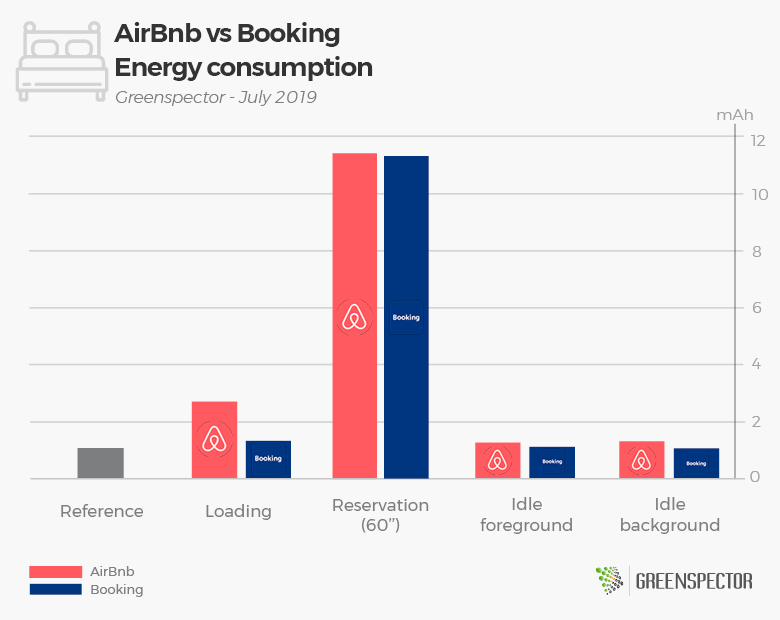
Today’s match will oppose two applications of the travel and local informations category. Indeed, the fighters are AirBnb and Booking.
In the left corner AirBnb, created in 2007, is a community platform for renting and booking accomodations between individuals.
In the right corner Booking, created in 1996, is an online accommodations booking platform.
The weighing
At the weighing AirBnb is the heaviest application with 202 Mb. It’s opponent Booking is almost two times lighter with 104 Mb.
The fight
All the lights are now turned on the fighters and the match can finally begin.
The first part of the match consists in mesuring the launch of the application, and it is Booking which takes an advantage consuming two times less battery than AirBnb. For the second part we search for an accommodation according to different criterias and we start a booking. This time again the winner is Booking, but only slightly, consuming only 1% less than its rival. So far Booking is dominating the fight. The duel ends with two decisive rounds of idle observation. During the idle background and foreground Booking wins once again by consuming 18% and 10% less energy.
The bell rings, end of the match ! Booking seems to be the winner after a very controlled fight.
The winner
On a unanimous decision, Booking is declared winner. The score is 14.9 mAh to 16.7 mAh which represents 12% less energy than AirBnb.
The measurements were carried out by our laboratory on the basis of a standardized protocol, respecting a specific user scenario (launch of the app, looking for an accommodation, choice of an accomodation, booking). The other scenarios are the launch of the application (20”), inactivity in the foreground (20”) and inactivity in the background (20”).
Greenspector may use cookies to improve your experience. We are careful to only collect essential information to better understand your use of our website.
This website uses cookies to improve your experience while you navigate through the website. Out of these, the cookies that are categorized as necessary are stored on your browser as they are essential for the working of basic functionalities of the website. We also use third-party cookies that help us analyze and understand how you use this website. These cookies will be stored in your browser only with your consent. You also have the option to opt-out of these cookies. But opting out of some of these cookies may affect your browsing experience.