Energy consumption of the 30 most popular mobile apps in the world

Reading Time: 3 minutes

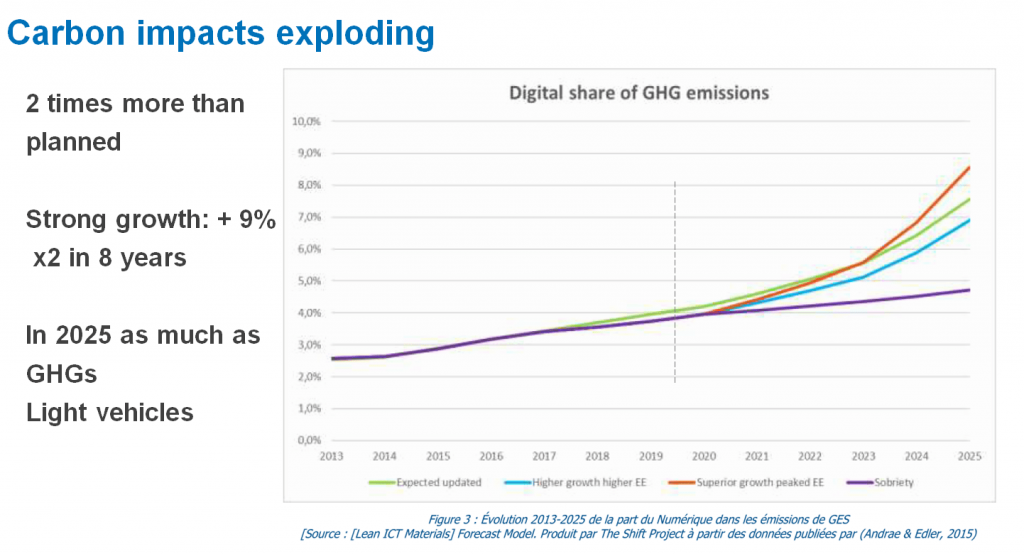
All our digital uses have an impact of energy consumption and in a more global way in technical resources (RAM, CPU, Data, …). The environmental impact of digital is today important and especially in strong progression. Today, according to the project shift * report, the impact of digital in terms of greenhouse gas represents 3.7% of total emissions (GHG) on the planet and could represent, according to the assumptions, between 7 and 8.5% in 2025, the equivalent of the GHG emissions of light vehicles on the planet (8% of GHG). This is reinforced by an annual growth of 8% which remains and will remain sustained despite technological progress.

Access to information, content and services is now predominantly done on smartphones, which has become the flagship of digital activity. We connect more and more, from everywhere, and at any time.
Today, the consumption of smartphones (including the use phase and the manufacturing phase) represents 11% of the digital energy consumption. Sensitive point of this energy consumption for the smartphone that is at the battery and is the focus of all our attention and those of smartphone manufacturers. We often accuse our smartphones of lack and / or loss of autonomy … Yet it is the applications installed on the smartphone that consume! … and which also degrade its battery capacity over time. Mobile applications are now used, for the most deployed, by billions of people (more than 5 billion mobile users). Today, an application like Facebook, the most popular, is used by more than 2 billion active users per month on smartphone. The impact of these applications is therefore considerable and a significant improvement in the sobriety of one of them can have rapidly very positive consequences on the ecological impacts.

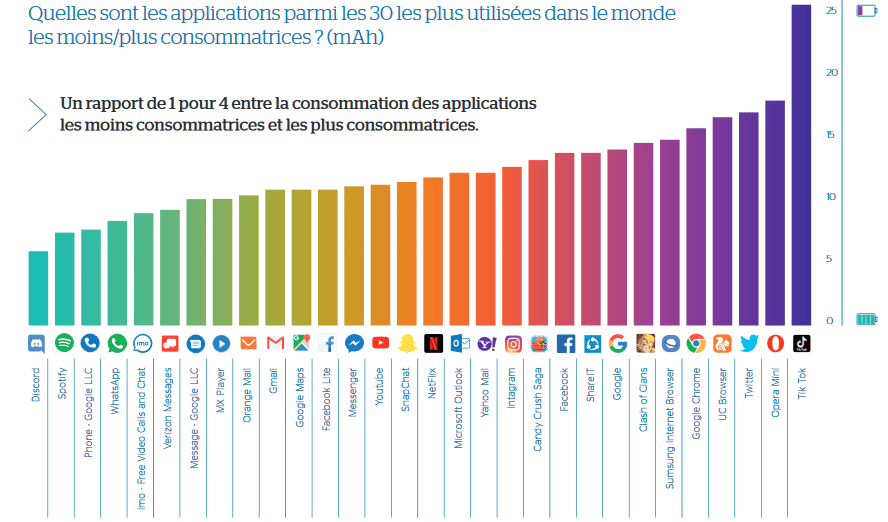
As part of the Vivatech 2019, with our partner ATOS, we wanted to raise the awareness of major digital players by benchmarking the consumption of resources and energy of the 30 most popular applications.

5 key points of this study

  • The pre-loading of the time line data is consumption factor. The fact that this content is video type like TikTok makes it a consumer application for the device but even more so on the network and the datacenter. An ecological heresy when you know that this application is used by millions of people around the world..
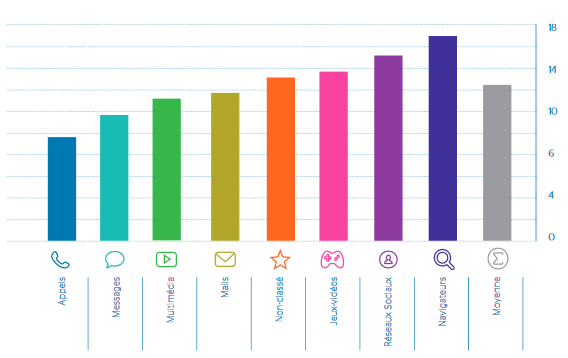
  • Web browsing consumes a lot of energy because the pages include many scripts, more and more (trackers, advertisements, differentiating features, …) that are not well managed by the hardware of the smartphone. Calling consumes half the average on average than surfing.
  • In each category of applications large discrepancies exist for near functionalities which can translate avoidable mess and thus gains of accessible optimizations. 30-40%?
  • Yes, listening to music on Youtube is an ecological “mistake” when you know the consumption of a Spotify. Features “listening music without image” favored on video players are expected.
  • The global electricity consumption of digital is at the scale of a continent (Russia + Japan combined), that of the use of applications on smartphones is that of a European country (equivalent to Ireland). 1/3 of gain conceivable when positioning the average of the category on the lowest consumption of the category (equivalent functionality). On a global scale, a nuclear slice avoided. For our smartphones, 2 to 3 hours of autonomy and more!

The battle of the week: Amazon Prime Video vs Netflix

Reading Time: 2 minutes

Today’s match will oppose two applications of the video services on demand category. Indeed, the fighters are Amazon Prime Video and Netflix.

In the left corner Amazon Prime Video, created in 2006, is the video service on demand created by the giant Amazon, Netflix’s first competitor on the market.

In the right corner Netflix, created in 1997, is today the most used application to watch a serie or a movie on a smarthpone.

The weighing

At the weighing Amazon Prime Video is the heaviest application with 107 Mb. It’s opponent Netflix is clearly lighter with 77 Mb.

The fight

All the lights are now turned on the fighters and the match can finally begin.

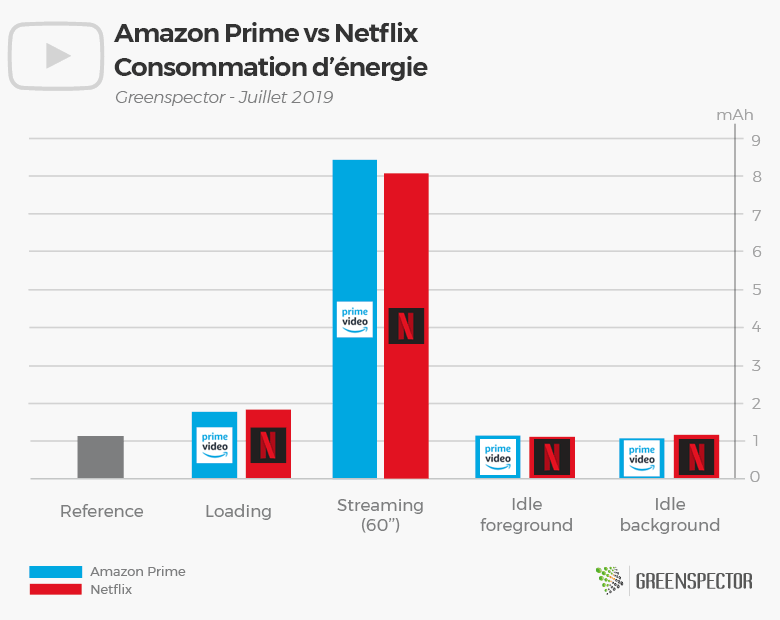
The start of the match is pretty tight but Amazon Prime Video take a small advantage, consuming 0.8% less battery. The fight goes on, with the movie watching scenario during a minute, and this time Netflix reacts and overturn the situation consuming 4.3% less than Amazon Prime Video. For now the suspens is still here since none of the competitors seems to be really better than the other. The fight ends with two decisive rounds of idle observation. During the idle background, Amazon Prime vidéo dominates its opponent consuming 8% less energy. However, during the idle foreground, Netflix consumes 3.5% less.

The bell rings, end of the match ! The fighters having both won 2 rounds, the final decision will be a points decision.

The winner

After counting the points and despite an extremely tight score it is Netflix which is declared winner by the judges, 12.1 mAh to 12.4 mAh.

For those who like numers

ApplicationVersionDownloadsPlaystore GradeApp weight (MB)Exchanged data (MB)Memory (MB)Energy consumption (mAh)
Amazon Prime Video3.0.253.182041100 000 000+4.310773.9414.612.4
Netflix7.16.1500 000 000+4.577192.1286.712.1

Netflix app is consuming two times more than an app as Discord. Their consumption is almost equal to Microsoft outlook or Yahoo Mail. (Source: Study Consumption of top 30 most popular mobile applications)

The measurements were carried out by our laboratory on the basis of a standardized protocol, respecting a specific user scenario (launch of the app, looking for a movie, watching the movie). The other scenarios are the launch of the application (20”), inactivity in the foreground (20”) and inactivity in the background (20”).

Find the battle of last week : Amazon vs Cdiscount)
Battles ideas? Contact us!

The battle of the week: Bankin vs Linxo

Reading Time: 3 minutes

We are interested this week in budget management applications: Bankin et Linxo. Created by startups and the real new success of fintechs, budget management applications are recent in the banking market. Based on a system of accounts aggregation, they simplify the banking plurality of consumers by displaying on the same screen the accounts held in different institutions. They also allow users to manage their finances and budget by categorizing expenses. They also alert if necessary using forecasting statistics.

In the left corner Bankin, created in 2011 and with more than 3.2 million users, Bankin is proud to be the only independent bank player in Europe.

In the right corner Linxo, Bankin’s main competitor, it was created in 2010 and has more than 2.8 million users.

The weighing

At weighing Linxo is the heavier application with a weight of 70 MB. Its opponent Bankin is much lighter with a weight of 65 MB, or 7% less.

The fight

All the lights are now turned on the fighters and the match can finally begin.

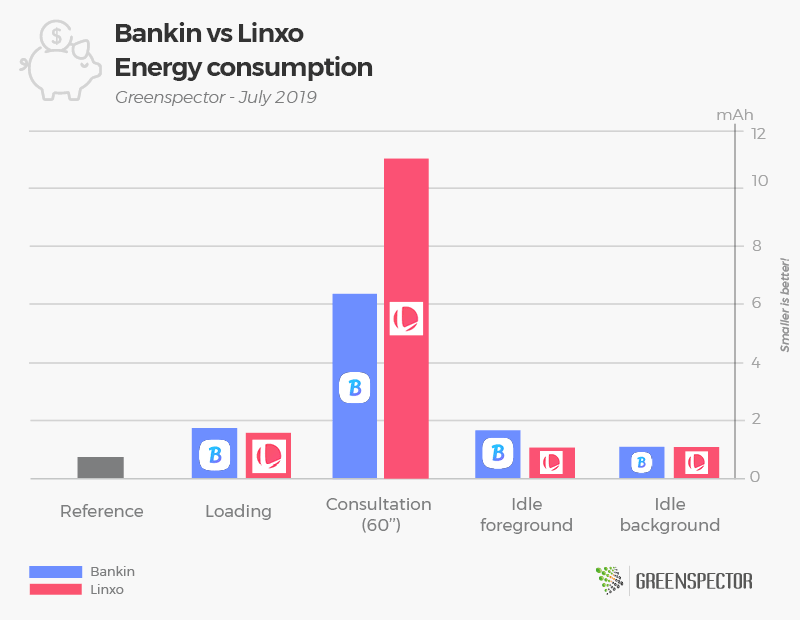
In the first part of the match which consists in measuring the impact of the launch phase of the application, Linxo takes the advantage, consuming 13% less than Bankin. The difference in consumption is very important on the accounts’ consultation phase. Indeed, it is Bankin (6.4 mAh) which takes the advantage and put Linxo (11 mAh) K.O with a lower consumption of 41%. To end this confrontation, we have set up two decisive rounds of idle observation for each opponent. During the inactivity phase in the background, it is a perfect match, both opponents consume 1.1 mAh. It’s Linxo who wins the last round by consuming 49% less than Bankin on the inactivity phase in the foreground.

The bell rings, end of the match!

And the winner is…

After a hard fight, the Bankin application is declared victorious against its opponent Linxo on an overall score of 10.8 mAh at 14.7 mAh by consuming 26% less energy.

For those who like numbers

ApplicationVersionDownloadsPlaystore GradeApp weight (MB)Exchanged data (KB)Memory (MB)Energy consumption (mAh)
Bankin3.12.41 000 000+4.565136160.510.8
Linxo6.6.1500 000+4.470296.3121.114.7

On a scenario of consultation during 1 minute, Bankin consume 8% more than an application like Discord. Linxo‘s energy consumption is equal to Snapchatone’s. (Source: Study Consumption of top 30 most popular mobile applications)

The measurements were carried out by our laboratory on the basis of a standardized protocol, respecting a specific user scenario (launch of the app, consultation of the lastest banking operations). The other scenarios are the launch of the application (20”), inactivity in the foreground (20”) and inactivity in the background (20”).

Find the battle of last week : ADA vs Europcar
Battles ideas? Contact us!

2019 Mobile video games ranking : 12 apps measured

Reading Time: 3 minutes

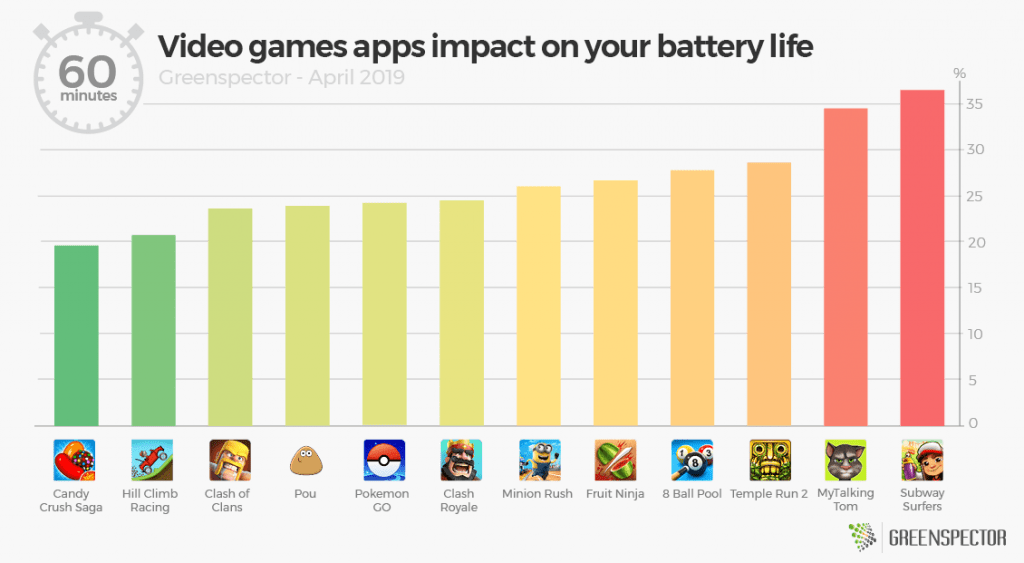
The 2018 year was a record year for the mobile application market, with more than 113 billion downloads worldwide, up 10% from 2017. These are video sharing and “casual games” applications which have been the most downloaded (Source: AppAnnie). If the carbon footprint of storage servers increases and has a strong impact on the environment, mobile applications are also becoming more and more energy intensive because they are demanding technical resources (RAM, CPU, Data, etc.). GREENSPECTOR has measured the energy consumption of mobile casual games apps. At the top of this ranking, Candy Crush Saga is the most energy efficient one.

Digital power consumption is up 9% a year, according to the Digital Environmental Impact Report released Oct. 4 by The Shift Project , think tank of the carbon transition. The share of digital in global greenhouse gas emissions has increased from 2, 5% in 2013 to 3.7% in 2018, representing an increase of 450 million tonnes in the OECD. These are the data centers that host softs and data, but also the use of terminals and networks. “The energy impact of watching video is about 1,500 times greater than the simple power consumption of the smartphone itself, the report.

In the study conducted in partnership with Atos, on the top 30 most energy-consuming applications, we have also identified that video game applications are among the most demanding applications, after those of social networks and browsers. This consumption has a significant impact on the battery life and therefore on the user experience: the drop in the battery level affects the remaining playing time before recharging.

Results

  • Subway Surfers, last in the ranking, consumes almost twice as much as Candy Crush Saga;
  • if Candy Crush Saga was running continuously on a smartphone for 60 minutes, the app would consume 19% battery, against nearly 40% for Subway Surfers.

The high energy and resource consumption of some applications can be explained by:

  • 3D games such as : Temple Run 2, My Talking Tom or Subway Surfers tend to be more consumer than 2D games like Candy Crush Saga, Hill Climb Racing or Pou;
  • some applications include unwanted ads that disrupt the user experience and increase energy consumption, aurtres offer to visualize advertising videos to win rewards in the game.

If we compare the energy consumption of these mobile video game applications to a heavier platform game (like Rayman Adventures for example, developed by Ubisoft), this one would be in the average consumption: it would only consume 24% battery and the average is 26%. Only the storage capacity of the device (weight of the installed application) would be more impacted.

For those who like numbers

ApplicationVersionDownloadsPlaystore GradeApp weight (MB)Exchanged data (KB)Memory (MB)In game Energy consumption (mAh)
8 Ball Pool4.3.1100 000 000+4.51650.77189.416.3
Candy Crush Saga1.147.0.2500 000 000+4.51320.22254.812.2
Clash of Clans11.446.11500 000 000+4.61350.8488.814.3
Clash Royale2.6.1100 000 000+4.51280.126261.914.9
Fruit Ninja2.7.2.504834100 000 000+4.31406.03294.414.8
Hill Climb Racing1.41.0500 000 000+4.41078.59211.111.7
Minion Rush6.4.1100 000 000+4.52101.51182.118.2
MyTalkingTom5.2.3.326500 000 000+4.51882.0345020.7
Pokemon Go0.137.2100 000 000+4.12180.27145015.4
Pou1.4.77500 000 000+4.3430.83139.813.9
Temple Run 21.55.3500 000 000+4.112016.65280.516.3
Subway Surfers1.100.01 000 000 000+4.516535.75320.923
Rayman Adventures3.9.010 000 000+4.65241.34326.615.5

The measurements were carried out by our laboratory on the basis of a standardized protocol, respecting a specific user scenario (launch of the app, launch of the game). The other scenarios are the launch of the application (20”), inactivity in the foreground (20”) and inactivity in the background (20”). This methodology makes it possible to estimate the embedded application complexity and its energy impact during the use phase.

Note: Find our other comparative applications articles:

The Top 10 myths of frugal ICT

Reading Time: 5 minutes

I have been working for more than 8 years in GreenIT and I have seen lately that several studies and initiatives have started. This is a very positive sign and shows that there is a real dynamic to change the impact of ICT. All actions, whether small scale, as a simple awareness, or on a larger scale such as the optimization of a website with millions of visitors, is good to take into account the climate emergency.

However it’s important to avoid any greenwashing phenomenon and to understand the impact of the good practices mentioned (are they really all green?)

Myth 1 – A powerful software is a simple software.

False

A powerful software is a software that will be displayed quickly. This gives no information on its sobriety. On the contrary, it’s possible that practices are put in place for a quick display and that they go against the sobriety. As for example put the loading of the scripts after the display of the page. The page will be displayed quickly but many processes will run in the background and will have an impact on resource consumption.

Myth 2 – Optimize the size of queries and the weight of the page, this makes the software more frugal.

True and false

True because actually fewer resources will be used on the network and servers. Which means less environmental impact. It goes in the right direction.

False because the evaluation of a simple software will not only be based on this type of technical metrics. Indeed, it is possible that certain elements have an equally important impact. A carousel on a home page could for example be quite light in terms of weight and requests (for an optimized carousel) but in any case will have a strong impact in user-side resource consumption (CPU consumption, graphics … ).

Myth 3 – Automatic control via tools allows me to be green

True and false

True because it is important to measure the elements. This will allow to know objectively where we are, and to improve.

False because the evaluation will be done on technical elements. There is a bias: we only measure what we can automate. This is the criticism that can be made for example on Lighthouse (accessible tool in Chrome) on the accessibility. We can make a totally inaccessible site by having a score of 100. This is the same criticism that we can have about the tools that are used in ecodesign. For example the website http://www.ecoindex.fr/ is an interesting tool to initiate the process, however the calculation of this tool is based on 3 technical elements: the size of the page, the number of request and the size DOM. These are important elements in the impact of the page, however several other elements can be impacting: CPU processing from script, graphic processing, more or less good solicitation of the radio cell … All elements that can create false positives.

A measurement software will be complementary 😉

Myth 4 – My software uses open-source and free code, so I’m green

False

Free software is a software in its own right. He suffers the same obesity as other software. He will therefore potentially be a consumer. On the other hand, free software has a stronger capacity to integrate good efficiency practices. Still need to implement or at least begin to evaluate the impact of its solution …

Myth 5 – The impact is more on the datacenter, on the features, on that …

True and false

Any software is different, by its architecture, its use, its implementation, its functions … no serious study can certify a generality on a domain that would have more impact than another. In some cases, the impact will be more on the datacenter (for example on calculation software) but in other cases it will be on the user side (for example mobile applications). In the same way, some software will be obese because of their multiple functionalities whereas others will be because of a bad coding or an external library too heavy.

Myth 6 – Ecodesign requires a structured and holistic approach

True and false

True because indeed it’s necessary to involve all the actors of the companies (developer but also Product Owner, Business Department) and to have a coherent strategy.

However, starting process and product improvement through unit and isolated actions is very positive. The heaviness of the software is indeed in a state where any isolated positive action is good to take.

Both approaches are complementary. Avoiding the application of certain practices while waiting for a structured approach (which can be cumbersome) would be dangerous for the optimization and competitiveness of your software.

Myth 7 – The green coding does not exist, the optimization is premature …

False

This is an argument that has existed since the dawn of time (software). Code implemented, legacy code, libraries … optimization tracks are numerous. My various audits and team accompaniments showed me that optimization is possible and the gains are significant. To believe otherwise would be a mistake. And beyond optimization, learning to code more green is a learning approach that is useful to all developers.

Myth 8 – My organization is certified green (ISO, ICT responsible, Lucie …), so my product is green.

False

All its certifications will effectively ensure that you are on the right track to produce more respectful software. Far be it from me to say that they aren’t useful. However, it must not be forgotten that these are organization-oriented certifications. In a structured industry (like agriculture, a factory …) the company’s deliverables are very aligned to the process. Certifying an AB farm will ensure that the product is AB good.

However in the mode of the software it is not so simple, the quality of the deliverables is indeed very fluctuating, even if one sets up a process of control. In addition, an organization potentially consists of a multitude of teams that are not going to have the same practices.

It’s therefore necessary to control the qualities of software products and this continuously. This is an approach that will be complementary to the certification but mandatory. Otherwise we risk discrediting the label (see going to greenwashing).

Myth 9 – Optimizing energy is useless, it’s the equivalent CO2 that is important to treat

False

The ecodesign work is mainly based on the reduction of equivalent CO2 (as well as other indicators such as eutrophication …) over the entire life cycle of the ICT service. It’s therefore important to take into account this metric. Without this, we risk missing the impacts of IT. However, on the same idea as points 5 to 7, no optimization is to be discarded. Indeed, it is necessary to understand where the impacts of the software are located. However, the integration of the energy problem in teams is urgent. Indeed, in some cases the consumption of energy in the use phase is only part of the impact (compared to gray energy for example). However in many cases, high energy consumption is a symptom of obesity. In addition, in the case of software running in mobility (mobile application, IoT) energy consumption will have a direct impact on the renewal of the devices (via the wear of the battery).

Myth 10 – I compensate so I’m green

False

It’s possible to offset its impact through different programs (financing of an alternative energy source, reforestation …). It’s a very good action. However, it is a complementary action to an ecodesign process. It is indeed important to sequence the actions: I optimize what I can and I compensate what remains.

Conclusion

The frugal ICT is simple because it’s common sense. However, given the diversity of the software world, the findings and good practices aren’t so simple. However, the good news is that, given the general cumbersome software and the delay in optimization, any action that will be taken will be positive. So don’t worry, start the process, it’s just necessary to be aware of some pitfalls. Be critical, evaluate yourself, measure your software!
SNCF vs Trainline

Reading Time: 2 minutes

Today we attend a match in a new category: Train ticket booking applications. The duel is opposing the OuiSNCF app to the Trainline app.

In the left corner OuiSNCF (formerly known as voyages-sncf.com), created in 2000, is the SNCF distributor and an online travel agency.

In the right corner Trainline (Formerly known as Captain Train) which was created in 2009. It is a travel agency and a trade intermediary dedicated to the online sale of train and bus tickets in Europe.

The weighing

At the weighing OuiSNCF is the heaviest app with 54.2 Mb. With 41.9 Mb TrainLine is 1.3 times lighter than his opponent and appears as the lightweight of the fight.

The fight

All the lights are now turned on the fighters and the match can finally begin.

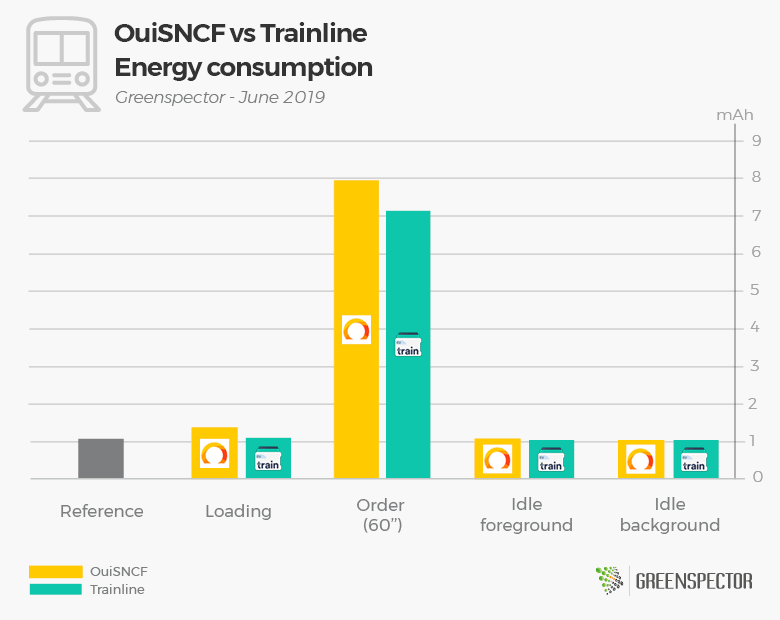
In the first seconds of the fight TrainLine put some pressure on his opponent with a loading phase consuming 20% less battery. The fight goes on with the train ticket purchase scenario, and one more time TrainLine is consuming 10% less than OuiSNCF which completely derails and is now in the ropes. The match ends with two rounds of idle observation for each opponent in which OuiSNCF will fight equaly with TrainLine.

The gong sounds, the match is over! With an unanimous decision from the judges TrainLine is declared the winner of this fight.

The winner

For this second battle, the two opponents fought well but TrainLine wins 10.35 mAh to 11.48 mAh against OuiSNCF, consuming overall almost 10% less energy.

For those who love numbers

ApplicationVersionDownloadsPlaystore GradeApp weight (MB)Exchanged data (MB)Memory (MB)Energy consumption (mAh)
OuiSNCF61.045 000 000+4.254.21278.0211.48
TrainLine481 000 000+4.441.90.11150.3310.35

OuiSncf app is consuming two times more than an app such as Discord. Their consumption is equal to Snapchat or Orange Mail. (Source: Study Consumption of top 30 most popular mobile applications)

The measurements were carried out by our laboratory on the basis of a standardized protocol, respecting a specific user scenario (launch of the app, selection of a destination, scroll on the results page, choice of a ticket, scroll on the ticket options page, add to the cart). The other scenarios are the launch of the application (20”), inactivity in the foreground (20”) and inactivity in the background (20”).

Find the battle of last week : UberEats vs Deliveroo
Battles ideas? Contact us!

The fight of the week: Amazon vs Cdiscount

Reading Time: 2 minutes

The battle of the week opposes this time two m-commerce applications. Indeed, it is a duel between the french app Cdiscount and the american app Amazon.

In the left corner Amazon, created in 1994, is an american company, e-commerce world leader.

In the right corner Cdiscount, created in 1998, is a french company, main Amazon challenger in France.

The weighing

At the weighing Amazon is the heaviest app with 156 Mb. With 117 Mb Cdiscount is 1.3 times lighter.

The fight

All the lights are now turned on the fighters and the match can finally begin.

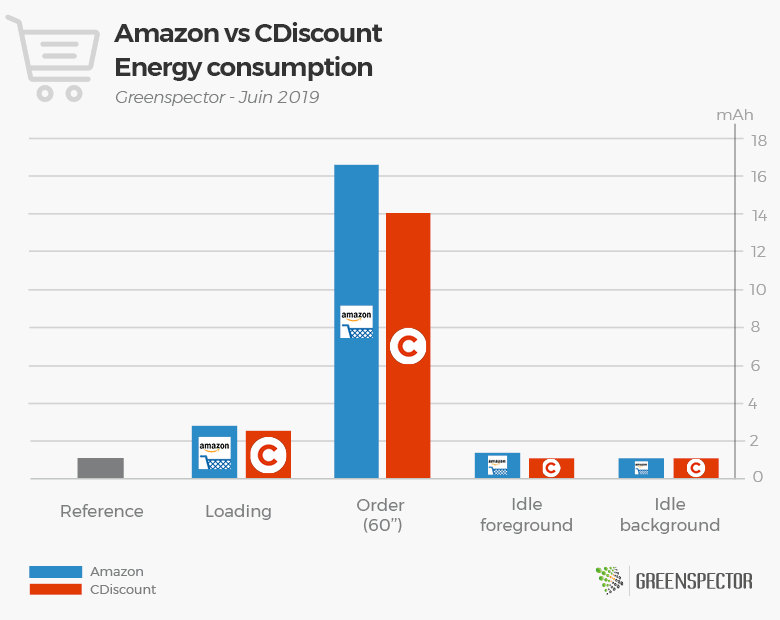
Early in the match Cdiscount shows that it did not come to fill the blanks, with a loading phase consuming 9% less energy. The fight goes on, with a buying item scenario, and one more time Cdiscount is consuming 16% less than it’s opponent. It’s a big blow for the american which is hurt but doesn’t admit to be defeated yet. The match ends with two rounds of idle observation for each opponent in which Cdiscount give the final blow to Amazon consuming each time less energy… KO!

The bell rings, the match is over ! With no surprise, Cdiscount is declared winner of this fight.

The winner

For this third battle, we attended to a fight dominated from the begining to the end by Cdiscount who wins 19.8 mAh to 23 mAh against Amazon, by consuming almost 14% less energy overall.

For those who like Numbers

ApplicationVersionDownloadsPlaystore GradeApp weight (MB)Exchanged data (MB)Memory (MB)Energy consumption (mAh)
Amazon61.04100 000 000+4.315615.57334.4923.06
Cdiscount485 000 000+4.11172.12522.3019.84

Amazon app is consuming 3 times more than an app as Spotify. Their consumption is almost equal to Opera Mini or Tik Tok. (Source: Study Consumption of top 30 most popular mobile applications)

The measurements were carried out by our laboratory on the basis of a standardized protocol, respecting a specific user scenario (launch of the app, looking for of an item, scroll on the results page, selection of an item, add to the cart). The other scenarios are the launch of the application (20”), inactivity in the foreground (20”) and inactivity in the background (20”).

Find the battle of last week : OuiSncf vs Trainline
Battles ideas? Contact us!

Fight of the week: UberEats vs Deliveroo

Reading Time: 3 minutes

Today we will study food delivery applications. These applications have multiplied in the last three years. In France, two leaders share the majority of the market:UberEats and Deliveroo. We decided to compare these two challengers to confront them on the following criteria: their energy consumption, their amount of exchanged data as well as their busy memory.

Deliveroo is a British company, created in 2013 and the main competitor of UberEats in France, covering more than 45 French cities.

UberEats was designed by the creators of Uber in August 2014 and is available in several countries of the world, and in more than 70 cities in France and this 24/24.

These two applications allow you to order and receive meals delivered from restaurants near you.

Weighing

From the point of view of the app weight, Deliveroo is the featherweight. Indeed, its weight (22 MB) is 1.4 times lower than that of UberEats (31 MB).

Match

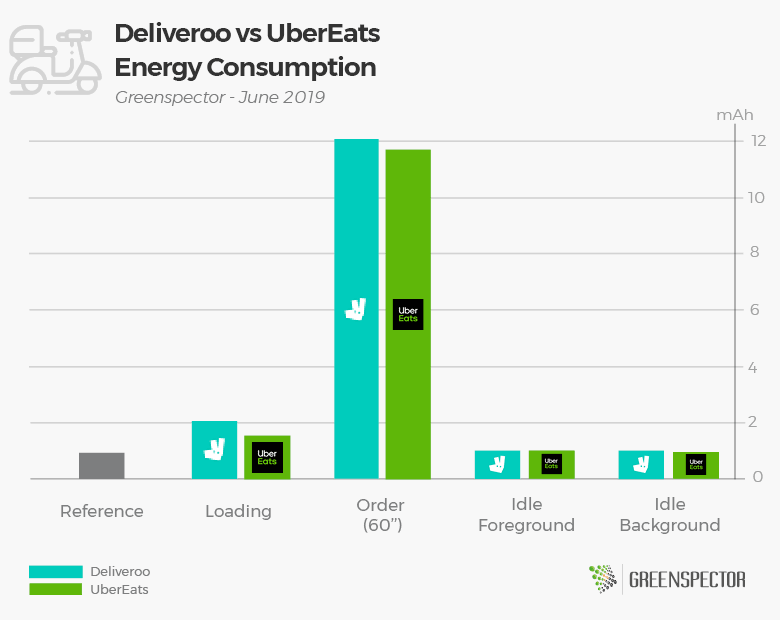
From the beginning of the match, UberEats takes a clear advantage over his opponent with a launch that consumes 13% less battery. He manages to maintain his advantage during the decisive phase of this match, which consists of ordering a meal (-2.5%). The confrontation ends with two rounds of observation of the rest phases of each opponent, during which the two competitors are tied.

Over the whole match, UberEats wins on the points against Deliveroo that resists well.

Note that we are dealing here with two “heavyweights” who will both mark your battery their footprint!

And the winner is…

For this very first fight, the match is tight but UberEats wins 15.7 mAh at 16.2 mAh in front of Deliveroo, consuming nearly 3.5% less energy.
Note however that the Deliveroo app is lighter to download and consumes less data – so if you have a small data package or unstable connection, it can be interesting.

These two applications can be compared on a one-minute scenario to the energy consumption of a Netflix, they are also 1.6 times more consuming than an application such as Spotify. (Source: Study Consumption of top 30 most popular mobile applications)

For those who like numbers

ApplicationVersionDownloadsPlaystore GradeApp weight (MB)Exchanged data (MB)Memory (MB)Energy consumption (mAh)
Deliveroo3.4.15 000 000+4.2223.35218.8512.02
UberEats1.201.1000250 000 000+4.2313.66227.7411.72

The measurements were carried out by our laboratory on the basis of a standardized protocol, respecting a specific user scenario (launch of the application, selection of a delivery address, scroll on the pages of choice of restaurants and selection of a restaurant, scroll on the page of the dishes and add in the basket). The other scenarios are the launch of the application (20”), inactivity in the foreground (20”) and inactivity in the background (20”).