Digital Sobriety Requirements for Cities and Communities – Ranking

Reading Time: 7 minutes

In 2020, we published a study on digital sobriety requirements in public procurement. With the publication this summer of the decree n° 2022-1084 of July 29, 2022, we thought it would be a good idea to take stock of the sites of cities and communities.  
This decree concerns municipalities and communities of more than 50,000 inhabitants, requiring them to develop a responsible digital strategy focusing in particular on reducing the environmental footprint of digital.  
We therefore remeasured the sites of the 29 cities and 17 metropolises already discussed in order to compare the results obtained.
The measurements here only concern the first page of each site. Ideally, a larger sample of pages should be taken into account, or even compared on the basis of a user path common to all these sites. However, this approach already allows us to establish points of comparison and to identify some good practices. 

Metropolitan sites

The Ecoscore as defined by Greenspector allows a good overview of each site. We will therefore start by looking at its evolution between the initial measurements and the re-measurements.

metropolises website ecoscore

In most cases, there is an improvement (even slight) in the EcoScore. The cities of Brest, Grenoble, Nice, Orleans and Strasbourg stand out with a very strong increase. For some cities, the trend is downward.  

While Nancy had the best EcoScore (74), Rennes takes the lead with an EcoScore of 80. 
However, it can be estimated that it would be important for each city to obtain an EcoScore of at least 50/100, which is still not the case for some.  

Estimating the environmental impacts of different sites is another good basis for comparison.

metropolises website carbon impact

We note here that the trend is globally upward for the measured sites with sometimes a strong difference between the initial measurement and the remeasurement. The case of the Saint-Etienne metropolis illustrates this very well.

Further analysis of selected sites

Rennes metropolises website
Métropole de Rennes

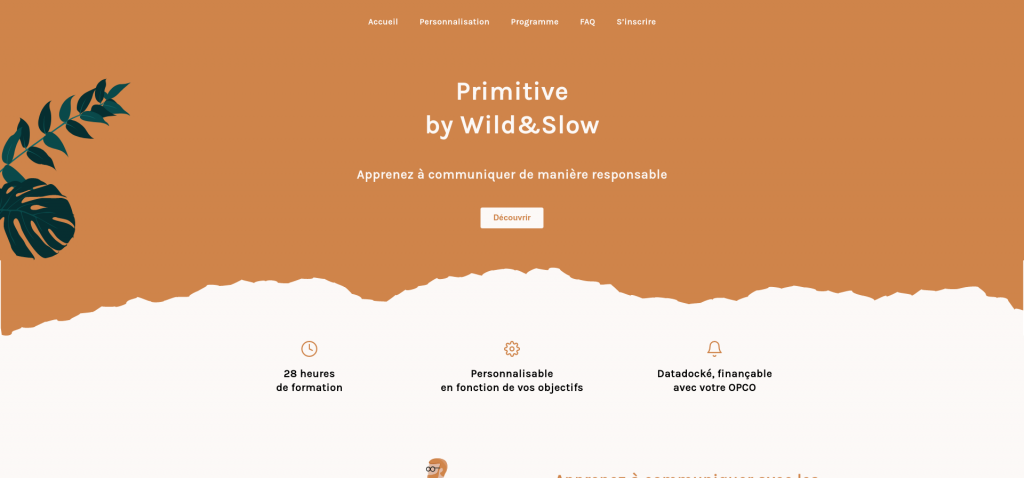
This site appears very light.  The images, even if they are rather numerous, are light but should be lazy-loaded (load them only when they are displayed).  The use of a variable font would limit the requests. The carousel on the home page does not bring much. The fact that it is in autoplay may lead to overconsumption in addition to potentially causing accessibility problems.  The Accessibility page would be more relevant if it stated the compliance with the RGAA (Référentiel Général d’Amélioration de l’Accessibilité) and presented the multi-year accessibility plan for the site.  The few animations, even if they are not intrusive, seem superfluous and can lead to overconsumption.

montpellier metropolises website
Métropole de Montpellier

Following the remeasurement, the site of the metropolis of Montpellier is the least well placed. Leaving the site open, we quickly observe more than 300 HTTP requests for more than 30 MB of transferred data. Even after the site is loaded, the requests continue to accumulate.  

The homepage is particularly heavy, especially in terms of content: lots of images, autoplay carousels, lots of third-party services.  

If quick gains are possible through technical optimization, in-depth work is required, particularly through a more sober approach to design.

Summary of measures for metropolitan websites

versionMétropolesecoscoreEnergieCPUDonnéesMémoireRequêtesCarbonEauSol
https://metropole.rennes.fr/ - RemesureRennes804,600,832,22687,58430,300,0480,528
https://www.lillemetropole.fr/ - RemesureLille764,770,682,37685,11240,280,0470,537
https://www.grandnancy.eu/accueil/Nancy743,540,581,35544,09450,240,0380,412
https://www.bordeaux-metropole.fr/ - RemesureBordeaux724,780,661,45756,86510,300,0490,551
https://www.grandnancy.eu/accueil/ - RemesureNancy724,890,602,04718,18420,310,0500,560
https://www.orleans-metropole.fr/ - RemesureOrleans715,691,461,77544,13370,330,0550,643
https://www.metropolegrandparis.fr/fr - RemesureParis704,470,542,07704,63380,280,0460,511
https://www.saint-etienne-metropole.fr/Saint Etienne703,750,533,80426,20890,360,0490,463
https://www.lillemetropole.fr/Lille693,570,631,73560,04460,250,0390,416
https://www.metropole-rouen-normandie.fr/ - RemesureRouen665,001,300,94706,73300,270,0470,563
https://www.bordeaux-metropole.fr/Bordeaux623,870,851,34562,92600,270,0430,457
https://metropole.nantes.fr/ - RemesureNantes625,321,3510,16748,48600,520,0670,626
https://www.clermontmetropole.eu/accueil/ - RemesureClermont615,700,885,68808,34910,490,0690,679
https://metropole.rennes.fr/Rennes604,311,931,23639,53430,270,0440,495
https://www.toulouse-metropole.fr/ - RemesureToulouse604,750,912,49698,46710,350,0530,560
https://www.metropolegrandparis.fr/frParis594,080,831,94567,65430,270,0430,471
https://www.saint-etienne-metropole.fr/ - RemesureSaint Etienne575,861,0834,99819,961041,130,1130,743
https://www.brest.fr - RemesureBrest565,331,253,87723,991420,510,0700,664
https://metropoletpm.fr/ - RemesureToulon545,420,794,97686,441760,580,0780,694
https://metropole.nantes.fr/Nantes525,071,528,75699,17880,520,0670,613
https://www.ampmetropole.fr/Aix Marseille Provence514,380,9114,12893,421400,680,0760,573
https://www.metropole-dijon.fr/ - RemesureDijon516,082,083,51657,43700,430,0660,706
https://www.nicecotedazur.org/ - RemesureNice505,021,213,06654,931290,460,0650,622
https://www.metropole-rouen-normandie.fr/Rouen494,372,931,64657,77260,250,0420,493
https://www.clermontmetropole.eu/accueil/Clermont454,311,491,23698,79890,330,0510,520
https://tours-metropole.fr/Tours444,641,762,85778,26670,350,0520,547
https://tours-metropole.fr/ - RemesureTours444,891,075,43663,200,320,0490,542
https://www.strasbourg.eu/ - RemesureStrasbourg436,192,682,80754,16840,440,0680,725
https://www.grenoblealpesmetropole.fr/ - RemesureGrenoble416,592,373,81696,83860,480,0730,771
https://metropoletpm.fr/Toulon414,210,954,58921,882420,620,0770,598
https://www.toulouse-metropole.fr/Toulouse414,191,402,10601,40700,320,0480,498
https://www.ampmetropole.fr/ - RemesureAix Marseille Provence407,862,3010,18840,472070,840,1100,984
https://www.metzmetropole.fr/ - RemesureMetz3811,063,248,47925,301490,850,1261,300
https://www.montpellier3m.fr/ - RemesureMontpellier325,932,1340,93754,012591,480,1440,843
https://www.brest.frBrest315,382,403,64882,162180,610,0810,711
https://www.metropole-dijon.fr/Dijon285,886,316,48630,14770,490,0690,692
https://www.orleans-metropole.fr/Orleans286,407,572,27590,651120,470,0730,762
https://www.metzmetropole.fr/Metz2616,105,979,20856,201641,100,1711,858
https://www.nicecotedazur.org/Nice244,623,054,28651,051210,460,0620,576
https://www.grenoblealpesmetropole.fr/Grenoble1910,167,545,87656,85960,680,1071,168
https://www.montpellier3m.fr/Montpellier196,393,4428,83831,253801,420,1480,942
https://www.strasbourg.eu/Strasbourg97,858,801,98675,410,370,0680,860

We have calculated the average of these data. On the general level we notice that the average ecoscore is 50, the energy consumed is 5,65 mAh, the percentage of CPU used is 2,16, the data exchanged is 6,25 MB, the RAM used is 704 MB, the number of requests is 103. Concerning the environmental impact we can observe that the carbon impact is 0,51 gEqCO2, the water footprint is 0,070 Liters and the soil footprint is 0,68 m2.

By distinguishing the measurements from the remeasurements here are the averages that we obtain:

EcoscoreEnergieCPUDonnéesMémoiresRequêtesImpact Carbon (gEqCO2)Empreinte Eau (Litres)Empreinte sol (m2)
Moyennes des remesures575.721.407.30725950.520.0710.68
Moyennes des mesures initiales435.572.925.206821110.490.0690.67

City websites

Here again, we start by looking at the EcoScore of the sites of the cities in the sample.

ecoscore of city websites

Even more than for the metropolises, the trend for the EcoScore is clearly upward.  

In addition to the site of the city of Rennes (already discussed in the context of metropolises), the sites of the cities of Le Havre, Lille and especially Strasbourg have improved significantly. It is also the site of the city of Rennes that presents the best EcoScore. We note in passing the interesting choice of having the same site for the city and the metropolis. As for the lowest EcoScore, it goes to the site of the city of Tours.   
Now let’s look at the environmental footprint of these sites.

impact carbon of city website

The overall trend is downward, which is a very good thing.

Further analysis of selected sites

Lille website
Ville de Lille

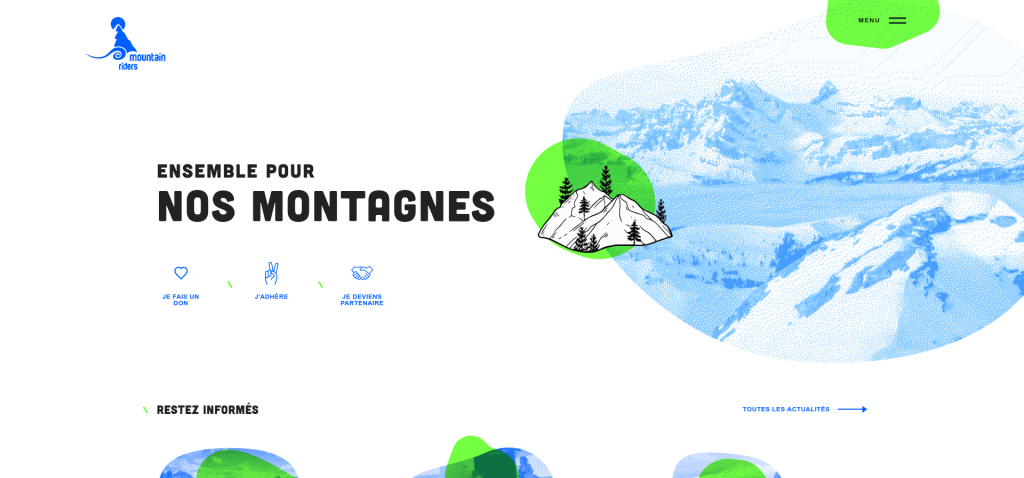
Even if this site has evolved well since the first measurements, there are still areas of improvement to explore.  

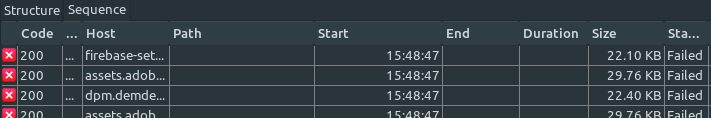
Many HTTP requests, several MB of data exchanged and some 404 errors among the resources to recover.

Many http request

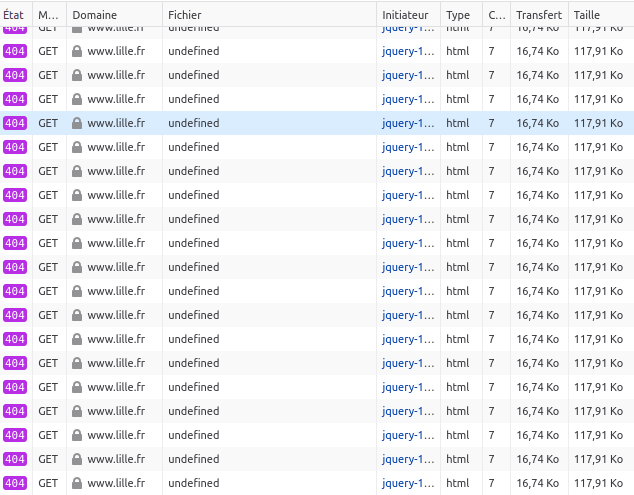
We note here in passing the interest of having an HTML 404 page as light as possible because this is often what the server will return if it does not find what is requested. Note that it is possible to modify this via the server configuration in order to send a simple message instead. The best thing is of course to make sure that you don’t go looking for elements that cannot be found. 

The homepage is very busy, with an auto-scrolling carousel and many images and content.  Il serait avantageux d’utiliser une font variable et d’éviter de charger toutes les icônes de FontAwesome.  Some images, weighing several hundred kb, should be optimized.

Tour website
Ville de Tours

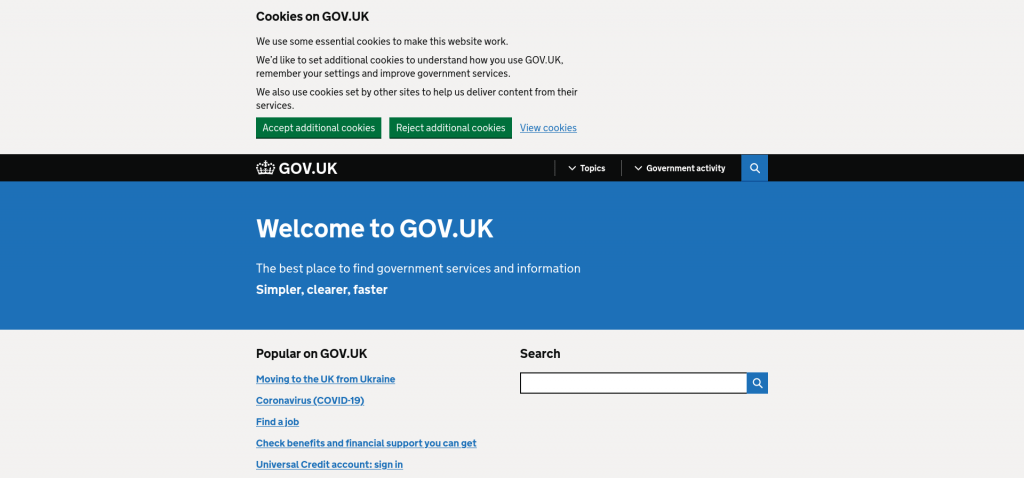
In a rather classical way, there are many images here, some of which should be optimized.  

However, at first glance, the home page does not seem so busy. It is therefore necessary to dig a little to better understand what makes the site so heavy.  
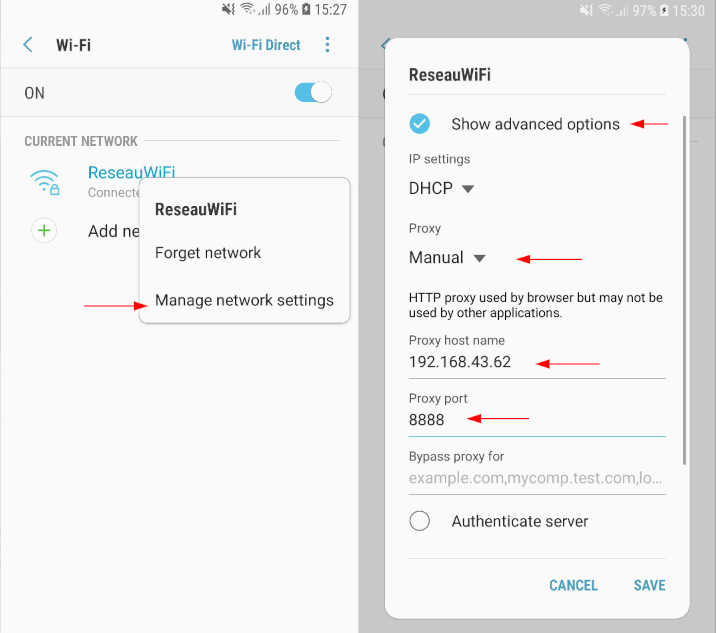
We find about ten queries for fonts and we note in passing Google fonts (which can, let’s remember, cause concern with respect to the RGPD).

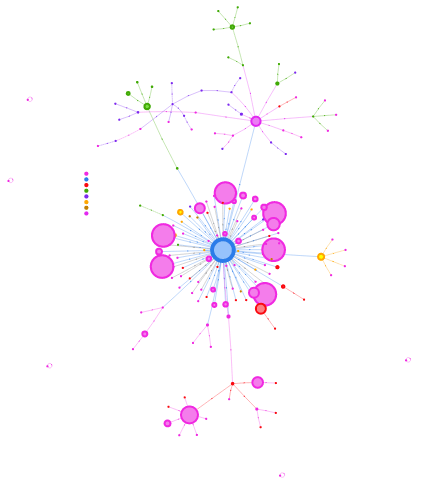
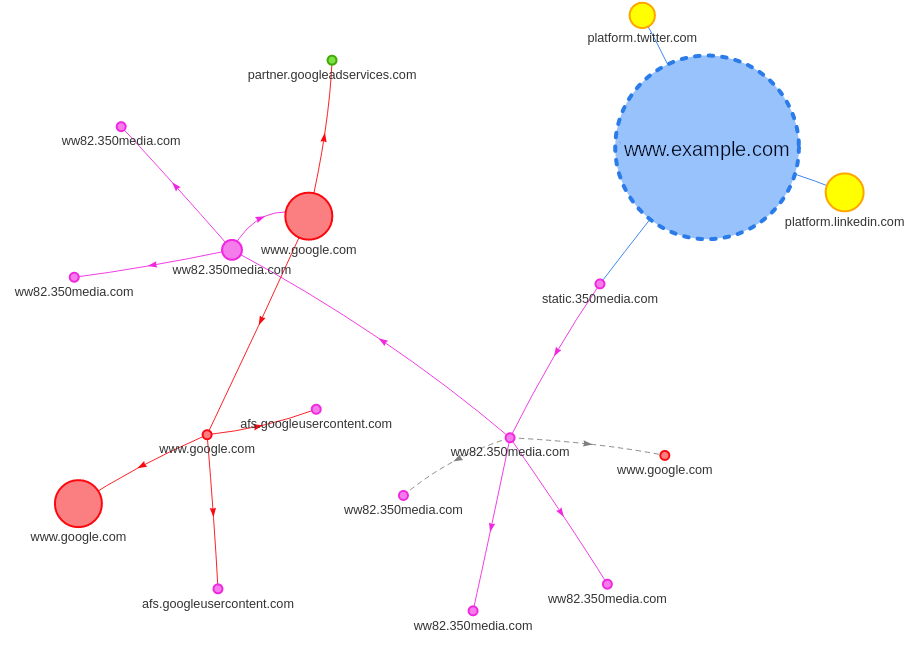
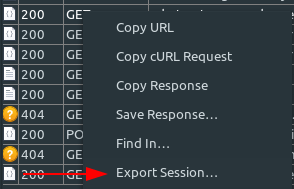
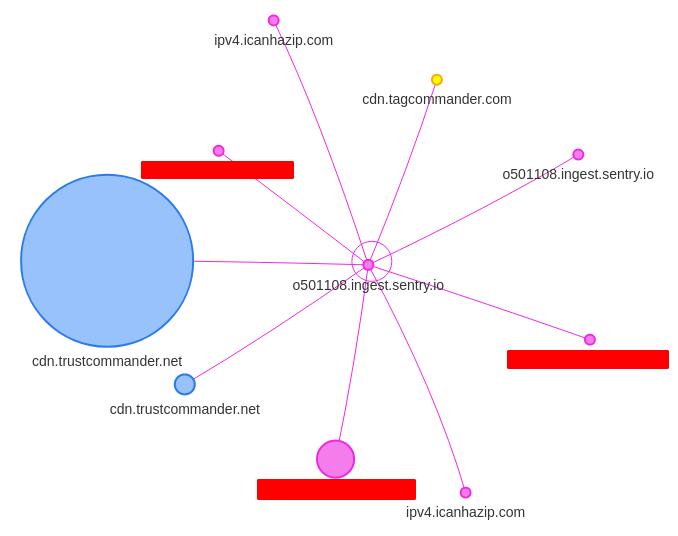
Several requests also seem to correspond to video. But most of the requests come from JS and CSS files. A closer look at the domains of origin of the requests reveals one of the explanations for the weight of the site. A closer look at the domains of origin of the requests reveals one of the explanations for the weight of the site.


Request map

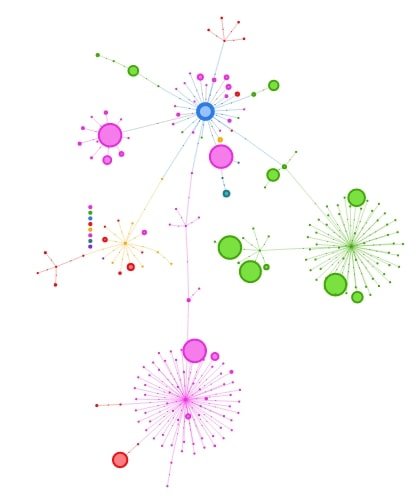
This firework is provided by the RequestMap tool developed by Simon Hearne (already mentioned during the analysis of requests from an Android application). If we don’t have the details, we can see that there are many requests and that most of them come from other domains.  
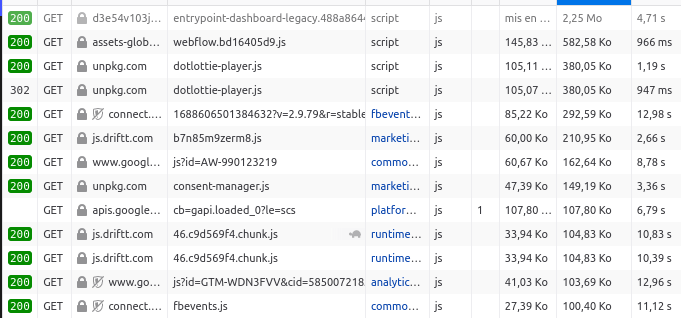
The Domains tab of Webpagetest allows us to learn a little more:

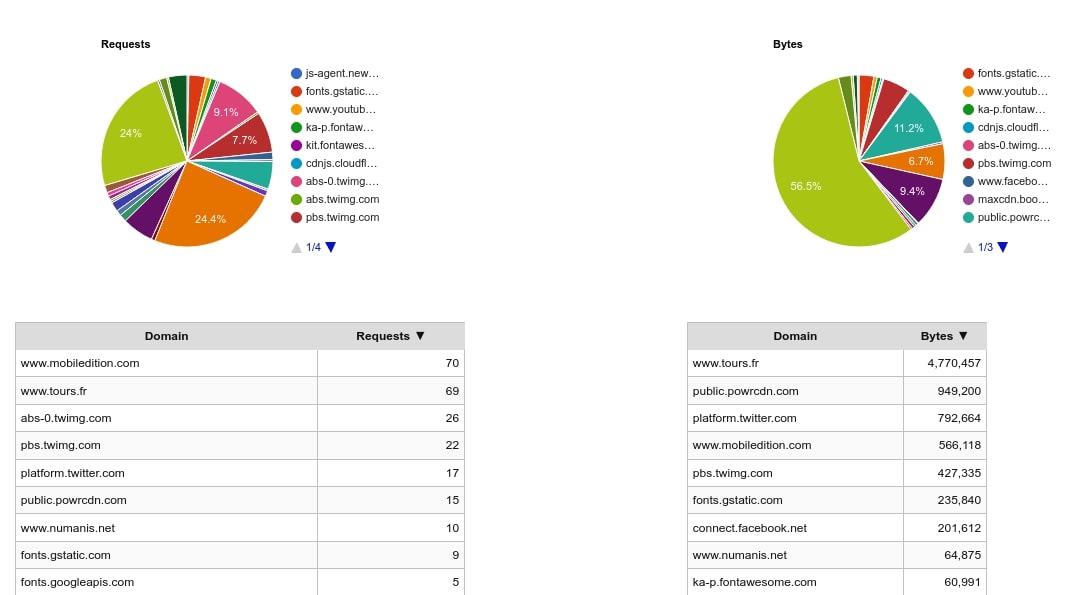
This is only an excerpt but it shows several interesting elements:  

Most of the requests (in terms of numbers but also in terms of weight) come from other domains 
Most requests came from mobiledition.com 
Mobiledition.com proposes to those whose site is not responsive to generate a version of their site specially thought for a display on mobile. The intention is not bad but the approach is rather aberrant from the point of view of ecodesign. Indeed, this overlay will exist on top of the original site and will be automatically refreshed at each update of the site. Nearly 10 years after the appearance of the notion of responsive design, it would be important that all sites can adapt to different devices or even that they are thought mobile-first (first for mobile and then extend to other media). Or even offline-first in order to be able to cope more easily with degraded connections.  
In summary, it would be important to rethink the site in order to limit as much as possible the use of third party services to make it less impactful.

Measurement results for the cities’ websites

versionVillesecoscoreEnergieCPUDonnéesMémoireRequêtesCarbonEauSol
https://metropole.rennes.fr/ - remesureRennes824,721,012,20638,77430,300,0480,541
http://www.lemans.fr/ - remesureLe Mans764,650,642,01686,57710,330,0510,549
https://www.lille.fr/ - remesureLille764,991,074,35688,68800,410,0590,594
http://www.bordeaux.fr/ - remesureBordeaux754,450,540,51612,36260,230,0410,500
https://www.lemans.fr/ - remesureLe Mans754,910,752737,59710,340,0540,577
https://www.reims.fr/ - remesureReims715,391,222,70695,55610,360,0570,625
https://clermont-ferrand.fr/ - remesureClermont Ferrand685,341,121,11596,62560,320,0540,615
http://www.bordeaux.fr/Bordeaux663,381,780,42486,05930,280,040,42
https://www.amiens.fr/ - remesureAmiens645,640,712,67871,97480,350,0570,645
https://www.lehavre.fr/ - remesureLe Havre635,061,244,32775,82880,420,0610,606
https://www.lemans.fr/Le Mans633,730,713,77623,83640,330,050,45
https://www.aixenprovence.fr/ - remesureAix625,160,745,16748,061080,470,0650,629
http://nice.fr/ - remesureNice625,401,3324,73697,57650,830,0880,658
https://www.paris.fr/ - remesureParis626,001,856,81718,24470,450,0660,690
https://www.lyon.fr/ - remesureLyon614,920,953,46740,1461140,440,0620,603
https://www.paris.fr/Paris594,192,4517,64604,00490,620,070,51
http://www.lemans.fr/Le Mans584,081,962,75563,91660,320,050,48
https://metropole.nantes.fr/ - remesureNantes585,351,3110,10740,88600,520,0670,630
https://www.saintdenis.re/ - remesureSaint Denis585,770,875,54715,67670,450,0650,673
https://www.toulouse.fr/ - remesureToulouse575,070,912,91742,451030,410,0610,613
https://www.nimes.fr/ - remesureNimes565,441,5512,29700,411150,640,0790,673
https://www.saintdenis.re/Saint Denis564,452,782,74592,78410,300,050,51
https://www.villeurbanne.fr/ - remesureVilleurbanne555,281,1311,97625,22790,580,0720,635
https://www.amiens.fr/Amiens544,021,682,22734,33590,300,050,47
http://www.angers.fr/ - remesureAngers545,191,282,16596,79620,340,050,603
https://www.marseille.fr/Marseille534,761,747,86402,542430,710,090,66
https://www.reims.fr/Reims533,971,421,29507,91820,310,050,48
https://toulon.fr/ - remesureToulon535,420,654,94945,611530,540,0740,682
https://www.brest.fr/ - remesureBrest525,301,353,72733,541420,500,0690,661
https://www.dijon.fr/Dijon514,322,374,19580,40910,400,060,53
https://metropole.nantes.fr/Nantes506,392,8512,60656,37620,620,080,75
https://www.montpellier.fr/ - remesureMontpellier496,271,019,451029,02730,560,0760,737
https://metropole.rennes.fr/Rennes494,422,891,85616,47480,290,050,51
https://www.marseille.fr/ - remesureMarseille485,921,7119,55690,652010,940,1050,782
https://www.lyon.fr/Lyon464,622,852,69573,40680,350,050,55
https://www.annecy.fr/ - remesureAnnecy455,571,794,23692,911160,480,0690,67
https://clermont-ferrand.fr/Clermont Ferrand455,031,763,17462,48880,400,060,60
https://www.mairie-perpignan.fr - remesurePerpignan457,332,419,74793,541590,730,0970,900
https://www.strasbourg.eu/ - remesureStrasbourg436,383,142,79702,44840,440,0690,746
http://www.angers.fr/Angers425,594,353,46591,16570,390,060,64
https://www.dijon.fr/ - remesureDijon424,661,001,44656,4690,220,0410,511
https://www.grenoble.fr/ - remesureGrenoble406,082,166,44571,02730,490,0700,712
https://www.mairie-perpignan.frPerpignan405,192,782,50544,381470,480,070,65
https://www.aixenprovence.fr/Aix394,611,687,84768,691100,510,070,57
https://www.lille.fr/Lille396,233,3912,66852,37840,650,080,74
https://www.limoges.fr/fr - remesureLimoges398,511,822,33609,381000,540,0880,986
https://www.toulouse.fr/Toulouse384,572,443,00641,751230,430,060,57
https://www.tours.fr/ - remesureTours385,680,885,67818,580,350,0550,628
https://toulon.fr/Toulon375,852,0916,48923,892150,900,100,78
https://www.brest.fr/Brest345,773,093,40843,122090,610,080,75
https://www.grenoble.fr/Grenoble335,666,555,93600,86600,450,060,66
http://nice.fr/Nice336,074,6526,59627,281941,090,120,80
https://www.villeurbanne.fr/Villeurbanne335,222,278,72740,511280,580,070,65
https://www.lehavre.fr/Le Havre324,663,305,40726,971060,460,060,57
https://www.montpellier.fr/Montpellier305,081,867,20899,691680,600,080,66
https://www.nimes.fr/Nimes294,172,325,13715,841670,520,070,55
https://www.annecy.fr/Annecy279,606,742,98619,481230,640,101,12
https://www.limoges.fr/frLimoges2615,127,251,96614,32600,750,141,69
https://www.tours.fr/Tours1610,224,7821,99961,472031,180,151,25
https://www.strasbourg.eu/Strasbourg87,457,955,83663,390,430,070,82

We have calculated the average of these data. On the general level we notice that the average ecoscore is 49, the energy consumed is 5,57 mAh, the percentage of CPU used is 2,22, the data exchanged is 6,36 MB, the RAM used is 689 MB, the number of requests is 99. Concerning the environmental impact we can observe that the carbon impact is 0,50 gEqCO2, the water footprint is 0,069 Liters and the soil footprint is 0,668 m2.
By dissociating the measurements from the remeasurements here are the averages that we obtain:

EcoscoreEnergieCPUDonnéesMémoiresRequêtesImpact Carbon (gEqCO2)Empreinte Eau (Litres)Empreinte sol (m2)
Moyennes des remesures585.531.285.92719880.470.0660.656
Moyennes des mesures initiales415.613.166.816581110.530.0720.680

The initial measurements were conducted on a Samsung Galaxy S7 smartphone running Android 8.

The remeasurements were performed on a Samsung Galaxy S9 smartphone running Android 10. The measurements were performed through our Greenspector Benchmark Runner tool, which allows automated tests.

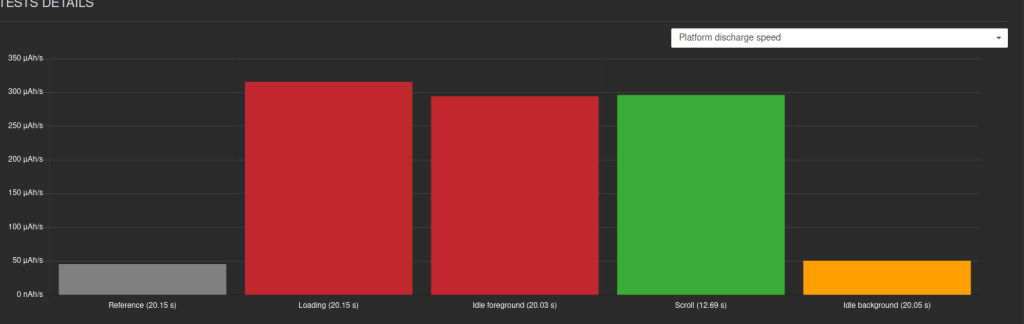
Detail of the scenarios :

  • Loading the application
  • Reading the website in foreground
  • Reading the page with scroll
  • Inactivity of the website in background

Each measurement is the average of 3 homogeneous measurements (with a low standard deviation). The consumptions measured on the smartphone connected to a wifi network can be different when the smartphone is connected to a wired network. For each iteration, the cache is cleared beforehand.

Discover how Greenspector evaluates the environmental impact of digital services.


Nantes Digital Week 2022: Ranking of the digital sobriety of partners’ and visitors’ websites

Reading Time: < 1 minute

Last month we were present at the Nantes Digital Week. We participated in several conferences and workshops on the theme of responsible digital. It was an opportunity to meet many digital actors but also many visitors curious to know more about this vast subject.

On Thursday 22 October we ran the workshop “Hosting, measuring and designing virtuous websites” together with DRI and Webofacto. In this context, we measured the websites of several visitors and partners of the event.

The ranking in detail

The average carbon impact of one minute of navigation for these 98 partners is 0.45 gEqCO2, which is the equivalent of driving 2 metres in a petrol-driven car. Only 8 sites are above this average, which shows a good trend. The most sober website in this ranking (the CIC site, 0.19 gEqCO2) has 7.8 times less impact than the least sober site (Saint-Nazaire Tourisme, 1.5 gEqCO2).

The average power consumption (mAh) is 3.7 mAh and on average 9.01 MB of data is exchanged. In terms of web requests, the average is 73.

RankNameecoscoreCarbon Impact (gEqCO2)requestsEnergy (mAh)Data (Mo)Memory (Mo)Water footprint (Litres)Surface footprint (m2)
1CIC810,19312,971531,870,030,34
2Le Blog du Modérateur840,2183,571,06605,540,030,40
3La Cantine800,22383,21,34570,440,030,37
4Banque des territoires730,22512,921,31669,140,030,35
5Whome760,26433,143,32661,640,040,37
6sfr630,27683,511,45674,380,040,42
7Chateau des Ducs de Bretagne620,27483,91,91757,640,040,45
8BNP Paribas720,28773,122,11669,860,040,39
9Cobage670,31723,33,15582,250,040,40
10Mismo610,31733,782,48864,870,050,46
11Enedis520,35573,55,91716,590,050,42
12Sogetrel520,371033,473,76860,640,050,44
13Ecosystem360,37524,934,33744,720,050,57
14_icilundi690,38273,379,48661,030,050,40
15PALO IT610,39873,85,04708,840,050,47
16Université de Nantes710,4613,468,16650,390,050,42
17VIF510,411123,794,41826,630,050,48
18La Box Loire Atlantique630,47913,748,63650,420,060,47
19Radio Prun'500,48443,5612,92712,560,050,43
20Maison Europe580,5514948,09695,450,070,53
21Isefac Bachelor410,61813,828,4915,640,070,53
22Accenture350,61636,9211,29647,930,080,80
23Tele Nantes480,81463,4321,39821,120,080,48
24Groupe Onepoint571,11843,3640,15744,130,100,47
25Saint Nazaire Tourisme471,5704,1658,42761,910,130,57

For each of these websites and applications measured on a Samsung Galaxy S9 smartphone, the measurements were carried out using our Greenspector Benchmark Runner tool, which enables automated testing.

  • Loading the application
  • Reading the website in the foreground
  • Reading the page with scroll
  • Website inactive in background

Each measurement is the average of 3 homogeneous measurements (with a low standard deviation). The consumption measured on the smartphone connected to a wifi network may be different when the smartphone is connected to a wired network. For each iteration, the cache is emptied beforehand.

Find out how Greenspector assesses the environmental footprint of a digital service.

Analysis of the 10 sites nominated for mobile excellence by Awwwards

Reading Time: 4 minutes

Awwwards references websites that stand out from the crowd in terms of their conception, user experience and design. It is a true reference for web designers and web developers around the world. The concept is simple : every day, designers submit their websites to Awwwards. The site is submitted in the “Site of the day” category. It is judged by members of the Awwwards community of designers, developers and agencies. The best site of each day of the year appears in the book “The 365 Best Websites Around the World”. Every month, a site is elected “Site of the month”. At the end of the year, during a ceremony, the jury chooses the best of the year.

categories awwwards

The Awwwards site has grown since its creation in 2009. The nominees are divided into 6 groups:

  • Sites of the Day
  • Sites of the Month
  • Sites of the Year
  • Developer
  • Mobile Excellence
  • Honorable

There are also site themes called Categories, of which there are 26.

Pretty sites but not necessarily sober ?

Our curiosity led us to analyze 10 sites nominated on Awwwards. We have selected sites nominated in the “Mobile Excellence” group. These sites are judged on 4 criterias :

  • Friendliness
  • Performance
  • Usability
  • PWA

Awwwards assigns a score for each of the above criteria, which is then used to calculate a total score.

At Greenspector, we decided to go further in the analysis of these sites to see if they met our sobriety criteria.

Additional analysis of sites at the bottom of the ranking 

Betterup.com

landing page betterup.com

More than 200 HTTP requests to load the page and then 1 request about every 10 seconds. The requests point to about 50 domains.

These queries can be found on the RequestMap (a tool created by Simon Hearne):

RequestMap

While the presence of the cookie banner is legitimate, the chatbot obscures a good part of the display, which is problematic for an Awwward-awarded site. Is this chatbot really necessary? Shouldn’t it open (and load) only on user request? 

It should also be noted (but unfortunately this is often the case) that about thirty requests are triggered as soon as cookies are accepted.  

When scrolling, the number of requests and the amount of data transferred increase considerably following the direct integration of a Vimeo video. The use of the facade pattern would have been more judicious. We also notice a carousel which is difficult to use on mobile (swipe only). 

The lazy-loading is well implemented but we note various superfluous visual effects (in particular parallax) which still come to weigh down the site, in particular with scrolling.  

When we scroll down to the bottom of the page, we are at more than 400 HTTP requests and more than 12 MB of data transferred.

Finally, the Wave plugin detects about 40 accessibility errors and about 30 contrast errors.

We had previously discussed the subject of sober sites, but here we are typically on a site where a very busy design and too many third-party scripts greatly degrade the user experience. This is particularly true when we look at the measurements during the pause stages:

Ideally, there should not be any data transfers or such sharp spikes in the battery discharge rate. This may be due to third party services or animations.

Datagrid.co.jp

landing page site datagrid.co.jp

For this site, the loading never really ends, as the Firefox developer tools show:

screenshot results solution

The stats here (including loading time) never stop increasing.  

The site is undoubtedly interesting from the point of view of pure design but it is a site that is absolutely not usable:  

-The perpetual movements (without the possibility of control) will make it inaccessible for some users.  
-The continuous requests to about fifteen domains will put a strain on the data plan of some users.  
-Contrast errors are indeed present and keyboard navigation is more than laborious.  

All this results in an environmental impact more than consequent with continuous data transfers and solicitation of the battery of the smartphones used, even in background.

Webflow.com

landing page site webflow.com

The remarks on the two previous sites apply largely to this one. When loading, there are more than 200 requests for 2 MB transferred. Indeed, there are more than 57 domains, which corresponds well to the slogan of the site proposing to make your website a marketing asset.  

If the size of the images is rather well controlled, most of the weight of the site comes from the JS with more than 100 requests of which a dozen are more than 100 kb each.

The lazy-loading of the images does not seem to have been implemented and the design of this homepage seems to be much too heavy anyway.  

On the other hand, the errors reported by the Wave plugin are almost non-existent.  

In short, there is still work to be done in order to make this homepage more sober, to better integrate certain elements but also to limit the use of third party services.  

Additional analysis of top-ranked sites 

Ladispensadelchianti.it

landing page site ladispensadelchianti.it

This site is rather light (just over 1 MB) and fast to load. We still get 60 HTTP requests for the first load, spread over 15 domains.  

This homepage is visually rich but remains clear. The images are optimized (especially through the use of webp format). It is regrettable that lazy-loading is not implemented. 

The cache is globally well managed, which is a very good thing.  

On the other hand, we notice that the fonts are rather large, for a total of 5 requests. It would be better to use system fonts or a variable font to limit the number of requests.  

Also, from an RGPD perspective, it would be best to avoid Google fonts or host them yourself. 

Some accessibility errors appear with Lighthouse.  

Animations should be limited to the scroll and cursor movement effects seem superfluous (even harmful for the user). 

Ingridparis.com

landing page site Ingridparis.com

This site is apparently quite sober. No requests to third party services and globally optimized images but too many. The implementation of lazy-loading (preferably natively) would be a very good thing.  

The loading time is made longer by the default loading of a 1 MB video and about 20 requests for the fonts alone. 

On the other hand, the cache is implemented on almost all elements. 

Even if Wave reports few accessibility errors, animations should be less present at the scroll on the page. Currently, they make the scroll step the most impactful step from the point of view of the battery discharge speed.

Azzerad.com

landing page site azzerad.com

The trend observed so far seems to be confirmed: many images (optimized but most of them are loaded twice) and many animations.  

15 queries just for fonts but not many queries to third party services.  

In short, a site that would benefit from being a little more sober in its presentation and from going further in the technical optimization to avoid that the efforts (especially image optimization) are cancelled out by bad practices (such as double loading of images).  

On the Wave side, some accessibility errors come up but mostly contrast problems.

Data projection to measure environmental impact

We went further in the analysis by carrying out a data projection in order to obtain additional details, notably on the CO2 impact, the water footprint and the soil footprint.

Here, energy, data exchange, CPU and memory usage are directly measured on the device. The environmental impact and Ecoscore (based on the measurements but also on the application of good practices) are calculated. You will find the details in the dedicated article on the blog. It is thus possible to compare the different sites, classified here according to their Ecoscore (the higher the better).

versionecoscoreCO2 impact (gEqCO2)requestsEnergy (mAh)Data exchange (Mo)CPU (%)Water footprint (Litres)Surface footprint (m2)Memory (Mo)
hskr.ru600,30235,451,822,710,050,61682,42
ladispensadelchianti.it750,31564,731,571,140,050,55511,82
ingridparis.com650,36385,543,592,110,060,63632,50
azzerad.com630,38755,591,981,500,060,65735,91
marcoambrosi.salon520,41475,814,752,440,060,67701,52
once-lifetime.com450,45565,736,372,240,060,66734,36
grege-interieurs.com390,642611,206,805,060,111,25746,73
webflow.com330,671796,347,173,210,090,80863,02
lamalama.n420,71219,7113,424,710,101,09828,77
blueyard.com560,72508,0215,132,560,100,92575,93
datagrid.co.jp290,801289,3411,023,150,111,10671,31
betterup.com270,8112111,287,853,510,121,31862,15

Conclusion

When the design of sites must be judged or compared, those that come out on top are often sites offering a profusion of images and other visual effects such as animations or video. Even if these design choices can be more attractive or entertaining, they often harm accessibility but also environmental impacts… and therefore, ultimately, the users themselves. 

Even when looking for sites specifically dedicated to sustainability, one finds examples with numerous accessibility errors or transferring files larger than 5 MB when loading. 

On the Awwwards site, usability is indeed one of the criteria taken into account. However, a quick look at the scores shows that even for betterup.com, which has many accessibility errors, the usability score is often very high. It is normal that a subjective element, often linked to personal experience and the perception one has of such creations, comes into play. Nevertheless, an objective measure should allow to relativize and nuance the statement, as well for accessibility as for sobriety (even performance). These additional constraints could be a source of creativity and give rise to innovative user experiences while remaining respectful of users and the planet. 

Which image format choose to reduce energy consumption and environmental impact?

Reading Time: 4 minutes

It is not easy to choose the right type of image to reduce environmental website impact. We can focus on image size or on display performance (are they two related ?). This may be the right approach. However, an energy measurement will be a more precise element if you really want to measure the actual consumption and move towards reducing the environmental impact.

in 2017 we carried out a benchmark of the new WebP format compared to JPEG and PNG. Support for Webp in browsers was beginning. In addition, AVIF, a promising image format, has arrived.

Here is an updated study.

Methodology

As a test image, we used the one proposed by Addy Osmani in an article on Smashing Magazine.

The images were generated to have the same perceived quality. Compression qualities are therefore different between formats.

Image 1 : https://res.cloudinary.com/ddxwdqwkr/image/upload/v1632192015/smashing-articles/206-webp-ayousef-espanioly-DA_tplYgTow-unsplash.webp

  • Test 1 Default quality given by Sqoosh (https://github.com/GoogleChromeLabs/squoosh/) : JPEG original (560KB), JPEG@q75 (289KB), WebP@q75 (206KB),  AVIF@q30 (101KB)
  • Test 2 Target quality JPEG@q70 : JPEG (323KB), WebP@q75 (214KB), AVIF@60 (117KB)
  • Test3 Low quality : JPEG@q10 (35KB), WebP@q1 (35KB), AVIF@q17 (36KB)2

Image 2 : https://res.cloudinary.com/ddxwdqwkr/image/upload/v1632080886/smashing-articles/q50jpg.jpg

  • Test1 : Target quality of 45k : Original (442kB), JPEG@q50 , WebP@q54, AVIF@q36

Image 3 : https://res.cloudinary.com/ddxwdqwkr/image/upload/v1632082138/smashing-articles/q10-25.jpg

  • Test 1: Target quality of 25kB : Original (716KB),  JPEG@q10 , WebP@q5, AVIF@q19

Measurement protocol

  • We display the images one by one in a Chrome browser on a real device (Samsung Galaxy S10).
  • We use Greenspector tools to measure energy consumption and other metrics (CPU, performance…).
  • We perform a measurement throughout the display of the image and this 3 times to have stable measurements.
  • The measurements are made under different Wifi, 3G and 2G network conditions.

Results

On image 1 for test 1, we obtain the following energy consumption measurements:

Consommation d'énergie pour l'image 1

If we observe more closely the behavior in WiFi, we can better appreciate the differences in consumption with the confidence interval.

Consommation d'énergie pour la wifi avec intervalle de tolérance

In Wifi, the consumption is relatively similar between the types of image. JPEG consume little more than other format. It is followed by WebP format and then by AVIF.

In 3G and 2G, the difference in consumption is noticeable and AVIF consumes less energy than Webp.

These behaviors are explained by the smaller file sizes in AVIF and Webp.

On image 2, the behavior is the same:

Comparaison de consommation d'énergie pour l'image 2 entre la wifi, la 3G et la 2G

In image 3, there is almost no difference between the formats. The image is small and we find ourselves in an operation close to wifi (fast transfer):

Comparaison de consommation d'énergie entre la wifi, la 3G et la 2G

The behavior is the same with image 2 which is at 45kB:

Consommation d'énergie pour l'image 2 en wifi, 3G et 2G

This is the same behavior for image 3:

Consommation d'énergie pour l'image 3 en wifi, 3G et 2G

It is necessary to monitor the new formats (JPEG XL, Webp2…) as well as the optimization of the algorithms because even if the gains in size are significant, the decoding processing could potentially gain even more efficiency. Indeed, here is for example the CPU processing for image 1 on test 1, where AVIF consumes more CPU than the other formats.

Traitement CPU pour l’image 1

Recommendations:

In any case, it is necessary to compress images with lower quality, regardless of the image format. A quality >85% is useless. Energy consumption is reduced by a factor of 2 for qualities that remain high, and reduced by a factor of 6 for low qualities.

Even if the energy consumption is relatively similar between the formats, the gain provided by AVIF and Webp is much greater for less efficient connections. The choice of AVIF and Webp will be preferable because the users are not connected with broadband! In addition, the gain in terms of data exchanged will be interesting to limit the overall size of the site.

The choice between Webp and AVIF is not easy and will depend on the type of images and visitors. Additionally, Google is working on WebP version 2, and formats like JPEG XL are coming to compete with AVIF. However, considering the benefits of Webp other than the environmental impact, we recommend the use of WebP more.

For information, here is the taking into account of the AVIF format in the browsers:

Pour information, voici la prise en compte du format AVIF dans les browsers :

As well as the Webp format:

Pour information, voici la prise en compte du format webp dans les browsers :

In any case, optimize your images, compress, reduce the size and lazy-load!

The impact of our videoconferencing uses on mobile and PC! 2022 edition

Reading Time: 5 minutes

We have decided to proceed differently for this year’s ranking 2022. Unlike the 2021 edition, we have reduced the number of applications measured. We have both taken measurements on the phone and also on the PC to meet demand. It is the purpose of these new measures to compare how the solutions stack up in terms of environmental impact (Carbon) on different user scenarios but also on two platforms: PCs and phones.

We compared 10 apps: BlueJeans, Google Meet, Go To Meeting, JITSI, Skype, Teams, Webex, Whereby, Zoho Meetings et Zoom.

For each of its applications, measured on an S7 smartphone (Android 8) and on a computer, the following three scenarios were carried out through our Greenspector Test Runner, allowing manual tests to be carried out over a period of 1 minute in one- one-to-one: :

  • Audio conference only
  • Audio and video conferencing (camera activated on both sides)
  • Audio conferencing and screen sharing

Learn more about the methodology.

Projected ranking in the carbon impact of videoconferencing apps (gEqCO2) on mobile

Scenario / Year1 min audio videoconference1 min audio + camera videoconference1 min audio + screen sharing videoconference
20220.31 gEqCO21.10 gEqCO20.54 gEqCO2
Equivalent in meters travelled in a light vehicle2,76 meters9,82 meters4,82 meters

Audio video conferencing has an average impact of 71% less than cameras active and 42% less than sharing a screen.    

The Top 3 of one minute of videoconference on average: Zoho Meeting (0.49 gEqCO2), Microsoft Teams (0.513 gEqCO2) and Whereby (0.533 gEqCO2). Zoho Meeting, first in this ranking on the carbon impact side, has an impact 2.2 times less than GoToMeeting, the last in this ranking. The average of this ranking is 0.657 gEqCO2, 4 solutions are above.

The main part of the Carbon impacts is on the user device part (61%), followed by the Server part (23%) and finally the Network part (16%).

Here are the three mobile applications with the least impact in terms of Carbon according to the scenario: 

Audio (Top 3)Audio + camera (Top 3)Audio + Screen Sharing (Top 3)
Microsoft TeamsWherebyMicrosoft Teams & Zoho Meeting
Cisco Webex MeetingZoho MeetingZoom & Google Meet
JITSI MeetTeams & ZoomCisco Webex Meeting

Energy consumption of videoconferencing apps (mAh) on mobile

Here are the power consumption averages for the three phone scenarios: 

Scenario / Year1 min audio videoconference1 min audio + camera videoconference1 min audio + screen sharing videoconference
20226.68 mAh14.29 mAh7.82 mAh

A single minute of audio video conference consumes 53% less energy (or 2.1 times less) than with cameras activated, and 14.5% less than sharing a screen.

Energy consumption of videoconferencing apps (mAh) on PC

Here are the computer energy consumption averages:

Average: 1mn of audio videoconferenceAverage: 1mn of audio + camera videoconferenceAverage: 1mn of audio + scree sharing videoconference
17.25 mAh23.65 mAh22.82 mAh

Here, one minute of audio video conferencing consumes 27% less (or 1.4 times less) energy than with cameras activated and 24% less than sharing a screen. Therefore, depending on the scenario, we see a much more significant difference in energy consumption on the telephone.

Zoho Meeting (76.21 mAh), BlueJeans (81.70 mAh) and Microsoft Teams (83 mAh) are the top 3 in energy consumption (all scenarios combined). First in this ranking in terms of energy consumption, Zoho Meeting consumes 1.4 times less energy than the last.

Here are the three mobile applications with the least impact in terms of Carbon according to the scenario: 

Audio (Top 3)Audio + camera (Top 3)Audio + Screen Sharing (Top 3)
Blue JeansZoho MeetingZoho Meeting
Cisco Webex MeetingZoomTeams
Google MeetTeamsBlueJeans

Exchanged data from videoconferencing apps (MB) on mobile

Here are the averages of the data exchanged for the three scenarios:

Scenario / Year1 min audio videoconference1 min audio + camera videoconference1 min audio + screen sharing videoconference
20220,88 MB10,34 MB4,49 MB

Data consumption is where the gap between tools and uses is widening.

On average, one minute of audio video conferencing consumes 91% less (or 12 times less) data exchanged than with activated cameras and 80% less than sharing a screen.

The Top 3 (all scenarios combined) in data exchange: Whereby (4.54 MB), Zoho Meeting (8.39 MB) and Skype (9.68 MB). Whereby (via Firefox) first in this ranking in terms of data exchanged consumes 9.2 times less than the last in this ranking: GoToMeeting.

Here are the three least data-consuming apps according to the scenario:

Audio (Top 3)Audio + camera (Top 3)Audio + Screen Sharing (Top 3)
Blue JeansWherebyZoho Meeting
Zoho MeetingZoho MeetingSkype
WherebySkypeZoom

For our daily use of videoconferencing: 

In the study carried out in 2021, we indicated that videoconferencing is preferable to travelling by car. Indeed, this solution is less polluting, however, beware of rebound effects! Since the global pandemic, working from home has become widespread in many companies, but this practice encourages more people to live away from their workplaces. As a result, the environmental benefits of working from home can be offset depending on the pace of remote working and the means of transport used.

In addition, it is necessary to draw attention to the increase in energy consumption of the generated hearths. It is possible that this increase might compensate for the drop in energy needs on business premises, but this must be considered on a case-by-case basis.

Examples:

Measured versions:

  • Microsoft Teams (4.10.1) / computer (1.5.00.10453) 
  • Zoom (5.10.4) / computer (5.10.7.3311)
  • Google Meet (2022.05.15.450927857) / light version on Firefox
  • Cisco Webex Meetings (42.6.0.239) / computer (42.5.0.22187) 
  • GoToMeeting (4.8.1) / light version on Chrome
  • BlueJeans (2.2.0.142) / computer (2.29.1-3) 
  • Skype (8.82.0.403) / computer (8.83.0.411
  • Whereby (2.3.0) / light client on Firefox
  • Zoho Meeting (2.2.1) / light version on Firefox
  • Jitsi Meet (21.3.0)/ light version on Firefox

For each of its applications, measured on an S7 smartphone (Android 8), user scenarios were carried out using our Greenspector Test Runner, allowing manual tests.

Once the app is downloaded and installed, we run our measurements on the app’s baseline and original settings. No changes are made (even if some options allow you to reduce energy or resource consumption: data saving mode, dark theme, etc. However, we encourage you to check the settings of your favourite application in order to optimize its impact.

The average of five homogeneous measurements (with a low standard deviation) is used for each measurement. The consumption measured on the given smartphone according to a Wi-Fi type network may be different on a laptop PC with a wired network for example. For each of the iterations, the cache is first emptied.

As for computer measurements, the Yocto-Watt from YoctoPuce was used to measure energy consumption. In the same way as for mobile applications, heavy clients, when one existed, were downloaded and then installed without changing the basic parameters. This chip, therefore, only allows you to have energy consumption, which is why the carbon impact and the data exchanged in this article only concern the telephone part. Additional resource on the Yoctopuce.

Find out how Greenspector assesses the environmental footprint of using a digital service. (Full methodology)

Digital sobriety at Greenspector 

Reading Time: 6 minutes

As we talk more and more about digital sobriety, it’s important to come-back to this notion. Especially it’s a part of greenspector activity. 

Definition 

Digital sobriety is a global approach of digital, respectful of the earth and people. 

Since few years, this topic takes more and more extent. We see this notion almost everywhere but often limited in consideration of environmental impact. For many Eco-design has been the gateway into the digital sobriety. 

  • Eco-design and digital environment impact consideration 
  • Digital accessibility and inclusion 
  • Attention economy 
  • Respect for personal data and privacy protection  
  • Cybersecurity 
  • Ethics 
  • Low tech and fight against technological solutionism
Eco-design and digital environment impact consideration

Various aspects of digital sobriety 

Environmental impact consideration plays a crucial role in digital services. Beyond resources consumption related to their use (for example, energy needful to charge the battery), these services affect the user’s equipment: battery and components wear, memory and system surcharge… Those impacts motivate early change of latest and newer equipment. 

However, today, the manufacturing of those equipments represents the phase of digital services with the greatest impact on the environment. It suits to create websites, mobile applications, and other digital services with as low impact as possible.  

That’s why the repositories have been increasing. Examples include the GR491 of INRthe RGESN of DINUMthe 115 best practices or OPQUAST.   

Add to this the law REEN as well as tools for evaluating the impact of digital services 

Finally, we observe that the subject is gaining momentum and structuration. We can only delight even though there is a long way to go. 

The benefits for users and companies are considerable. Overall, this approach improves the user experience (and in particular performance) as well as reduces development, maintenance and hosting costs. Similarly, the adoption of eco-design leads to the development of expertise, an improvement in brand image and constitutes a factor of attractiveness for customers but also for future employees 

As a result, an eco-designed digital service will often have a smaller scope, which will facilitate its security, its compliance for accessibility and will tend to restrict the personal data collected.

personal data collected

Eco-design also tends to ignore mechanisms aimed at capturing attention (infinite scroll, autoplay of videos, excessive notifications, etc.). This also constitutes an ethical advance: the user is no longer just a consumer who must be retained by all possible means. We gain their trust and support by first providing them with quality service, tailored to their expectations. 

Finally, by placing the user at the center of considerations, digital sobriety tends to avoid technological solutionism. This will avoid (among other things) going to digital services when it does not seem necessary. Sometimes a good old SMS can replace a website or a mobile application: a low-tech solution can meet user needs just as well (sometimes even better). 

At a time when more and more services (including public ones) are becoming digital, the accessibility of digital services is a central subject, in a process of inclusion and access to services for all. Unfortunately, this important subject does not yet receive all the attention it needs, although many tools exist and are being developed. The standard (RGAA) is now in its fourth version and the legislative framework extends to public structures as well as companies whose turnover exceeds 250 million euros. It offers a concrete approach to WCAG: a complete panel of W3C recommendations for accessible web content. Verification tools are numerous, even if they are not sufficient to verify all the criteria. 

Yet, even today, 97.4% of the most used websites have at least one accessibility errorThe compliance with administrative procedures is also far from what one might expect. Accessibility nevertheless remains an essential subject for digital sobriety technology and contributes to ensuring the usability of digital services as well as their sustainability.   

Beyond the penalties incurred by companies in the event of non-compliance with obligations, the benefits of this approach are numerous : 

  • Ensure that everyone can access the services and information offered under good conditions. 
  • Reach as wide an audience as possible, in particular via the curb cut effect
  • Develop internal expertise (retention of employees and attractiveness for recruitment). 

The attention economy is a field relatively little known as such, although it is already deeply rooted in our daily lives. These are all the mechanisms (design, design, functional, and others) that make us addicted to our smartphones and certain apps. We are talking here about captological mechanisms (or deceptive patterns): infinite scroll, notifications, modals, autoplay, etc. Through these design choices, the time spent on our mobiles increases, and our attention span decreases. The stake around our attention is above all financial. All this is detailed in the book The Goldfish Civilization and structures such as Designers Ethiques have already taken up the subject

This problem is all the more fundamental since we find ourselves faced with tools designed to spend as much time as possible on them, even though their use has a non-negligible environmental impact (via the wear and tear of the terminals, their energy consumption but also by ultimately pushing consumerist behavior, in particular through massive exposure to advertisements). It should be noted that in addition to these harmful impacts on the environment and the individual, there are ethical considerations since this system often results in greater collection of personal data. 

Regarding personal data, the question is not new, but the implementation of the GDPR was an important turning point. The aim here is to regulate the capture and storage of personal data of European citizens but also by European companies. This complex subject is particularly linked to micro-targeting (targeted advertising based on data collected on the Internet user) and is all the more dizzying in that it involves companies buying and reselling personal data (data brokers, all against a background of surveillance and political issues as in the case of Cambridge Analytica). More recently, the subject of personal data has returned to discussions following the questioning of the use of Google Analytics and Google Fonts, particularly in France. Not to mention the leaks of personal data that occur very regularly.   

Cybersecurity is present everywhere, through security breaches and other incidents that we hear about regularly. Today, it would seem aberrant or even irresponsible to offer a digital service that is not secure. However, this area requires many skills as well as constant monitoring. Again, digital sobriety can reduce the attack surface of a digital service. In return, care must be taken to ensure that the protection of the user does not force him to update his applications and software too often, under penalty of tending towards software obsolescence. Likewise, open source makes it possible, via total transparency, to prevent the presence of vulnerabilities. 

Ethics is a complex but necessary subject in the digital field. It is often at the heart of discussions, especially on the vast subject of algorithms and machine learning, for example in the case of self-driving cars. In order to design a digital respectful of individuals, the question of ethics is inseparable. 

Finally, technological solutionism, largely theorized by Evgeny Morozov, warns that digital is not always an appropriate solution. This awareness is all the more essential when we seek to reduce the environmental impact of digital technology.

Digital sobriety as part of the Greenspector’s work.

At Greenspector, digital sobriety is at the heart of our business. Even if our primary concern remains the reduction of the environmental impacts of digital services, all this is accompanied by considerations related to digital sobriety technology. The inextricable links between the different aspects of this subject mean that it is essential to guarantee a global approach so as not to miss an area for improvement, or even to avoid providing a recommendation that would harm the users in one way or another (deterioration of accessibility, security risk, etc.). If the impact is not always directly measurable or the seemingly minimal gain from the point of view of sobriety, other axes such as accessibility, the absence of captological mechanisms, and respect for privacy will contribute to making a more resilient product. This is why (and this is just one example among many), we encourage our customers not to directly integrate content from third-party services such as Youtube, Twitter, and others.

For this, Greenspector supports its customers in the eco-design of products throughout the life cycle of the project, but also in the measurement of consumption and the monitoring of impacts over time, in addition (for example) to an improvement process. These are the principles that we also apply to our own products.

In order to work for a digital system that respects people and the planet, it seems essential to apply these values right down to the proposed working framework: allow everyone the possibility of teleworking as much as necessary, insist on the right to disconnect and give everyone the opportunity to adapt their schedules to their own needs. There is also the desire to free up time for everyone to carry out digital monitoring, to create spaces to share the results of this monitoring and to support the development of skills.

Resources to go further

The resources to become aware of digital sobriety are multiplying, but here are already two good starting points : 

CMS, No Code or without CMS, which solution to choose for a sober website?

Reading Time: 6 minutes

Today, we are studying the impact of solutions allowing the implementation of websites without knowledge of coding. Among these solutions, we can include CMS (Content Management System) but also No Code solutions.

This article is the first in a series where we analyze the measurements of 1500 sites through our tools.
In these articles, we will deal with the impact of technologies, and parameters…

Methodology disclaimer:

We have measured more than 1500 sites on real devices via our benchmark suites allowing the realization of automated tests (launch of the site, waiting, scrolling, sitting in the background). We then retrieve technology information from these sites via the WepAnalyzer solution.

We have chosen to focus our analysis on energy consumption. Consuming energy affects battery life on user devices, which ultimately impacts the environment.

How to read the graphs?

We visualize the data by “box plot” graphs:

  • The centre bar indicates the median. The rankings are made with this data.
  • The top and bottom of the box are bounded by the 25th and 75th quantiles.
  • The size of the box is called the interquartile range (IQR)
  • The bars at the top and bottom are the whiskers and delimit the expected values
  • Whiskers expand at 1.5 IQR
  • Values ​​outside the whiskers are visualized via dots. They represent either errors or outliers.

We deliberately discarded sites that did not have enough samples (for example less than 10 sites with a certain technology).

How are CMS and No Code solutions positioned?

Ranking of CMS according to the median value of energy.

We find the most widespread technologies (according to Web Core Vitals), apart from Shopify (these sites must be classified in the “No CMS” category).

We observe a 20% difference between the most efficient solution (Ametys) and the least efficient (Webflow).

Three CMS are positioned ahead of sites without CMS. Popular CMS like Drupal and WordPress are lagging behind. The last four solutions are No Code solutions.

There are many outliers in some categories (WordPress, sites without CMS). It is explained by a large data set (several hundred sites). An exploratory analysis of these sites generally shows that they are sites with fairly heavy streaming processing (such as video). Here is an example of a site positioned in “outlier“ the loading and idle stage (inactive site) consume a lot given an animation that runs continuously.

Quelques pistes d’explications à l’analyse des CMS :

Ametys: a domain-specific CMS

Ametys is a specific CMS which is used for institutional sites. Our ranking of school websites, in which many schools use this technology, explains its presence in this ranking. Its good positioning would have to be analyzed from a technical point of view. However, we can deduce that a solution that targets a type of need will be more optimizable than a generic solution. The integration of multiple functionalities in a CMS will indeed lead to overconsumption. We also observe that these institutional sites include fewer modules than the other sites. It is ultimately about functional sobriety.

Squarespace: an all-in-one solution

Squarespace is a publisher-hosted CMS. On the sites analyzed, we can identify there are few requests (<30), so there are potentially integrated optimization solutions. In other tracks, all the resources are hosted on Squarespace, and the assets (or assets) are on dedicated servers. The hosting of the CMS by the publisher is indeed a good thing because it will allow systematic and shared optimizations. However, this is not necessarily native. The editor must apply it.

Typo 3: native optimization options

Typo 3 which is an open source solution is in 3rd position. An HTTP Archive ranking is confirming this positioning. Fine cache management and native optimization options explain this performance.

Sites without CMS

Sites without CMS integrate a heterogeneity of technical solutions. It is difficult to draw conclusions. However, the median of the sites is positioned very well compared to other solutions (No Code, WordPress, Drupal, etc.). The low moustache is the lowest compared to all the other solutions. As a result, significant efficiency can be achieved more easily.

Drupal: a professional CMS

Drupal is positioned just after sites without a CMS. The good positioning of this CMS is explained by its less accessible setup and start-up process than WordPress.

Contentful: a headless CMS

Contentful is a “no interface” CMS. It allows you to publish content from other tools. The efficiency gain is present for the publication (because we do not use our usual tools). However, we observe that this CMS is just as efficient as a classic CMS.

WordPress : un CMS simple et très répandu

The WordPress platform is very popular and offers many plugins and themes. But genericity and modularity come at a price. Non-technical users can use this CMS. A potential explosion of plugins and non-configuration of the CMS in terms of performance and efficiency are the counterparts. We see in relation to the low moustache that the CMS can be efficient. However, this requires a lot of work.

Wix, Webflow, SiteCore, Adobe: No Code or equivalent solutions

These solutions offer the user the possibility of creating a website without coding knowledge. The median is high. The low whiskers are also higher than other solutions. It shows that they are heavier solutions.

Conclusion 

From a statistical point of view, CMS solutions do not all have the same efficiency. The initial design, taking into account optimizations, will be essential to achieve good performance (case of Typo 3). We observe that end-to-end control, combined with good practices implementations (Squarespace), also makes it possible to achieve a good efficiency level. In the same way, specializing in a CMS (Ametys) and therefore the options that go with it will allow you to obtain good results.

However, on the other hand, making a very generic and modular CMS (WordPress), even if potentially efficient initially, will bring bloatware. In the same way, the No Code will add a heaviness. It remains to identify the causes of this heaviness. Indeed, it can come from levels of abstraction but also from rendering possibilities (interactivity, animations, etc.) which are easily possible and which lead the user to add more than is necessary. In addition, the use of a “generalist” CMS is also potentially representative of a lack of precision in the need.

For a CMS solution (and more generally any solution), sobriety will not be innate. It will be necessary to apply a set of good practices:

  • Efficient architecture and technology, although if we take current technologies the difference between the solutions is very small, and the impact comes more from the misuse of technologies.
  • Native integrations of optimizations or easily activated by use.
  • Functionality limitation mechanism or in any case sensitizing the user to bloatware.
  • More generally, think about the end-to-end issue, taking into account hosting, and CDN (Content Delivery Network); without going to end-to-end managed solutions, we see that the distribution of systems is not necessarily a good thing.
  • In order to always offer more flexibility to the user, and among other things to allow non-technical people to create sites, it is necessary to integrate optimization solutions natively, which is not at all currently the case.

Do you want to include a CMS in this ranking? Contact us and send us at least 20 links to sites using technology, we will integrate them into the measures and within our ranking!

For our next article, we will go into the finer analysis of WordPress data to observe which parameters and configurations influence environmental performance.

Does a sober site have to be ugly?

Reading Time: 8 minutes

Today, we focus on a question that comes up very often when we address the question of web eco-design or digital sobriety: is an eco-designed site necessarily ugly? Often, the request consists of obtaining examples of “pretty and eco-designed sites” (preferably with a purpose similar to the current project). Specialists in web accessibility have no doubt encountered this type of question frequently. It is already not easy to define what would be, in absolute terms, a “pretty” site. The concept is itself very subjective.

We will therefore proceed differently. We will first compile a list of sites that are sober. There are lists and directories for this, which will be listed later. After compiling the list, we will do a quick analysis to exclude sites that are not as sober as advertised (too much data transfer, too many requests, etc.). Finally, we will use the Greenspector tool to decide between them (by classifying them and identifying those that are more impactful at first sight).

Finally, armed with this list, we will look at what they look like and try to identify design trends, depending on their purposes (an information site does not necessarily look like an e-commerce site or a web agency, for example). Moreover, it will provide an opportunity to keep in mind other aspects of Digital Sobriety, such as accessibility. Having a site that is light and pleasant to look at does not make sense if it is unusable for part of the population.

The purpose here is to offer a list of websites with a lower environmental impact. Everyone is free to find those that seem attractive to them and that correspond to their expectations (in terms of purpose, target, etc.). Thus, this list could be a source of counter-arguments concerning eco-designed sites which would necessarily be ugly. It can also be a way to find sources of inspiration in order to design eco-designed and attractive sites.

Where are the sober sites? 

We have chosen to go through the lists and catalogues of sober sites, with the bonus of other sites crossed elsewhere.

Here are the lists in question:

There are probably others, but this is already a good starting sample. If you have others in mind or want to test your site’s sobriety, do not hesitate to contact us.

A first analysis was carried out with this first list (more than a hundred references in the end). This is mainly based on the Network tab of the DevTools to watch the HTTP requests and the amount of data transferred.

In the end, only about forty sites are left, which are then used for a benchmark with the Greenspector tool.

Sober sites: the verdict by measurement 

The benchmark of the selected sites makes it possible to classify them according to their respective EcoScores (the idea being to obtain an EcoScore as close as possible to 100).

RankingURLEcoscoreEnergy (mAh)Data (Mo)Requests HTTPCarbon Impact (gEqCO2)Water Surface (Litres)Land use (m²)
1https://kuroneko.io/fr/944.240.1420.180.040.46
2https://lesraisonnees.co/944.080.21110.190.040.45
3https://brawcoli.fr/924.080.13110.190.040.45
4https://solar.lowtechmagazine.com/924.350.35170.210.040.48
5https://www.pikselkraft.com/914.350.1130.190.040.48
6https://amap-chelles.net/904.590.3440.20.040.5
7https://primitive.wildandslow.fr/904.10.16110.190.040.45
8https://productfornetzero.com903.990.17140.190.040.44
9https://www.mountain-riders.org/904.310.23190.210.040.48
10https://fairness.coop/894.280.09140.20.040.47
11https://jeudi.am/894.470.15200.220.040.5
12https://www.boavizta.org/894.260.2790.20.040.47
13https://lowtechlab.org/fr874.090.2260.180.040.45
14https://www.gov.uk/874.350.24150.210.040.48
15https://www.treebal.green/874.190.8170.210.040.47
16https://www.boutique-natali.com/864.840.44250.250.040.54
17https://designersethiques.org/854.060.28170.20.040.45
18https://oceanfifty.com/854.630.42140.220.040.51
19https://anelym.fr/844.640.17230.230.040.52
20https://lowimpact.organicbasics.com/eur844.650.74330.260.040.53
21https://www.europeansleeper.eu/en844.330.73310.240.040.49
22http://www.biocoopmontreuil.fr/834.750.53230.240.040.53
23https://www.licoornes.coop/824.370.17280.220.040.49
24https://empreintedigitale.fr/814.261.14260.240.040.48
25https://www.international-alert.org/814.670.83280.250.040.53
26https://www.laboutiquedupartage.fr/814.770.31200.230.040.53
27https://www.light-communication.fr/814.530.19130.210.040.5
28https://dolo.biz/fr/804.811.19150.250.040.53
29https://www.polybion.bio/804.881.02100.240.040.54
30https://zugvoegelfestival.org/794.260.52440.250.040.49
31https://pathtech.coop/774.550.6660.210.040.5
32https://dalkia.fr/764.280.89380.250.040.49
33https://sustainablewebdesign.org/764.881.02430.290.050.56
34https://palaeyewear.com/744.511.19780.320.050.54
35https://themarkup.org/735.271.13140.260.050.58
36https://www.ademe.fr/724.750.64260.250.040.53
37https://theadccawards.ca/715.460.2960.240.050.6
38https://flowty.site/636.910.35210.320.060.77
39https://heylow.world/626.140.35190.290.050.68
40https://becolourful.co.uk/606.150.23150.280.050.68
41https://www.ec-lyon.fr/595.060.81430.290.050.58
42https://www.wholegraindigital.com/588.650.65250.410.080.96
43https://daviddaumer.com/507.830.32130.350.070.86

For each of its websites, measured on an S7 smartphone (Android 8), the measurements were carried out using our Greenspector Benchmark Runner, allowing automated tests to be carried out. The measurements were taken at the end of June 2022.

Scenario details:
– Loading the website
– Page scroll
– Inactivity website in foreground
– Website inactivity in the background

Each measurement is the average of 3 homogeneous measurements (with a low standard deviation). The consumption measured on the given smartphone according to a wifi type network may be different on a laptop PC with a wired network for example. For each of the iterations, the cache is first emptied.

Find out how Greenspector assesses the environmental footprint of a digital service.

By classifying the results (by EcoScore) and looking at the extremes, we already notice two things:

  • Some sites have scores above 80 or even 90. This is a rare occurrence and highlights sites that have made an effort to maintain digital sobriety.
  • Some sites have an abnormally “low” EcoScore. Thus, these are rather light sites, but they are still impactful.

https://daviddaumer.com/ (EcoScore Greenspector 50): few requests on the page, little data transfer. We look with EcoIndex, and the score A is obtained (which is the best possible score). EcoScores drop due to animations that continuously drain the device’s battery. Therefore, by displaying this page, the battery is discharged faster, which increases its wear and predicts the need to replace the battery. It induces heavy environmental impacts, most of which come from the device fabrication. The impact of CSS and JS processing should be limited. Are animations necessary? What are their accessibility and attention capture impacts?

The reasoning is pretty much the same for:

In the end, the examples illustrate the need to consider all factors before claiming that a site is sober or has benefited from eco-design. It is good to make efforts to reduce the number of requests and the amount of data transferred. On the other hand, JS or CSS treatments (more particularly animations) can cancel out a good part of the benefits thus obtained. Especially (and I insist on this point) that these animations potentially have a detrimental effect in terms of capturing attention but above all accessibility. On this subject, I invite you to refer, among other things, to criterion 13.8 of the RGAA (On each web page, is each moving or flashing content controllable by the user?). The most glaring example here is https://heylow.world/ with its very present animations which further impair readability for all users.

Analysis of the ranking of sober sites 

We started with what to avoid to produce an eco-designed website that is visually pleasing without sacrificing usability. Let’s now take a closer look at the sites to extract relevant examples.

We can already consider the list of sites with an EcoScore > 70% as sites on which a sobriety effort has been made. It remains to be seen what can make them attractive and which ones to highlight.

Note: to avoid possible bias, we haven’t included the Greenspector site has not been included (even if its EcoScore is around 72).

E-commerce

The list contains 3 e-commerce sites:

https://lowimpact.organicbasics.com: as of this writing, the standard site is under maintenance. In the “low impact” version, the choice of sobriety is clearly displayed. The focus is on simple shapes (via SVG) and solid colours. On the other hand, it is regrettable that this version is not the default version of the site. This significantly undermines the impact of this approach.

https://palaeyewear.com: the homepage is rather light and pleasant. It includes the classic elements for such a site: a video (integrated soberly), some products, consumer opinions, some news, an impact report, etc. Several good efficiency practices are not respected but this page is doing better than most other e-commerce sites. Everything gets complicated when you access a product sheet. Here, more than 100 requests and several MB of data are transferred. The eco-design effort should therefore have been pushed further, in particular by basing itself on a user journey (navigation and purchase of a product) rather than only on the home page.

https://www.boutique-natali.com: On this page, we also find several elements specific to this type of site (current promotions, reinsurance elements, products highlighted, etc.) in addition to highlighting the eco-design approach implemented. The same sobriety can be found on the product sheets. Admittedly, some types of products sold online probably require more images (for example in the field of fashion or cosmetics) but in my opinion, this is a good basis for thinking about designing an online store. light and pleasant to use.

Magazines and online press

https://themarkup.org is a sober and elegant site at the same time, which is all the more remarkable for the online press. These sites are usually weighed down by advertising and trackers, among other things, which is not the case here. An important site to keep in mind is an example of an eco-designed online press site. Be careful, however, the lightness of this site compared to other similar sites is partly due to choices of an economic model. Once again, this highlights the role that all the actors of a project have to play on the subject of digital sobriety.

https://solar.lowtechmagazine.com: This is probably one of the best-known examples. The radical choice of environmental impact reduction is clearly displayed here. This will not necessarily be unanimous (notably because of dithering).

We find a similar logic on the Designers Ethiques site (layout similar to an old-fashioned paper newspaper for a more sober result) or even (for the structure) on that of Pikselkraft. The Low-tech Lab site, if it takes up certain elements, goes to a page richer in content and with a less rigid structure. The home page then seems more attractive and the content easier to identify.

Others sites 

https://lesraisonnees.co: a scroll-based one-page site. An agency site with classic content but produced in a very sober and efficient way, very clear. A very good example.

https://brawcoli.fr: the classic elements are grouped together on a single page, putting well before what this restaurant offers.

https://primitive.wildandslow.fr: we find in the list of many agency sites or freelancers specialising in the creation of sober sites (which is logical and even reassuring). The idea is generally to present everything on a single page with solid colours and few images (all optimised). Primitive by Wild&Slow is quite representative while standing out, among other things, for areas with non-linear contours. In other cases, the emphasis is on geometric shapes rather than more complex images.

https://www.treebal.green is a much richer variant graphically and for all that quite sober.

https://www.mountain-riders.org is a good example of using the principles seen above with a very contrasting graphic charter for a clean and attractive final rendering.

Although it may seem less attractive than others, https://www.gov.uk shines with its lightness and accessibility. Great efforts have been made here at the level of information architecture. It is in any case interesting to have here an example of accessible and sober public service.

Even if continuous and ubiquitous animations are to be avoided, some lightweight sites use them sparingly:

In any case, it is advisable to keep in mind the accessibility as well as the fact that this type of addition is only cosmetic. For some sites like https://dolo.biz/, the attractiveness of the home page relies heavily on the animations but everything remains efficient and rather pleasant (even if it will not necessarily be practical for everyone’s navigation, in particular, the keyboard).

In a totally subjective way, I also retain https://zugvoegelfestival.org for the choice of colours and navigation on the home page. It is just unfortunate that the various navigation elements on the site are not available (at least by click) upon arrival on the site.

And a last special mention for https://sustainablewebdesign.org which uses geometric shapes, and bright colours and emphasises accessibility while being a mine of information on web eco-design.

Conclusion 

The ranking presented here should give you a better idea of what is possible with a sober website. This list is expected to grow over time and serve as an inspiration for those who wish to create sober websites.

One must consider accessibility when using a site and dig as deep as necessary into the notion of sobriety if the feeling one can get is partly subjective.

How to audit Android mobile application requests?  

Reading Time: 5 minutes

Introduction

Request Map Generator is a tool available through webpagetest.org to display a visualization of the different domain names called when loading a web page. The objectives are multiple:

  • Identify the third-party services used on the page
  • Identify which components call these third-party services
  • Quantify their use and impact to challenge them
  • Identify the main action levers

For example, on this RequestMap, we see that the integration of Twitter and Linkedin is responsible for downloading 71 KB of JavaScript. We also observe the chain of queries leading to Google.

The problem is that the tool is made available to audit websites. What about mobile apps? Our approach to generating the request map for mobile applications is simple.

HAR mapper

RequestMap developer Simon Hearne also provides the HAR mapper tool which generates the same request maps from HAR files. HAR are JSON files used to record traffic captured by various web analysis tools such as DevTools. Thus, rather than requesting an entire test of the webpagetest suite, you can very well choose to save an HTTP Archive file (.har) on your own PC. This allows us to build more precise RequestMaps, which go beyond the home page while being more numerically sober.

The other advantage is that we are able to analyze mobile applications using an SSL proxy, provided that the application authorizes a certain network configuration (see Authorizing access to Charles’ certificate by the application ).

CharlesProxy, the developer’s Swiss army knife

A proxy is a server that acts as an intermediary between the server and the client. The latter sends the requests to the proxy which is then responsible for communicating with the server. This allows the proxy to observe the different requests that are exchanged. In addition, if the client accepts the CA certificate from the proxy which will thus act as a Certificate Authority, the proxy will be able to decrypt HTTPS requests to inspect their content.

Charles Proxy is a proxy server whose use is oriented for mobile developers. In addition, to act as an SSL Proxy, it offers to rewrite on the fly the headers (or even the content!) of the requests exchanged. It allows you to test the stability of an application with network conditions, or server problems (throttling, repeated requests, no-cache, etc.). In our case, what interests us the most is that Charles makes it possible to save the client-server exchanges recorded in the form of a .har file.

We suggest using Charles Proxy because it is an easy-to-use and fairly complete tool, but be aware that other proxy servers can be used for this use case. As alternatives, there is in particular mitmproxy, an open-source command-line tool or HTTP toolkit very easy to use in a paid version.

Install and configure Charles

Download Charles and install it. When Charles is launched, a proxy server is automatically configured and requests are recorded.

By default Charles only enables SSL proxying for a restricted list of domain names. To change this behaviour, go to Proxy > SSL Proxying settings. Check that SSL proxying is enabled and add an * entry to the Include table:

Configure smartphone 

It now remains to configure our Android smartphone to connect to Charles. The phone must be in the same local network as the PC Charles is running on. In the Wi-Fi settings, in the network configuration, set the Proxy as “Manual”. Enter the IP address of the PC on which Charles is running and define Charles’ port (8888 by default).

As soon as the smartphone communicates with the network, Charles will ask us to accept or refuse the proxy connection.

By accepting, Charles should start intercepting the network exchanges of the applications. However, the requests are not done correctly. Indeed, we still have to install Charles’ certificate on the phone.

Install Charles Certificate

Open the smartphone browser, and visit chls.pro/ssl. The download of the certificate is done automatically. If the file is open, Android offers to install it, provided that a PIN code locks the phone.

Attention from Android 11, the procedure is made more complicated. (Visit Charles’ help to install the certificate on other systems).

It is now possible for us to forward the requests issued by the Chrome process but not those of other applications. Indeed, for security reasons by default Android applications only accept “system” certificates (This is not the case for iOS which also offers a Charles application on the App Store).

Allow access to Charles’ certificate by an Android application 

There are three possible scenarios:: 

  1. You have the source code of the application. 

    In this case, it is easy for you to authorize the use of “user” CA certificates. To do this, add a res/xml/network_security_config.xml file defining the network configuration rules of the application:
<?xml version="1.0" encoding="utf-8"?> 

<network-security-config> 

<base-config cleartextTrafficPermitted="true"> 

<trust-anchors> 

<certificates src="system" /> 

<certificates src="user" overridePins="true" /> 

</trust-anchors> 

</base-config> 

</network-security-config> 

You must also specify its path in the AndroidManifest.xml: 

<?xml version="1.0" encoding="utf-8"?> 

<manifest ... > 

<application android:networkSecurityConfig="@xml/network_security_config" ... > 

... 

</application> 

</manifest> 

Remember to keep this configuration only for the debug application, because it can cause MAJOR security problems. See the official documentation for more details.

  1. You only have the application’s APK. 

In this case, you will have to decompile the application, use the same method as in 2. and recompile the application and sign the resulting apk. For this, some tools (apk-mitm or patch-apk) can help you in the process. The method is however not guaranteed to work as the app may implement apk signature verification.

Attention! In France, the decompilation of software is strictly governed by the law which defines in which cases it is legal. If in doubt, be sure to get permission from the publisher first!

  1. The testing smartphone is rooted 

Dans ce cas, vous pouvez installer le certificat dans les certificats root du téléphone. 

Once the certificate can be used by the application, we can inspect the exchanges between the smartphone and the server. To generate a .har file, select all the requests, right-click in Charles on the network exchanges > Export Session… and export in HAR.

Import the file into HAR Mapper, and we have our Request Map!

Metaverse and Digital Sobriety

Reading Time: 5 minutes

The concept of the Metaverse isn’t new, and some may even remember Second Life, some consider it to be its first manifestation. The idea is to offer a virtual environment via what is now called XR (eXtended Reality), a mixture of augmented reality (a bit like Pokemon Go) and virtual reality (the older ones will think of the film The Lawnmower Man but we will prefer the example of Oculus Quest).

In October 2021, Meta (formerly called Facebook) announced that it was going all out on the subject of the Metaverse. A huge amount of investment is needed to create 10,000 jobs and train those who will work in this field. Many large companies have followed suit so as not to miss out.

The ultimate goal would be to provide users with a potentially 3D immersive environment where they could find their favourite brands and interact with whoever they want without leaving their homes.

Coupled with cryptocurrencies and NFTs, the metaverse would even be one of the pillars of Web3.

Like connected glasses, this is a digital Arlesian, and we are entitled to wonder if this new attempt will be successful this time. Except that the real question is whether the metaverse is compatible with current issues related to digital, which we find in particular through Responsible Digital.

Metaverse and Digital Sobriety

By taking up the main challenges of Responsible Digital, let’s see what we can expect from the metaverse. 

Accessibility 

While more than 96% of websites have at least one accessibility error, the accessibility of the web as it exists today remains very problematic. Likewise, remember that access to the web remains complicated for a large part of the world’s population, whether due to an outdated device, an insufficient internet connection or simply insufficient skills to be able to fully use the digital tools. Including these three issues, Digital illiteracy affects 17% of the French population.

In such conditions, it’s a safe bet that the metaverse will not come to fix things. In the metaverse, those who are unable to access the web in satisfactory conditions today will probably be left out. Not to mention that the prerequisites in terms of the device power and internet connection may be much higher (but we will come back to this later).

Security 

Digital illiteracy has a substantial impact on security: if individuals are not sufficiently prepared to use digital tools, they are exposed to risks they cannot control. There is no doubt that the metaverse will come with new attack opportunities. We can already imagine to what extent such an immersive universe and today also linked to major brands can offer new vectors for phishing. It is also to be feared that, in order not to interfere with the immersion or the comfort of the users, safety takes a back seat.

Capturing (and manipulation) attention

Attention capture (see French CNUM report in PDF) consists of setting up design mechanisms (scatological mechanisms or dark patterns) to retain the user’s attention for as long as possible. In the metaverse, one can imagine that this will only get worse, one of the objectives being immersion. We are exposed to more than 5000 advertising stimuli each day, especially via the web. Based on the list of companies contributing to the metaverse, this is unlikely to succeed.

How, under these conditions, will our filter bubble evolve? Is there not a risk of seeing the influence of certain digital players on the political context increase? Should we be worried about Meta taking over the subject of the metaverse (in short: yes)?

Here are just a few questions among many others (on the moderation of this new shared space, the rights to the content that will be (re-)produced there, etc.).

Digital Sobriety

It is interesting to consider the metaverse from the angle of environmental impacts.

You will quite easily find experts extolling the merits of the metaverse to unclog the roads, project yourself into spacious offices at a lower cost, perform surgeries from the other side of the world, etc.

It’s always thrilling to hope that someone will come up with a product that solves a whole host of issues we didn’t even know existed. In this specific case, I would be in favour of the Design is the Problem approach. Nathan Shedroff explains how to rethink design in order to come up with truly sustainable solutions. He takes the example of the Segway PT, a personal, electric and removable/repairable transport device. Presented in this way, one would think that it would be a good idea for the planet. Except that the real concern of this device is that it does not meet a real user need. Indeed, public transport, cycling and walking can ideally replace it, with a much lower impact and financial cost. Any resemblance to electric scooters is purely coincidental (or not).

The metaverse poses the same problem in its very concept: it seeks to meet a myriad of diverse and varied needs, even though less impactful and costly alternatives exist. Only its technical and innovative varnish promotes its adoption and leads large companies to blindly embark on it.

In order to assess the environmental impact of the metaverse, several elements must be considered.

  • On the one hand, generating and displaying an immersive virtual environment is very resource-intensive. Below 90 fps, the user is exposed to nausea and dizziness. In addition, in recent years, everyone has been able to discover increasingly magnificent 3D virtual environments (largely through video games). It, therefore, seems essential to align with these types of visuals, which will be costly both for their products and for their display.
  • On the other hand, the use of the metaverse (in particular taking into account the elements indicated in the previous point) will probably require better user equipment (even new user equipment) as well as an internet connection with a very high speed (would not be -what to display a virtual environment while holding the 90 fps). Knowing that very logically (and this is also what we have clearly seen with video games), renderings and attendance should (if all goes well for the metaverse) increase over time, encouraging the race to renew equipment.

Even as initiatives are multiplying to reduce the environmental footprint of digital technology, the arrival of the metaverse, therefore, represents a major risk.

Conclusion 

Efforts to extend Responsible Digital principles to the web are increasingly intense, and the work is already colossal. The arrival of Web3 and more particularly of the metaverse risks making these principles all the more essential but also more difficult to enforce. It seems (for once) easier to generate jobs and spend crazy sums for a concept whose usefulness remains to be proven than to work to make the web less impactful and more accessible for all.

The metaverse may indeed be designed with an eye to efficiency, or may even follow certain principles of Responsible Digital (though I seriously doubt this). In any case, the very nature of the project suggests that sobriety is not considered. It is all the more regrettable as the Digital Responsible itself contains the elements and principles that would help the achievement and adoption of the metaverse. However, the priorities seem to be different, and we can only regret to see once again the means of concentrating on something that will probably not contribute to making the web better. In the end, the metaverse seems to go against the efforts needed to mitigate climate change.