Optimizing the smartphones energy to reduce the impact of digital technology and avoid the depletion of natural resources

Reading Time: 7 minutes

This article was written in 2021. Since then, our research has led us to revise the environmental impacts mentioned here. For example, we now consider the manufacturing footprint of a smartphone to be 52 kg CO2e. However, the approach presented remains entirely valid.

Introduction

The lifespan of a smartphone averages 33 months. Knowing that a smartphone contains more than 60 materials, including rare earth elements and that its carbon footprint is between 27 and 38 kg eqCO2, the current rate of replacement of smartphones is too fast.

Different reasons can explain this rate of renewal. Loss of autonomy and battery problems are the main reasons (smartphone: one in three changes due to the battery). Increasing the capacity of the batteries is a solution that seems interesting but it would not solve the problem. Indeed, the data exchanged continues to increase and this has an impact on the power of smartphones. Websites are still just as heavy as before, even becoming heavier and heavier… So is this an unsolvable problem? What is the link between the autonomy that we experience in a personal capacity and this observation on the impact of digital technology?

Methodology

We started our analysis through web consumption. Indeed, mobile users spend an average of 4.2 hours per day browsing the web.

In a previous study on the impact of Android web browsers, we measured the consumption of 7 different websites on several web browsing applications from a mid-range smartphone, a Samsung Galaxy S7. This allows us to project this consumption onto global consumption and to apply optimization assumptions to identify room for maneuver.

Even if the uncertainties are high (diversity of mobile, diversity of use, etc.), this action allows us to identify the room for maneuver to improve the life cycle of smartphones. The choice of the Galaxy S7 makes it possible to have a smartphone close (within 1 year) to the average age of global smartphones (18 months).

What is the annual consumption of web browsing on mobile?

Here are our initial assumptions:

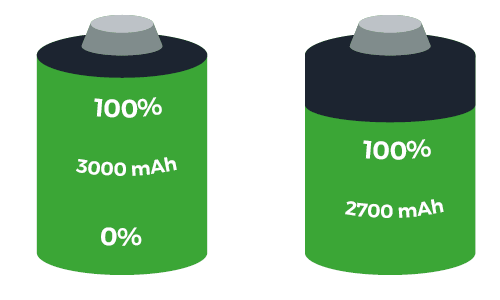
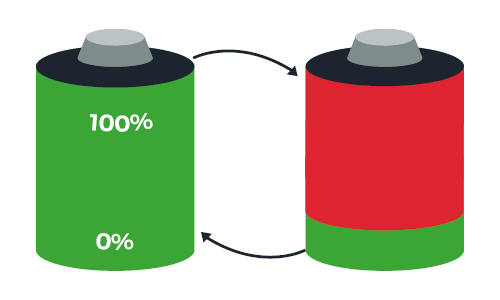
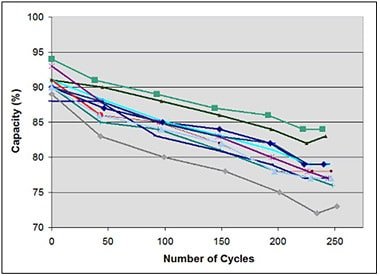
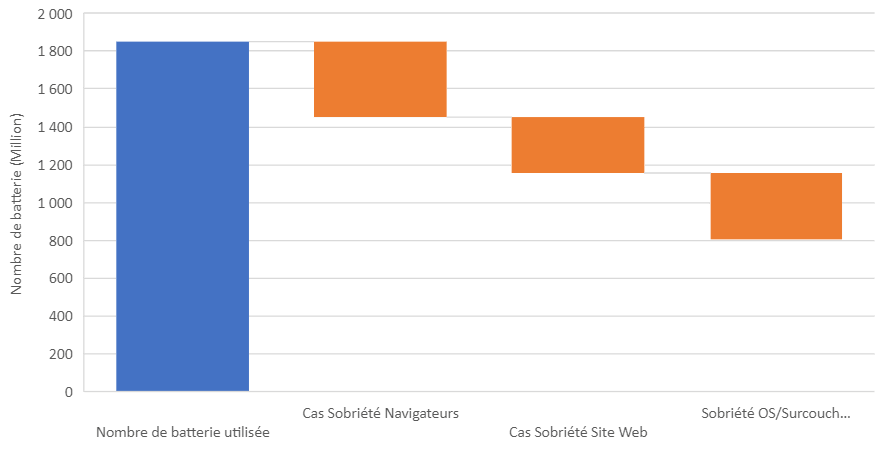
The estimated annual consumption of smartphones is 2,774 billion ampere-hours. Not very tangible? Considering that an average 3000mAh battery can go through 500 full charge/discharge cycles before it starts to be unusable and that 1,850 million batteries are used each year to browse the web. Does this figure seem exaggerated to you? There are 5.66 billion smartphones in the world, this would correspond to a problem that would affect 36% of the global fleet each year. If we consider that 39% of users will change their smartphone for battery reasons and only 26% of users will replace the batteries if they wear out, we get the figure of 1,200 million batteries, which corroborates our figures. Not inconsistent at the end, when you look at the phone and battery renewal cycles.

Would reducing the consumption of browsers have an impact?

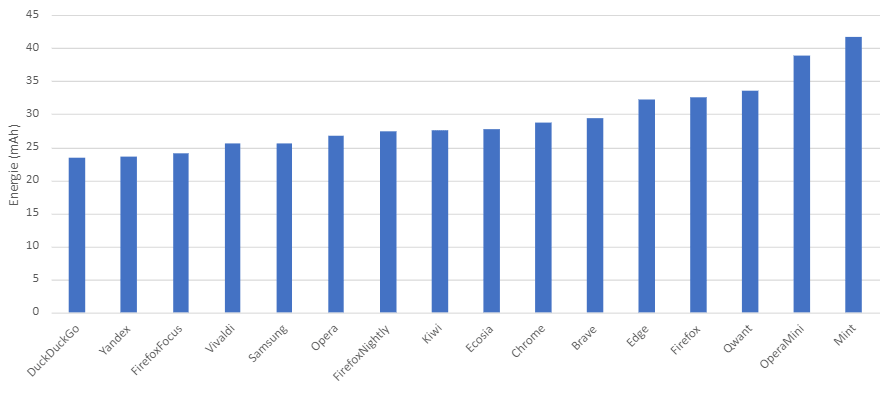
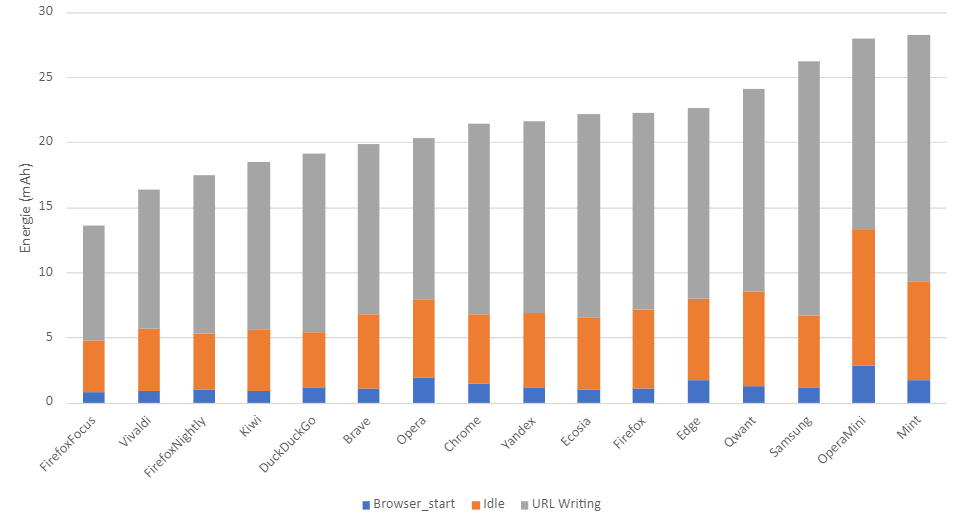
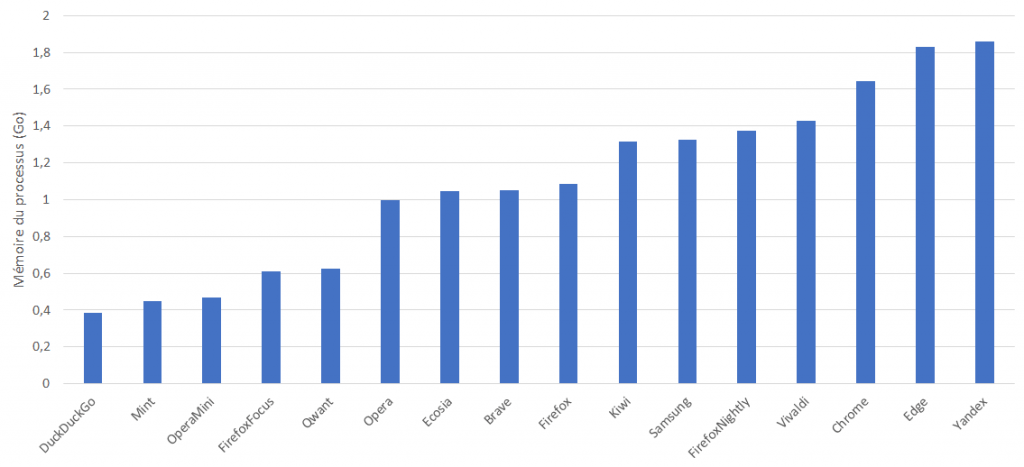
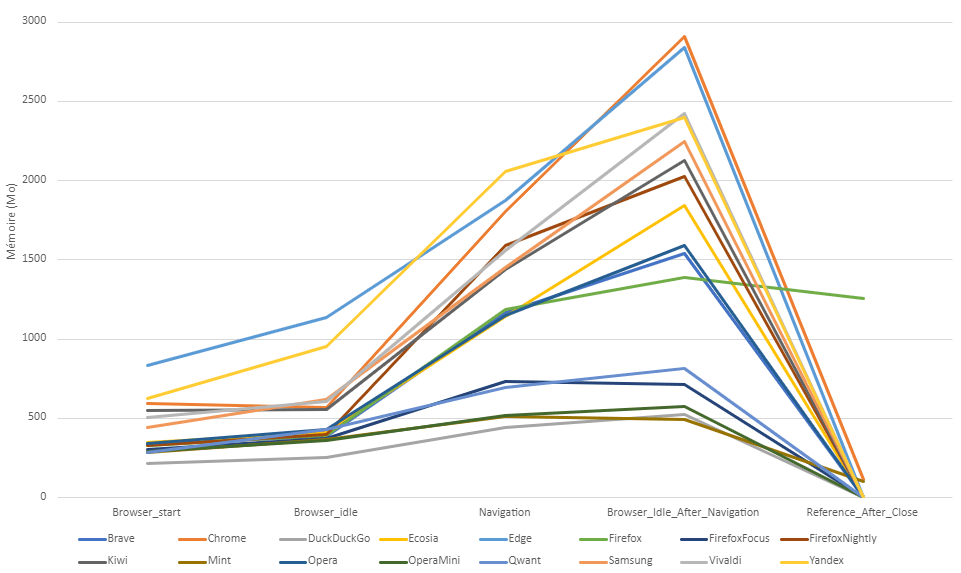
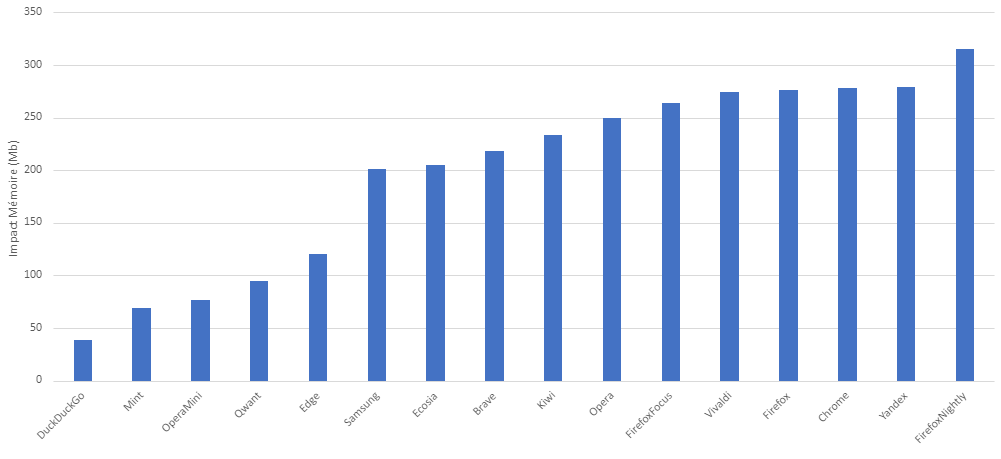
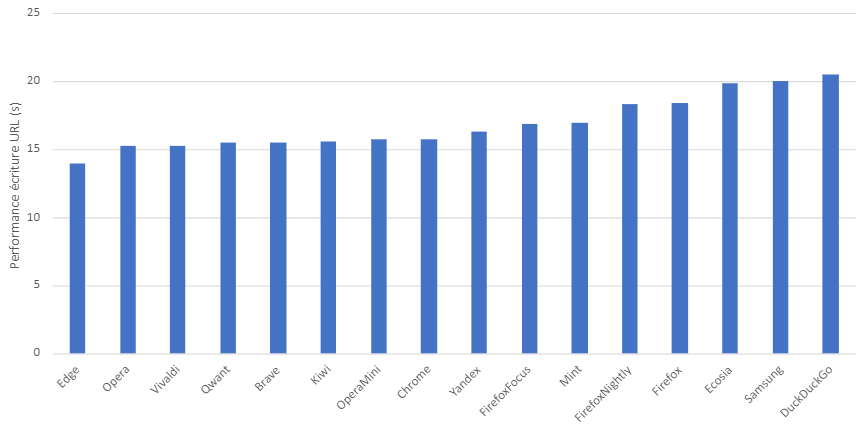
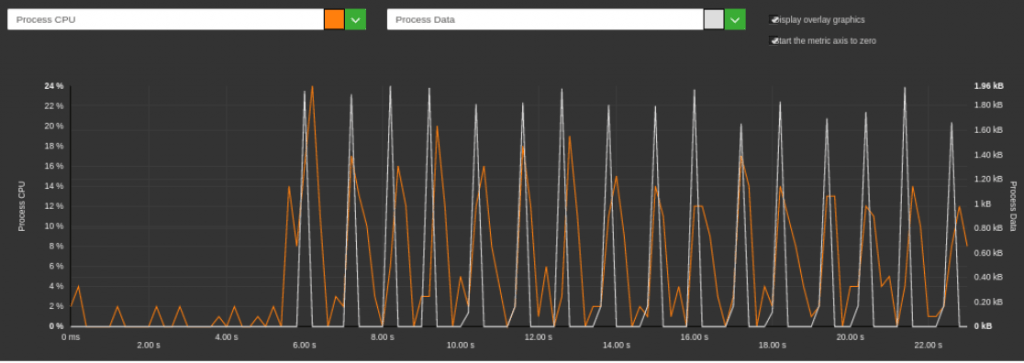
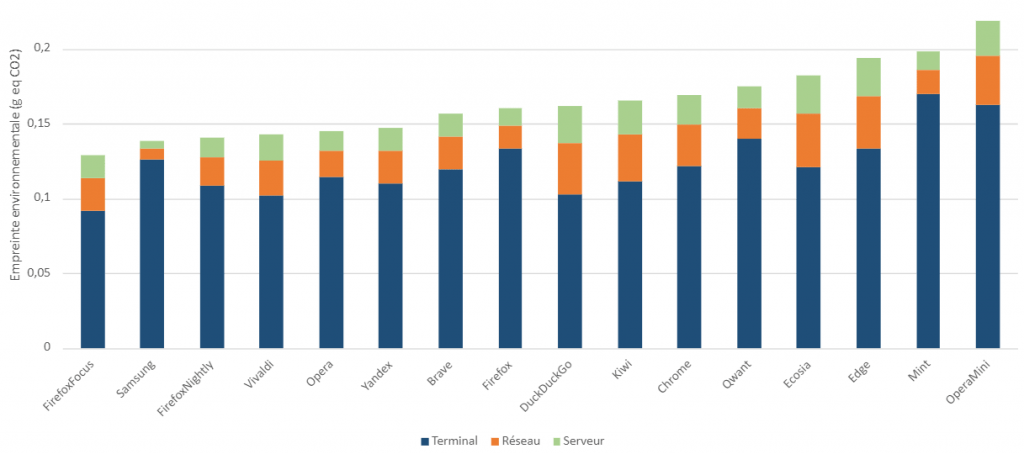
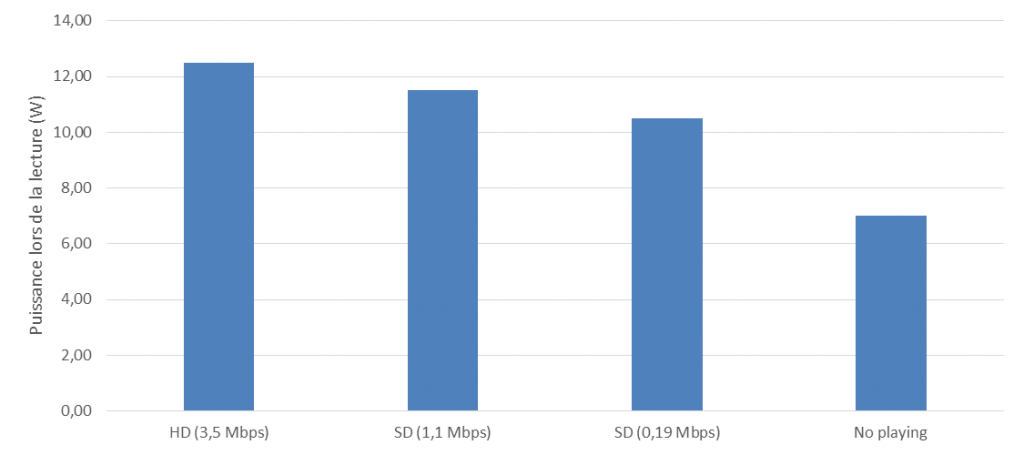
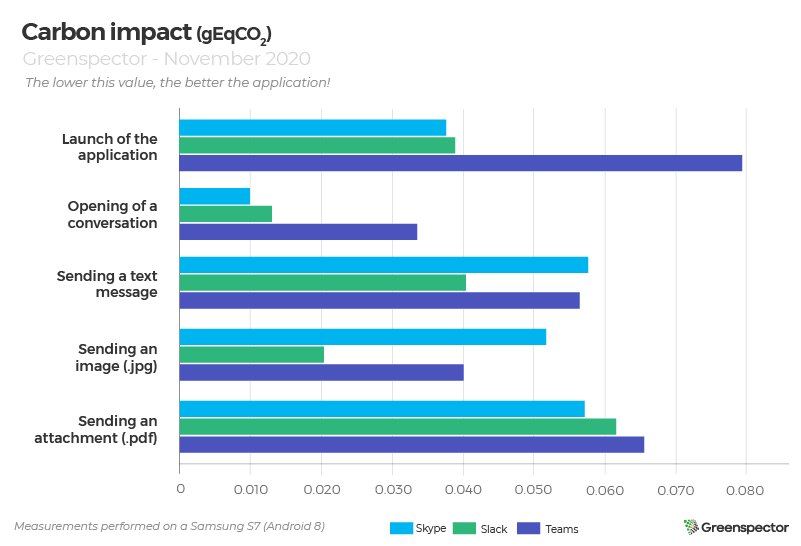
Web browsers are important engines in the consumption of the web. Our measurements show significant differences in power consumption between browsers. These differences are explained by heterogeneous implementations and performance. In the following graph, the consumption of browsing on 7 sites, including the launch of the browser, the use of features such as writing URLs, and the navigation itself is visualized.

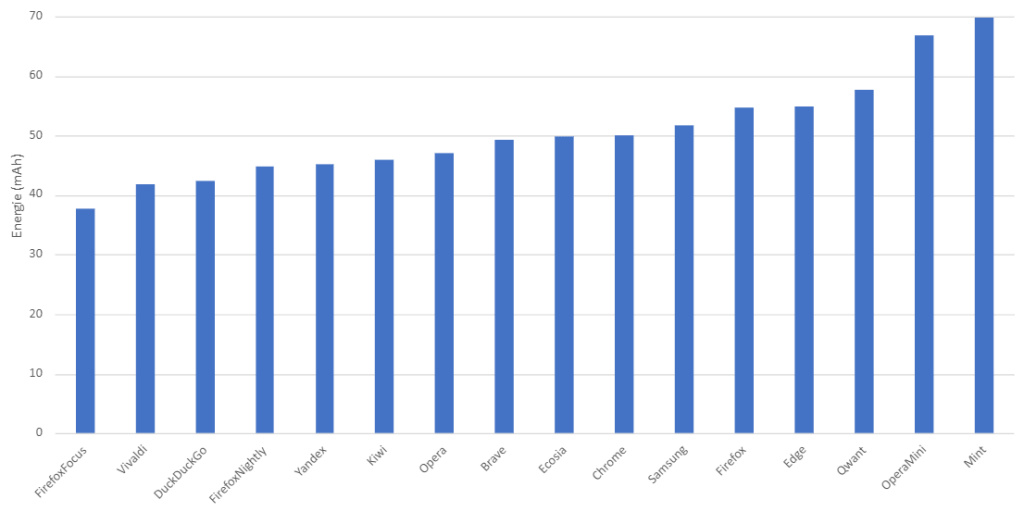
We start with a hypothesis of publishers optimizing browsers. By considering a hypothetical consumption of all browsers equal to that of the soberest (Firefox Focus), we obtain a reduction in the total annual consumption which makes it possible, with the same assumptions on the lifespan, to save 400 million batteries per year. Knowing that 1,500 million smartphones are sold per year, taking the same assumptions as before on replacement and repair rates, this would save 7% of the fleet of phones sold each year.

Would reducing the consumption of sites have an impact?

It is also possible that the websites are much soberer. We have assumed a consumption close to that of Wikipedia. From our point of view, having audited and measured many sites is possible but by taking important actions: optimization of functionalities, reduction of advertising and tracking, technical optimization …  

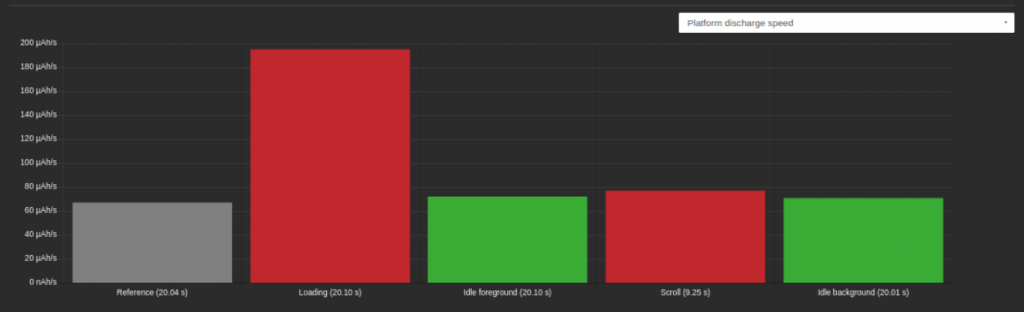
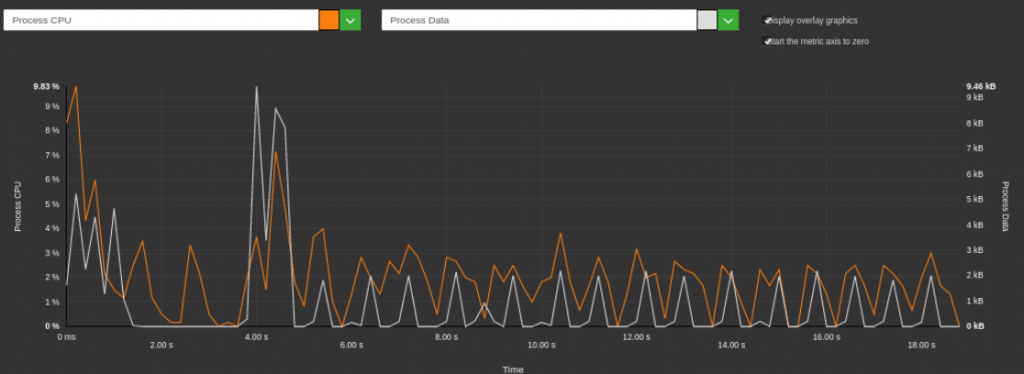
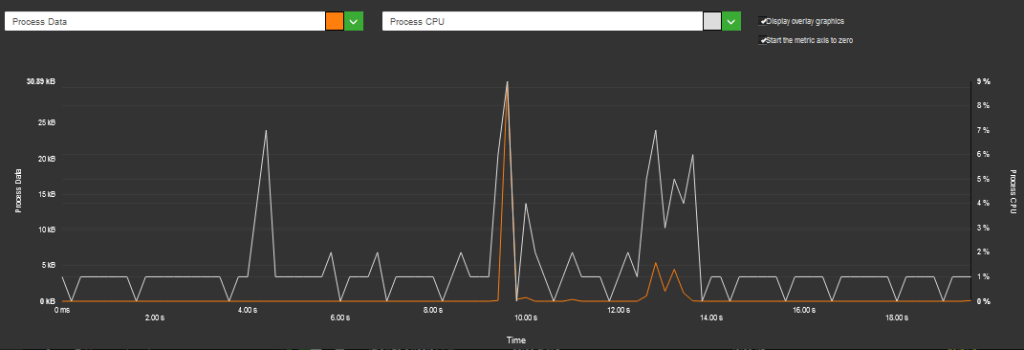
Here is an example of the representation of the energy consumption of the Team website. We see that the load will consume up to 3 times the reference consumption. The optimization margin is enormous in this precise case, knowing that many sites arrive at a factor of less than x2.

In the case of sober websites, by taking the same assumptions and calculation methods as for the sobriety of browsers, we could save 294 million batteries per year, or reduce the renewal of the fleet annually by 5%.

Is reducing the consumption of the OS possible and would have an impact? 

The question about the impact of hardware and OS often arises. To take this impact into account, we have several data at our disposal. An important piece of data is the benchmark consumption of the smartphone. It is the consumption of the hardware and the OS. For the Galaxy S7, this consumption is 50µAh / s.

By taking the same assumptions as those taken to calculate the total consumption (2,774 billion Ah), the annual consumption attributed to the material and OS share would be 1,268 billion ampere-hours or 45% of the total consumption. 

So is this the glass tray of optimization? Not really because there is a lot of space for optimization: Android itself for example. We have carried out an experiment that shows that it is possible to significantly reduce the consumption of Android functionalities. The builders’ overlays are also a way to reduce consumption.

Based on our experience, we estimate that a 5% reduction in consumption is totally possible. This would save 350 million batteries or 6% of the fleet.

What environmental gains can we hope for?

Applying digital sobriety at different levels would reduce the global number of used batteries per year by more than half. 

Even on the assumption that users do not systematically renew their smartphones for reasons of loss of autonomy or only replace their used battery, the annual smartphone renewal could be reduced by 17%.

In the best-case scenario, assuming that most users will replace their batteries, the potential savings would be 2 million TCO2eq. But the gains could be much greater if you consider that replacement practices are not changing fast enough and that users are changing smartphones rather than batteries: 47 million TeqCO2.

By being optimistic about an increase in battery capacity, no increase in the impact of software, and an unincreased impact of the larger batteries, the number of batteries used could be halved, in the same way, the environmental impact by two. But is it still enough? Rather go for an increase in the capacity of the batteries and a decrease in energy consumption and then obtain a gain of 4 on the impact by multiplying the capacity by two! 

Energy on a smartphone, small drops but a huge impact in the end

We are under the impression that the energy is unlimited, we just need to charge our smartphone. However, even if the energy was unlimited and without impact, the batteries are consumables. The more we use them, the more we wear them out, and the more we use non-renewable resources such as rare earth elements, not to mention other environmental, social, and geopolitical costs. We can expect technological developments to improve capacity and improve battery replaceability, but the savings are huge. Replacing the batteries is not the miracle solution because even if we extend the life of the smartphone, the battery must be thrown away or recycled, and recycling of Lithium is not yet assured (P.57). Gigantic because we use our smartphones for many hours. Gigantic because we are billions of users.

The exercise that we have carried out is totally forward-looking; all browser editors should integrate sobriety, all sites be eco-designed. It does show, however, that optimizing the energy of apps and websites makes sense in the digital environmental footprint. Some people seeing only the energy of recharging neglect this aspect. However, as we can see in this projection, the environmental gains are much greater.

This figure is significant and at the same time low: 47 million Teq CO2 for the world, this is 6% of the French footprint. However, CO2 is not the only metric to look at. Another significant problem, for example, the shortage of lithium in 2025 but also water.

To all this, we should add issues associated with new practices and new materials:

… the sector is constantly evolving to respond to challenges that are sometimes commercial, sometimes economic, sometimes regulatory. The battery example illustrates this trend well. While we had become familiar with the “classic” lithium-ion batteries which mainly contain lithium, carbon, fluorine, phosphorus, cobalt, manganese, and aluminum, new models have appeared, first lithium-ion-polymer batteries then lithium-metal-polymer batteries. The possible metal procession, already substantial, has therefore been considerably increased; with iron, vanadium, manganese, nickel but also rare earth elements (cerium, lanthanum, neodymium, and praseodymium).

SystExt Association (Extractive Systems and Environments)  https://www.systext.org/node/968 

Taking into account the environmental, social, and geopolitical issues involved with batteries, dividing the number of batteries used by 2 is really not enough! This means that the optimization wells should now be activated. And if we want to achieve ambitious goals, all players, manufacturers, OS and browser editors, digital players … have their share of the work. Continue to incant magical reductions resulting from technologies, to say that energy should not be optimized, to transfer the fault to other actors or other sectors, to explain that focusing on uses is a mistake … that shift the problem. We all need to roll up our sleeves and solve the problem now!


Which video conferencing mobile application to reduce your impact? 2021 Edition

Reading Time: 6 minutes

We invite you to consult the 2022 edition. Read the article.

For this new 2021 edition of our ranking, we have completed our 2020 study with new solutions and even extended it to web solutions. The objective of these measures is to see how the solutions stand in terms of environmental impact (Carbon) with each other on common user scenarios but also to provide benchmarks on our uses of videoconferencing.

So this time we compared 19 mobile applications: Big Blue Button, BlueJeans, Circuit by Unify, Cisco Webex Meetings, ClickMeeting, Go To Meeting, Discord, Google Meet, Infomaniak kMeet, Jitsi, Pexip, Rainbow, Skype, StarLeaf, Microsoft Teams, Tixeo, WhereBy, Zoho Meeting et Zoom.

For each of its applications, measured on an S7 smartphone (Android 8), the following three scenarios were carried out through our Greenspector Test Runner, allowing manual tests to be carried out over a period of 1 minute in one-to-one:

  • Audio conference only
  • Audio + video conference (camera activated on each side)
  • Audio and screen sharing conference

Learn more about the methodology.

Projected carbon impact ranking of videoconferencing applications (gEqCO2)

Here are the impact averages for the three scenarios:

User scenario / Year1 mn of audio conference1 min of audio + video conference1 min of audio + screen sharing conference
20210.155 gEqCO20.403 gEqCO20.163 gEqCO2

1,38 meters made in a light vehicle3,6 meters made in a light vehicle1,46 meters made in a light vehicle
20200.102 gEqCO20.289 gEqCO20.121 gEqCO2

On average, one minute of audio-video conferencing impacts 61% less (or 2.6 times less) than with activated cameras and 5% less than when sharing a screen. According to our recent study on the impact of streaming a MyCanal video, on average, one hour of video streaming corresponds to an impact of 14g eqCO2. Or 0.233g eqCO2 per minute, or 1.7 less impacting than a minute of video conferencing in audio and camera but 1.5 times more than a minute of video conferencing in audio-only.

The Top 3 for one minute of videoconferencing on average: Google Meet (0.164 gEqCO2), Tixeo (0.166 gEqCO2), and Microsoft Teams (0.167 gEqCO2). Google Meet, first in this ranking on the carbon impact side, has an impact 2.5 times less than, Discord, the last app in this ranking. The average of this ranking is 0.237 gEqCO2, only 7 solutions are above.

The main part of the Carbon impacts is situated on the user device part (72%), followed by the Network part (16%) and finally the Server part (12%).

Here are the three least impacting applications in terms of Carbon depending on the scenario:

Audio (Top 3)Audio + camera (Top 3)Audio + screensharing (Top 3)
Microsoft TeamsBig Blue Buttons (via Chrome)Microsoft Teams
Google MeetClick MeetingGo To Meeting
Infomaniak MeetGoogle MeetTixeo

Energy Consumption of Video Conferencing Applications (mAh)

Here are the energy consumption averages for the three scenarios:

User scenario/year1 mn of audio conference1 mn of audio + video conference1 mn of audio + screen-sharing conference
20219.84 mAh16.26 mAh9.98 mAh
20206.6 mAh14.24 mAh7.50 mAh

On average, one minute of audio-video conferencing consumes 39% less (or 1.6 times less) energy than with activated cameras and 1.5% less than when sharing a screen.

The Top 3 (all scenarios combined) in energy consumption: Microsoft Teams (27.27 mAh), Go To Meeting (28.79 mAh), and Google Meet (30.11 mAh). Microsoft Teams first in this ranking in terms of energy consumption consumes 2 times less than the last in this ranking: Discord.

Here are the three most energy efficient applications depending on the scenario:

Audio (Top 3)Audio + camera (Top 3)Audio + screen-sharing (Top 3)
Microsoft TeamsZoho MeetingMicrosoft Teams
TixeoZoomTixeo
Infomaniak kMeetStarLeafGo To Meeting

Exchanged data from videoconferencing applications (MB)

Here are the averages of the data exchanged for the three scenarios:

User scenario/year1mn of audio conference1 mn of audio + video conference1 mn of audio + screen-sharing conference
20211.15 Mo16.01 Mo1.87 Mo
20200.806 Mo8.44 Mo1.43 Mo

It is on the consumption of data that the gaps are widening between tools and uses.

On average, one minute of audio conferencing consumes 92% less (or 14 times less) data exchanged than with activated cameras and 38% less than when sharing a screen.

The Top 3 (all scenarios combined) in energy consumption: Big Blue Buttons (4.49 MB), Tixeo (6.21 MB), and Google Meet (6.30 MB). Big Blue Buttons (via Chrome) first in this ranking for exchanged data consumes 10 times less than the last in this ranking: Discord.

Here are the three applications that consume the least amount of data according to the scenario:

Audio (Top 3)Audio + camera (Top 3)Audio + screensharing (Top 3)
Cisco Webex MeetingsBig Blue ButtonsCisco Webex Meetings
Blue JeansTixeoInfomaniak kMeet
Google MeetGoogle MeetGoogle Meet

And for our daily use of videoconferencing:

Just like our first study, we advise you during your online conferences to:

Favour audio only during your meetings: the video stream (camera) will tend to consume a lot more. A mobile session is on average 2.6 times more impactful for the environment in terms of carbon impact when the video is added to the audio. Adding screen sharing is not penalizing if it is useful.

Optimize the settings (when possible): adopt the dark theme, activate the data or energy-saving settings (in the case of LED, AMOLED type screens).

Prefer videoconferencing over travelling by car!

  • Comparison for 2 people who talk to each other in a 3-hour session in audio and active cameras (0.403 gEqCO2 per minute) while one of the two has made 20 km (112 gEqCO2 / km in France) round trip for a face to face.
  • By videoconference: 180 * 0.403 * 2 = 145 gEqCO2
  • By car: 112 * 20 = 2.4 kg EqCO2 or approximately 16x more impact.

Measured versions: Big Blue Button via Chrome (87.0.4280.101), BlueJeans (45.0.2516), Circuit by Unify (1.2.5102), Cisco Webex Meetings (41.2.1), ClickMeeting (4.4.6), Go To Meeting (4.6.0.7), Discord (62.5), Google Meet (2021.01.24.355466926), Infomaniak kMeet (2.2), Jitsi (20.6.2), Pexip (3.4.6), Rainbow (1.84.1), Skype (8.68.0.97), StarLeaf (4.4.29), Microsoft Teams (1416.1.0.0.2021020402), Tixeo (16.0.1.2), WhereBy (2.3.0), Zoho Meeting (2.1.4) et Zoom (5.5.2.1328).

For each of its applications, measured on an S7 smartphone (Android 8), the user scenarios were carried out through our Greenspector Test Runner, allowing manual tests to be carried out.

Once the application is downloaded and installed, we run our measurements on the basic and original settings of the application. No modification is made (even if certain options make it possible to reduce the consumption of energy or resources: data saving mode, dark theme, etc. However, we encourage you to check the settings of your favourite application to optimize it. impact.

Each measurement is the average of 5 homogeneous measurements (with a low standard deviation). The consumption measured on the given smartphone according to a Wi-Fi type network can be different on a laptop PC with a wired network for example. For each of the iterations, the cache is first emptied.

To assess the French impacts of infrastructures (datacenter, network) in the carbon projection calculations, we relied on a Greenspector methodology based on real data measured from the volume of data exchanged. This evaluation methodology takes into account the consumption of resources and energy in use for the requested equipment. As this is a very macroscopic approach, it is subject to uncertainty and could be fine-tuned to adapt to a given context, to a given tool. For the Carbon projection, we assumed a 50% projection via a Wi-Fi network and 50% via a mobile network.

To assess the impacts of the mobile in the carbon projection calculations, we measure on a real device, the energy consumption of the user scenario and in order to integrate the material impact share, we rely on the wear rate theory generated by the user scenario on the battery, the first wearing part of a smartphone. 500 full charge and discharge cycles, therefore, cause a change of smartphone in our model. This methodology and method of calculation have been validated by the consulting firm specializing in eco-design, Evea.

In a process of continuous improvement, we are vigilant in constantly improving the consistency of our measurements as well as our methodology for projecting CO2 impact data. Therefore, it is unfortunately not possible to compare a study published a year earlier with a recent study.

1 hour of Netflix viewing is equivalent to 100 gEqCO2. So what?

Reading Time: 7 minutes

Netflix, along with others like the BBC, has researched, with support from the University of Bristol, the impact of its service. The precise figures and the methodology will be published soon, but it appears that one hour of viewing Netflix is equivalent to 100 gEqCO2.

When the communication was released, several digital players took up this figure, but, in my opinion, not for good reasons. Communicating the impact of video through The Shift Project emerges as a systematic point of debate. As of March 2020, the Shift post had been widely disseminated in the media with a significant evaluation error. This error had been corrected in June 2020 but the damage was already done.

In this context, the IEA carried out a contradictory analysis on the subject. In the end, many studies on the impact of the video came out (IEA, the German Ministry of the Environment, ourselves with our study on the impact of playing a Canal + video). It is always difficult but not impossible to compare the figures (for example, whether or not the manufacturing stage is taken into account, the representativeness of the terminals, the different infrastructures, and optimizations between players, etc.), however, if we take things comparable, all studies have similar orders of magnitude. By taking the correction for the Shift Project error (Ratio 8 resulting from an error between Byte and Bit), the numbers are also close.

What do the studies say?

But beyond the discussions on the numbers, if we examine the studies in detail, the conclusions point in the same direction:

  • Regardless of the unit cost, there is a significant growth in usage and overall impact.


Set against all this is the fact that consumption of streaming media is growing rapidly. Netflix subscriptions grew 20% last year to 167m, while electricity consumption rose 84%.

  • The impact of digital services is relatively small compared to the impact of other activities. However, it is necessary to continue to study and monitor this impact.

What is indisputable is the need to keep a close eye on the explosive growth of Netflix and other digital technologies and services to ensure society is receiving maximum benefits, while minimising the negative consequences – including on electricity use and carbon emissions.”

  • The aim of the concerned companies is to better measure their impact and identify the real areas for optimization.

“Netflix isn’t the only company using DIMPACT right now, either. The BBC, ITV, and Sky are also involved. A spokesperson from ITV says that, like Netflix, the tool will help it to find and target hot spots and reduce emissions. Making such decisions based on accurate data is crucial if digital media companies are to get a grip on their carbon footprints.”

“This work allows us first of all to identify the technical projects to prioritize to minimize the carbon footprint of myCANAL video consumption as much as possible. At the same time, the lessons guide us on the awareness messages to relay to our users, throughout our future developments. This commitment to cooperation between our technical developments and our users is the key to consumption that has less impact on the environment. “ (Testimony of the CDO of Canal +, Greenspector study of the impact of playing a video)

  • The impact of the video can be small but it is necessary to measure it well (previous point)...

The most recent findings now show us that it is possible to stream data without negatively impacting the climate if you do it right and choose the right method for data transmission”.

Are the discussions going in the right direction?

The errors of some studies did not help calm the discussions. Neither does the media coverage of these figures. However, we should not be fooled, saying that digital technology has an impact is not necessarily well accepted by all players. This can be a nuisance for a field that for 30 years has been accustomed to a development paradigm without very little constraint and above all very little interest in internal environmental issues. Let us remember that Moore’s Law, which governs this digital world a great deal, is a self-fulfilling prophecy and not a scientific law: the industry is putting in place financial and technical means so that the power of processors increases regularly. We must not be fooled because focusing on certain errors allows the problems to be ignored. I have seen only quotes from the Shift Project error in Netflix’s DIMPACT ad but no quotes about Netflix’s desire to measure and reduce its impact. We must accept the mistakes of the past if we are to move forward on this subject. The study of the Shift has the merit of bringing to the fore an issue that was difficult to be seen. And also accept these own mistakes, how many digital promises have not been (yet) proven? Have the positive digital externalities been scientifically quantified by a sufficient number of studies? This latest analysis shows that the few existing studies (Mainly 2 Carbon Trust studies and the GSMA) deserve much more work to confirm the huge announced benefits of digital technology.

The study of claims of positive impacts of digital on the climate leads to the conclusion that these cannot be used to inform policy decisions or research. They are based on extremely patchy data and assumptions that are too optimistic to extrapolate global estimates. In addition, the two reports studied do not see the avoidances in the same sectors, or even contradict each other.

It is even a shame to focus on one aspect of the impact by dismissing the overall issue. This is the case in the discussion of the impact of the network on the energy part. The calculation method based on the kWh / Gb metric, even if shared by almost all of the studies and internal teams of operators, is criticized by some. This method can in fact be improved, but the church must be put back in the middle of the village: the impact of the network is in all cases weaker than the Terminal part, the material manufacturing part is never discussed in these debates while this is the main issue of the impact of digital technology. Especially since the energy improvement of the network and data centers is based on a principle contrary to the impact of the hardware: the regular renewal of the hardware to put in place new, more efficient technologies.

Google has been criticized for the waste policy of its servers. Practices have been improved but one can wonder about this management: even if the servers are resold and the environmental cost is amortized for the buyer, this does not change anything in the excessive renewal cycle.

“We’re also working to design out waste, embedding circular economy principles into our server management by reusing materials multiple times. In 2018, 19% of components used for machine upgrades were refurbished inventory. When we can’t find a new use for our equipment, we completely erase any components that stored data and then resell them. In 2018, we resold nearly 3.5 million units into the secondary market for reuse by other organizations.” (Google Environmental Report 2019).

One of the first explanations for these clear-cut discussions often comes from the lack of awareness of digital environmental issues. But behind that there is also a more sociological explanation: We reproach certain organizations for “ecological” beliefs. However, we can also speak of belief among certain digital players when we uncritically idolize the benefits of digital technology. In this case, not sure let these discussions go in the right direction. “Technophobic” versus “Techno-béa”, the reasoned find it difficult to take their place in the middle. Several avenues are however useful to progress serenely on the impact of digital!

Let us limit the comparisons between domains

Comparisons of the environmental impact of digital technology with other fields are a trap. It is necessary to understand an abstract CO2 impact. We use it ourselves to carry out this awareness. However, this leads to sometimes biased conclusions.

Here is the brief used by Les Echos! “Netflix claims that one hour of streaming on its platform generates less than 100gCO2e. This is the equivalent of using a 75W fan for 6 hours in Europe, or a 1,000W air conditioner running for 40 minutes.”

So an hour of streaming is low? Yes and no. Because it has to be seen from a “macro” level: worldwide viewing hours are exploding. And Netflix isn’t the only digital service we use. Is it possible to compare it to fan time? A household will be able to visualize 4 flows at the same time for several hours, we are not on the same importance of use with a fan (Maybe if with global warming …).

What is important is that this metric will allow service designers to track their improvement. With the details of this impact, they will be able to identify the hotspots. It will allow you to compare yourself to a competitor and to position yourself.

Using these numbers to say that the impact of digital is huge or zero doesn’t help much in the debate. All areas must reduce their impact, the challenges ahead are enormous and this type of comparison does not necessarily help in the dynamics of improvement. On the other hand, the more this type of study comes out, the more we will have a precise mapping of the impact of digital technology.

Let’s collaborate!

LCA models are criticized for their unreliability. Ok, is that a reason to abandon digital impact analysis? That would suit some well!

Above all, it is necessary to improve them. And this will come through more transparency: public LCAs from equipment manufacturers, energy consumption metrics reported by hosts, and even more information on the renewal of parks … Some players are playing the game, it is is what we were able to do for example with Canal + and this made it possible to have reliable data on the datacenter, CDN and terminal parts. However, the lack of transparency is significant in this sector when it comes to the area of environmental impact.

It is also necessary to avoid always blaming other sectors. In these discussions about the impact of video, and more broadly digital, I continually see “it’s not me, it’s him” arguments. For example, it is the hardware that must be acted upon, implying the software is not responsible for the impact. Once again, the environmental context is critical, there are no quick fixes and everyone must act. To free oneself from actions by pointing fingers at other actors is not serious. The idea of measuring the impact of digital is not to do “digital bashing” but to improve it. So there is no reason not to take these issues into account, unless ” go into a lobbying process and want to move towards total digital liberalization.

Having seen this field evolve over the past 10 years, I can say that there is a real awareness of certain players. The impact of digital can still be denied, but it is a dangerous risk. Dangerous because it is clear that the environmental objectives will be more and more restrictive, like it or not. Not taking this issue in hand is leaving it to other people. This is what we are seeing today: some are complaining about digital laws. But what have they done over the past 10 years when this issue was known? For fear that this will slow down the development of digital technology compared to other countries? Instead, why not see digital sobriety as a competitive factor in our industry? We can see that sobriety is taken into account by many countries (the DIMPACT project is an example). France has a lead with many players dealing with sobriety. It is time to act, to collaborate on these subjects, to criticize the methods to improve them, to measure themselves, for everyone to act in their area of ​​expertise.

This is what guides our R&D strategy, providing a precise tool for measuring energy consumption and the impact of terminals. We are working to improve the reliability of measurements in this area, to try to provide food for thought and metrics. Hoping that the debates will be non-Manichean and more constructive and that the digital sector fully takes environmental issues into account.

What resources should be reduced in the context of good software eco-design practices: Processing on the server-side or on the user side?

Reading Time: 2 minutes

One of the first answers to the question “what resources” is: all! But it is necessary to have a more specific answer because certain practices will favor an economy on the server-side, others on the memory side rather than the CPU. There are winning optimizations for all areas but unfortunately, the behavior of computer systems is more capricious!

The guiding principle is to extend the life of the hardware, whether for the terminal or for the servers. We will see that for environmental gains, reducing energy will also be an improvement axis.

In a previous article, we discussed the need for energy optimization in the case of mobile devices. Today we are trying to answer the question: what architecture to put in place, and in particular to put processing on the user side or on the server-side? 

The answer is: server-side processing to be preferred …

The answer is quite simple: let’s load the servers! Indeed, when we take LCA and impact analyzes, we observe a much stronger impact on the user side (Example with our study on the impact of playing a video). The servers are shared and are optimized to absorb a load. The manager can also manage load fluctuations with Power Capping (peak load absorption while maintaining controlled energy consumption). The lifespan of the servers can also be managed (hardware that can last up to 10 years). Compliance with a Green IT policy can also be better monitored and shared.

Terminals, on the other hand, despite having powerful processors, do not have these advantages. Very little control of the lifespan, no management of the health of the system, fragmentation of powers and therefore of behavior …

… but watch out for resources and scalability

While it is better to put the computations on the server-side, this is no excuse for not maximizing the impact on the server-side. Scalability is possible but must be monitored. Because adding a virtual instance will have an impact on the future need to add a physical machine and therefore will increase the environmental impact.

In addition, limiting power consumption will be necessary because a high demand for power will transfer into an increase in the power consumed on the server rack and higher cooling needs.

And the cost of the round trips of the network round trips in this case?

The question appears on network exchanges if we move calculations to the server-side. This is currently a false problem because there is too much exchange. The network resource and servers being seen as “free” and the architectures going more and more towards the service/microservice, the processing on the user side calls too much the data centers. It will be necessary rather control the number of network exchanges, whatever the choice of architecture.

Is this currently the case in architectural practices?

This has not been the trend in recent years. Indeed, the arrival of powerful user platforms, i.e. with multicore processors and high-performance network connections, have pushed a lot of processing to the user side. Development Frameworks, especially JavaScript Frameworks, made this possible.

However, the trend is starting to reverse. We can notably mention Server-Side Rendering (SSR) with for example next.js or the generation of static blogs with Hugo. We can also see techniques maximizing the use of elements already present on the user’s terminal such as the web browser engine by using CSS rather than JS.

We will try to answer in the next articles: which resources (CPU, memory …) should we optimize as a priority?

Users smartphones: all about the environmental impact and battery wear

Reading Time: 4 minutes

User terminals: the high environmental impact of the manufacturing phase

User terminals are now the biggest contributors to the environmental impact of digital technology and this phenomenon is set to increase. This trend is mainly explained by the increasingly important equipment of households with smartphones, by a reduced lifespan of this equipment, and by the fact that it has a significant environmental impact. An impact mainly due to the smartphone manufacturing phase. The Ericson brand announces, for instance, an impact in use (i.e. linked to recharging the smartphone battery with energy) of 7 kg eqCO2 out of a total impact of 57 kg eqCO2, or only 12% of the total impact. The total impact takes into account the different phases of the smartphone life cycle: manufacture, distribution, use, treatment of the smartphone at the end of its life.

Hence the interest that manufacturers work on this embodied energy by eco-designing but also by improving the possibility of increasing the life of the equipment through repairability but also durability.

Regarding all these observations, it could seem unproductive from an environmental point of view to reduce the energy consumption of smartphones. In any case, the simplistic approach would be to put that impact aside. But the reality is quite different and the electrical flows that are involved in the use of mobile devices are much more complex than one might think.

Explanation of battery operation

Current smartphones are powered by batteries with Lithium-ion technology. On average, the capacities of the batteries on the market are 3000 mAh. The trend is to increase this capacity. The battery can be thought of as consumable, just like a printer cartridge. It wears out over time and the original capacity you had when you bought the smartphone is no longer fully available. That is, the 100% indicated by the phone no longer corresponds to 3000 mAh but to a lower capacity. And this initial capacity cannot then be recovered.

Battery wear is primarily created by a full charge and discharge cycles. A recharge/discharge cycle corresponds to an empty battery that would be recharged to 100%. I leave home in the morning with a phone 100% charged, the battery drains, I charge my phone 100% in the evening. A complete cycle in one day therefore!

If you charge your phone more often, you can cycle more (several incomplete cycles are ultimately equivalent to one complete cycle).

The more the number of cycles increases, the more the remaining capacity decreases. This wear leads to the end of battery life. Current technologies allow up to 500 cycles.

At the end of the cycle, the battery capacity is only 70% of the initial capacity. Beyond this annoying loss of autonomy, the battery suffers from certain anomalies, such as a rapid drop from a battery level from 10% to 0%.

Note that this effect will be reinforced by the intensity of the battery discharge: if the phone consumes a lot (for example during video playback), then the battery wear will be greater.

Impact on obsolescence

The loss of autonomy is a cause of renewal by users: 39% in 2018. This phenomenon is reinforced by the fact that the batteries are increasingly non-removable, which leads to a complete replacement of the smartphone by the user. In addition, even if the decrease in autonomy is not the only replacement criterion, it will be added to the other causes to create a set of signs indicating to the user that he must change his smartphone (marketing effect, power, new features…).

We can therefore easily make the link between the mAh consumed by the applications and the kg of CO2 due to the production of CO2. By reducing these mAhs, we would greatly reduce the wear of the battery, the life of smartphones would be extended on average and therefore the initial CO2 cost would be more profitable. The smartphone mAh has a much greater cost on the embodied energy of the smartphone (manufacture) than on the impact of energy to recharge it.

For example, for a classic smartphone, we have 0.22 mgCo2 / mAh for the recharged energy compared to 14mgCo2 / mAh.

Technological solution

Solving this problem can always be seen through the technological axis: increase in capacities, fast loading … If we take the case of fast loading, this will not change the problem, on the contrary, it will worsen its potentially increasing cycles. It is not by increasing the fuel tank of cars that we will reduce the impact of the automobile. Improving battery technology is beneficial, however, reducing the consumption of smartphones would be even more beneficial for the environment and the user.

Note that the CO2 impact is not only to be taken, indeed the manufacture of batteries is overall very expensive in environmental and social terms. Not to mention strategic resources with geopolitical impacts such as cobalt or lithium. Extending battery life is critical.

Digital sobriety everywhere, digital sobriety nowhere? 7 mistakes to avoid!

Reading Time: 4 minutes

Everyone is talking about digital sobriety. From web agencies to politicians, including ESNs, all communicate on the subject, on the explanation of the impact, on good practices, on the willingness to go there. But what is it really?

We have been working on the subject within Greenspector for 10 years and we can in all modesty give our opinion on the real situation of the actors and especially on the barriers that will have to be overcome to really do eco-design and sobriety.

We have educated developers, students, and leaders. We have supported teams, applied good practices. We measured apps and websites. It took motivation to stay in the race. Because the context is different, and we are happy to see so much communication and actors involved. However, we believe that all is not won! Here are some tips and analyzes from veterans in the field, grouped into 7 mistakes to avoid!

Associate digital sobriety only with a department

In many actions that we have carried out, an important component was necessary: the consideration of the problem at all stages. Developer, Designer, Product Owner, decision-maker. And Customer… Without it, the project will not get far. An unfunded project, optimization research needs not wanted by the devs, technical improvements not accepted by the Product Owners … At best, the improvements will be made but with only a few little gains.

The solution is to engage in a shared approach. It takes a little longer (and more!) But allows the project to be understood by all and accepted.

Focus only on coding practices

The miracle solution when you think of digital sobriety is to tell yourself that if the developers respect good practices, everything will be fine. We can talk about it. We started an R&D project (Green Code) more than 8 years ago on this axis. It was necessary but not sufficient. Indeed, it is also necessary to work on the functionalities, the design, the contents, the infrastructure…

The establishment of a repository will be an important axis but more initially to initiate an awareness process. It is important not to say to yourself that it will be necessary to apply 115 best practices on almost all of a site because the effort will be enormous and the results will not necessarily be there.

Do not use professional tools

Many tools have emerged to evaluate websites. Indeed, it is quite simple on the web to monitor some technical metrics such as the size of the data exchanged on the network or the size of the DOM and to model an environmental impact. This is great for raising awareness and for identifying sites that are far too heavy. On the other hand, the system on which the software works is not so simple and the impact can come from many more elements: A JS script that consumes, an animation…

Taking action with this type of tool makes it possible to start the process but to say that the software is sober because we have reduced the data size and the size of the DOM is at the limit of greenwashing.

We are not saying this because we are publishers but because we are convinced that it is necessary to professionalize actions.

Fighting over definitions and principles

We have lived it! We have been criticized for our approach to energy. The birth of a domain leads to the establishment of new principles, new domains, new definitions … This is normal and often requires long discussions. But do we really have time to debate? Are they necessary when there is agreement that we all need to reduce the impact of our activities? The complexity of digital and obesity is there and can be felt at all levels. It is time to improve our practices overall, all wishes are good, all areas need to be explored.

Look for heavy consumers

The findings on the impact of digital technology are increasingly shared. However, teams may be led to look for excuses or responsible and not make corrections that seem more minor. Why optimize your solution when bitcoin is a consumption abyss? Why reduce the impact of the front when the publishers of libraries do nothing? Prioritization is important but it is often a bad excuse not to seek gains in your field.

ALL the solutions are way too heavy. So everyone is stuck on slowness. Everything is uniformly slow. We stick to that and all is well. Being efficient today means achieving a user experience that corresponds to this uniform slowness. We prune things that might be too visible. A page that has had more than 20 seconds to load is too slow. On the other hand, 3 seconds, … is good. 3 seconds? With the multicore of our phones / PCs and data centers all over the world, all connected by great communication technologies (4G, fiber …), it’s a bit weird, isn’t it? If you look at the debauchery of resources for the result, 3 seconds is huge. Especially since the bits circulate in our processors in nanosecond-level units of time. So yes, everything is evenly lent. And it suits everyone (at least, on the surface: The software world is destroying itself, manifesting for more sustainable development.)

Now let’s start optimizations by not looking for culprits!

Think only about technological evolution 

We are technicians, we are looking for technical solutions to solve our problems. And therefore in the digital field, we are looking for new practices, new frameworks. And the new frameworks are full of performance promises, we believe them! On the other hand, it is an arms race that costs us resources. This development is surely necessary in certain cases but it is not necessary to focus only on this. We must also invest in cross-cutting areas: accessibility, testing, sobriety, quality … And on the human because it is the teams who will find the solutions for sober digital services.

Do not invest 

Goodwill and awareness are necessary, on the other hand, we must finance change. Because digital sobriety is a change. Our organizations, our tools are not natively made for sobriety. Otherwise, we would not currently have this observation on the impact of digital. It is, therefore, necessary to invest a minimum to train people, to equip themselves, to provide time for the teams in the field. Just doing a webinar and training is not enough!

Let us have commitments related to the issue and the impacts of digital technology on the environment!

What are the best Android web browsers to use in 2021?

Reading Time: 8 minutes

The 2024 edition of this ranking is available! Read the study

The internet browser is the most important tool on a mobile device. It is the engine for browsing the internet. No longer just for websites but also now for new types of applications based on web technologies (progressive web app, games, etc.).

For this new edition of our ranking, carried out in 2018 and 2020, we have chosen to compare 16 mobile applications: Brave, DuckDuckGo, Chrome, Ecosia, Edge, Firefox, Firefox Focus, Firefox Nightly (formerly Firefox Preview), Kiwi, Mint, Opera, Opera Mini, Qwant, Samsung, Vivaldi et Yandex.

The objective of these measures is to see how the solutions stand in terms of environmental impact (Carbon) in relation to each other on common user scenarios but also to provide benchmarks on our uses of browsers.

For each of the 16 applications measured on a Galaxy S7 (Android 8) smartphone, the scenarios integrating the launch of the browser, browsing on 7 different websites, periods of inactivity, etc. were carried out through our Greenspector Test Runner, allowing the performance of automated tests.

Learn more about our methodology

Total energy consumption (in mAh)

The average power consumption is 49mAh (as a reminder, the 2020 ranking average was 47mAh or -4.2%).

Here is the evolution from last year.

2021 Ranking2020 RankingÉvolution
Firefox Focus1109
Vivaldi242
DuckDuckGo352
Firefox Nighly4106
Yandex53-2
Kiwi682
Opéra72-5
Brave87-1
Ecosia91-8
Chrome106-4
Samsung119-2
Firefox12131
Edge1311-2
Qwant1413-1
Opera Mini1514-1
Mint1612-4

Firefox Focus is the best solution in terms of energy consumption in our comparison. The version evaluated in 2020 was one of the first versions and it seems that Firefox teams have been working on optimizing the power consumption of their browser since. Ecosia loses its leading position on this indicator and finds itself in the middle of the ranking. On the side of the most energy-hungry browsers, we find Mint and Opera Mini. Note that the most popular browsers: Edge, Firefox, Chrome, and Samsung, are quite poorly classified.

This total energy consumption can be evaluated and analyzed in 2 ways: the energy consumption of pure navigation and the energy consumption related to the functionality of the browser.

Energy consumption of navigation (in mAh)

Navigation is the consumption only associated with viewing the page (no consideration of launching the browser, features, etc.).

Most browsers have a fairly similar power consumption on “pure” navigation. This is mainly due to the use of visualization engines. Most browsers use the Chromium view engine.

Compared to the 2020 ranking, it seems that the Firefox engine has improved. Qwant, using this engine too.

Energy consumption of features (in mAh)

The functionalities include browser states such as idle periods, launching the browser, writing URLs in the navigation bar.

By keeping the same classification as for the total energy, we see that the non-navigation functionalities (writing of URLs, inactivity of the browser, etc.) have a significant impact on total consumption.

Autonomy (hours)

Battery life is the number of hours the user can surf before the battery is completely discharged. The ranking does not change with respect to that of energy, as autonomy is directly related to energy.

We observe that the autonomy can double from 5h to 10h between the most consuming browser (Mint) and the least consuming (Firefox Focus).

Data (Volume of data exchanged) (MB)

Some applications do not manage the cache at all for reasons of data protection and privacy, use proxies that optimize data, have a difference in the implementation of cache management. In addition, if a browser is good, the downside is that a lot more data is potentially loaded in the background. In our methodology, we see it for the New York Times site, which is larger in terms of data.

Here is an example of the measurement iterations on the Amazon site (Amazon.com) that shows the difference in data processing between different browsers.

Memory consumption(RAM) by the browser process (MB)

Memory consumption is important to take into account in a digital service because even the variation in memory consumption does not influence the energy impact, it remains very important to integrate because of the effects of overconsumption on already congested devices. in memory, or older, less powerful, this can create instabilities or applications that cannot operate simultaneously because they compete. In ecological terms, this can of course provides a premature change of device on the user side for a more powerful model to satisfy good user comfort.

The variation goes from 400MB to 1.8GB (approximately half the RAM of the Samsung Galaxy S7).

Let us observe more precisely the behavior of the memory following the sequence:

  • Launch browser
  • Browser inactivity
  • Navigation (Average memory consumption)
  • Inactivity following navigation
  • System after closing browser

At the launch of browsers, we have a median memory usage of 413MB. Edge consumes a lot more with 834MB.

If we leave the browser inactive, the memory consumption of most browsers remains fairly stable. Which is pretty good and normal. On the other hand, we see that Edge and Ecosia have a strong increase in memory.

Then, with navigation, the memory consumed increases significantly. This is due to the consumption of navigation engines to analyze and store items. The management of tabs will also play a role. If the browser offloads the memory for the non-active tabs, then the consumption will be lower.

We can note that Firefox Focus, Mint, Duck Duck go, Opera Mini and Qwant overall consume little memory.

When the browser is closed, almost all browsers are no longer in memory. Firefox remains however with 1, GB as well as Chrome and Mint with around 100MB. Probably a bug but it is annoying because elements still occupy the memory and processing operations can also exist: processing operations are confirmed on Firefox and Mint with the rate of CPU consumed by the browser process which remains high.

We can also look at the memory impact of consulting Wikipedia (the basic consumption of the browser is subtracted here).

We understand the difference in memory management between browsers and the potential entropy on heavier sites.

Performance

We measured the time it took to write the URL in the address bar.

This difference in performance can be explained by several factors: network exchanges during entry (auto-completions), processing during entry, search based on known addresses, etc. In the end, for the user, the time to access the site will be longer or shorter. For example on the Wikipedia URL entry on Duck Duck Go a lot of network traffic and CPU processing (peak at 22% CPU).

Unlike the faster Edge which has lower processing in terms of CPU.

By the way, we could have an optimization of all the browsers by limiting its treatments (for example by grouping and spacing the treatments).

Environmental impact

The environmental impact is calculated according to the Greenspector emission factors taking into account the energy consumed and the wear of the battery (impact on manufacturing). The impact of the network and the data center is taken into account with the internet intensity.

This impact is reduced to the consultation of a page.

Firefox Focus by its low consumption is first. Samsung, which has average power consumption, is in second place thanks to good data management.

The most impactful browsers (Ecosia, Edge, Mint and Opera Mini) have high power consumption and poor data management..

Rated browsers

Measured versions : Brave (1.18.75), Chrome (87.0.4280.101), DuckDuckGo (5.72.1), Ecosia (4.1.3), Edge (45.12.4.5121), Firefox (84.1.2), Firefox Focus (8.11.2), Firefox Nightly 201228), Kiwi (Git201216Gen426127039), Opera (61.2.3076.56749), Opera Mini (52.2.2254.54723), Qwant (3.5.0), Vivaldi (3.5.2115.80), Yandex (20.11.3.88), Mint (3.7.2), Samsung (13.0.2.9).

Scenario

For each of its applications, measured on an S7 smartphone (Android 8), the user scenarios were carried out through our Greenspector Test Runner, allowing automated tests to be carried out.

Once the application is downloaded and installed, we run our measurements on the basic and original settings of the application. No changes are made (even if some options reduce the consumption of energy or resources: data saving mode, dark theme, etc.

However, we encourage you to check the settings of your favorite application to optimize the impact. Here is the evaluated scenario:

· Features evaluation
o Browser launching
o Adding a tab
o Writing a URL in the search bar
o Removing tabs and cleaning the cache

· Navigation
o Launch of 7 sites and wait for 30 seconds to be representative of a user journey

· Brower benchmark
o The Mozilla Kraken benchmark allows you to test JavaScript performance

· Evaluation of periods of inactivity of the browser
o On launch (this allows the home page of the browser to be evaluated)
o After navigation
o After closing the browser (to identify closing problems)

For each iteration, the following tests are carried out:
o Removal of cache and tabs (without measurement)
o First measure
o the Second measure to measure behavior with cache
o Removal of cache and tabs (with measurement)
o System shutdown of the browser (and not just a closure by the user to ensure that the browser is actually closed)

The measurement average therefore takes into account navigation with and without cache.

The main metrics analyzed are display performance, power consumption, data exchange. Other metrics such as CPU consumption, memory consumption, system data, etc. are measured but will not be displayed in this report. Contact Greenspector to find out more.

In order to improve the stability of the measurements, the protocol is fully automated. We use an abstract language of Greenspector test description which allows us strong automation of this protocol. Browser settings are the default. We have not changed any settings in the browser or its search engine.

Each measurement is the average of 5 homogeneous measurements (with a low standard deviation).

Impact assessment

To assess the impacts of infrastructures (datacenter, network) in the carbon projection calculations, we relied on our emission factor base (resulting from our R&D, such as the Impact study of the playing of a Canal + video – Greenspector) with as input the actual measured data of the volume of data exchanged. As this is a very macroscopic approach, it is subject to uncertainty and could be refined to adapt to a given context, to a given tool. For the Carbon projection, we assumed a 50% projection via a Wi-Fi network and 50% via a mobile network.

To assess the impacts of the mobile in the carbon projection calculations, we measure on a real device, the energy consumption of the user scenario and in order to integrate the material impact share, we rely on the wear rate theory generated by the user scenario on the battery, the first wearing part of a smartphone. 500 full charge and discharge cycles, therefore, cause a change of smartphone in our model. This methodology and method of calculation have been validated by the consulting firm specializing in eco-design, Evea.

In a process of continuous improvement, we are vigilant in constantly improving the consistency of our measurements as well as our methodology for projecting CO2 impact data. As a result, it is difficult to compare a study published a year earlier with a recent study.

The Impact of playing a Canal + video study

Reading Time: 16 minutes

Introduction

Logo_Canal+

This study was carried out by Greenspector, a company specializing in the impact of digital technology, and EVEA, specializing in analyzes of the environmental impact of products. This study is based on:

  • a calculation methodology initiated as part of the CONVINcE project on the energy consumption of video. A project involving several players such as Orange, Sony …
  • energy and resource consumption measurements carried out on the myCANAL application to support hypotheses
  • collection of data on the use and infrastructure of Canal +
  • a bibliographic study to identify and correlate emission factors and energy consumption

Study summary :
Methodology
Results : consumption, overall impact and projection
Areas for improvement
Conclusion – points to remember
Chief Digital Officer – Canal+ testimony

Methodology

The functional unit of this study is defined as follows: “Watch 1 hour of video, live or in a replay, on the Canal + interfaces”.

Disclaimer: The purpose of this study is to estimate, by orders of magnitude, the carbon impact of playing a video on Canal + interfaces. To date, it is based on reliable and robust sources and is intended to be representative of the reality of the Canal + infrastructure. However, this is not a complete Life Cycle Assessment (LCA). We rely on LCA methodologies but, for example, we have not performed a sensitivity analysis that would allow min-max deviations on the values. However, this study made it possible to formalize an analysis benchmark for the carbon footprint of a video service, and it could be used to monitor the evolution of the carbon footprint over time. And all this in no way detracts from the consistency of the data for its primary use.

Means of access to services

We have listed different ways to access myCANAL video services. Depending on this type of access, it is necessary to have more or less material (s). This inventory is needed to assess the impact of accessing video services. We have classified the means by category:

  • Canal + decoder
  • FAI TV Box
  • TNT Box
  • Game console
  • IP TV (Android TV, Samsung TV)
  • PC / Mac Multimedia Gateway with ISP Internet Box
  • Smartphone / Tablet with ISP Internet Box or GSM access

For Decoder, TV / TNT Box, Console, and Multimedia Gateway access, it is necessary to add a TV. We have ruled out all special cases of viewing considered as anecdotal compared to other accesses such as:

  • Display of the PC stream on a TV,
  • Multiroom viewing

Regarding the link between the terminals and the Boxes, we will consider that the Wi-Fi connection and the wired connection (Ethernet) have no impact on the consumption of the terminals (PC and TV).

Definition of visualization

Visualization quality influences end-to-end power consumption. We have taken the following 3 main definitions:

  • SD (Simple Definition)
  • HD (High Definition)
  • UHD / 4K (Ultra High Definition)

The definition depends on 3 factors:

  • compatible program availability
  • material compatibility in terms of quality
  • the quality of the connection (the quality of myCANAL videos is adapted according to the connection speed).

Greenspector’s exploratory measurements on myCanal show the impact of SD, HD, or UHD video consumption on smartphones, and then on laptops:

Impact of consuming SD, HD or UHD video on smartphones and laptops

Bibliographic sources were used for the consumption of other platforms such as Consoles (Source 1), TV (Sources 1 and 2), Set-Top-Box (Sources 1 and 2). The consumption of Canal + decoders supplied by Canal + was also used.

Depending on the different equipment configurations, we obtain energy consumption which varies from 1.3 to 108 Wh / h, i.e. a ratio of 1 to 80:

Consommations d'énergie selon les configurations d'équipements

Technologies

Several parameters were taken into account in the calculations because they influence the consumption:

  • Streaming technology: IPTV (Technology among ISPs), OTT (Over the Top), and Peer To Peer
  • Linear (Live) or Non-linear (Replay / VOD) signal
  • Broadcasting (Hertzian, Satellite, IP)

Means of connection to the network

To access the services, the infrastructure considered takes into account: the user’s equipment (Box among others), access to networks (GSM, Fiber, etc.), and the heart of the IP network.

We used calculation methods that are widespread in the scientific literature and standardized by ETSI. The principle is to take an “energy / typical use” ratio in Wh/Go. Although the network infrastructure has a fairly fixed consumption and does not depend on the use, this calculation method makes it possible to assign a global impact to a use (here one hour of video). In addition, it allows to study the improvement of networks in terms of efficiency. Beyond the search for improved energy efficiency, it also makes it possible to assess pressure on the network and to take into account the improvement in the capacity of the infrastructure.

As explained in the CONVINcE report:

“As we are looking for an order of magnitude in energy saving, we suppose that decreasing by 30% the traffic volume in the core network induces a decrease of same ratio in network dimensioning and consequently a decrease of 30% in energy consumption in the core IP network.”

We have studied the literature and listed metrics ranging from 1.3Wh / Go (figure for FTTH fiber) to 600Wh/Go. These factors fluctuate depending on the infrastructure assessment date, method (Top Down or Bottom Up) and technology. It is clear, however, that the efficiency improves over the years.

We have taken:

  • 13 Wh / Go for the core network (source CONVINcE)
  • 30 to 40 Wh / Go for the fixed network
  • 150 Wh / Go for the GSM network (source CONVINcE)

For TNT and satellite, there are few data. However, we based ourselves on a BBC study for TNT.

Content Delivery Network

Content Delivery Networks (CDNs) are servers used to limit the load on “Top of Head” servers (serving videos) and to provide a flow as close as possible to the user. Canal+ uses CDN providers on the market but also uses its own infrastructures.

The methodology for estimating the energy intensity per GB is to bring the estimated consumption of the data center down to throughput during peak periods. Canal+ indeed knows the number of physical servers, their types as well as their speeds. As the servers are hosted by a host, certain assumptions have been made to estimate the actual consumption: among other things, an assumption of PUE (Power Usage Effectiveness) of 2, consumption per server of 250W, and a server load of 50%. The consumption of routers and storage is considered negligible compared to the consumption of servers. (Sources 1, 2 , and 3)

The energy intensity obtained is 0.13 Wh / Go, with a different value between VOD and Live. Note that this value is calculated in the event of a peak (football match for example). It can be lower (use of the total capacity of the data center) or higher (during periods of low traffic).

For lack of data, the hypothesis of the same energy intensity (Wh / Go) was taken for CDNs outside Canal + (50%). For comparison and verification, the studies listed display values from 0.04 to 1 Wh / GB. These differences can be explained by various factors:

– Improving the efficiency of data centers, old studies, therefore, lead to higher figures,

– Top-Down approaches that have a higher estimate than Bottom-Up studies (like this estimate on CDNs).

AWS application servers Excluding video: using Mycanal (catalog presentation, authentication, etc.) and watching videos involve requesting services hosted on servers (rights management, etc.). The APIs used are hosted on AWS instances.

Canal+ rents AWS instances and knows the number of VMs. A part of these VMs is purely dedicated to providing ancillary services to video.

It is difficult to know the power consumption of AWS instances because no communication or information is provided by Amazon. According to an expert, we took a value of 20W (taking into account a PUE of 2) (Source: Interview of experts on virtualization from the company Easyvirt).

We have assumed a uniform distribution of consumption concerning the number of hours visualized and we obtain a value of 0.14 Wh / h.

Video encoding servers

The “Headend” servers allow you to format videos, “package” them to the user’s format … For the OTT, up to 150 packages may be available for a single video. Here is the workflow for the OTT.

The most consuming parts are video encoding and decoding. The workflow is distributed over specific servers (for encoding) and classic servers (for formatting and packaging).

We took the figures from the CONVINcE project (considering Harmony servers identical to those used by Canal +) to estimate the energy, as well as the Canal + server data:

  • For IPTV: 0.09 Wh for one hour of video
  • For the OTT: 0.30 Wh for one hour of video

This difference is explained by the fact that OTT is encoded in several formats, unlike IPTV which is encoded in a high definition format.

CO² emission factors

For energy, we used the values provided by the Open Data Networks Energies database (Work of distributors such as RTE and ADEME). We used intermittent usage which corresponds more to video usage in terms of the period (evening), ie 60g CO2eq / kWh. Part of the broadcasts for the rest of the world has been added taking into account the fact that some users are outside France.

For terminal and server manufacturing emission factors, we used factors provided by Shift Project / IEA.

These factors were brought to the time of viewing by taking into account the lifespans associated with each material.

Note: Regarding the impacts of DTT and satellite, there is a lack of data on infrastructure and emission factors. However, we have integrated this part to understand the orders of magnitude of the impacts. Certain analyzes were carried out only on the IP part in certain cases (for comparison with other studies for example).

Likewise, the impact of the data center manufacturing phase outside of the servers and the network infrastructure was not taken into account as it was considered to be shared and low given the lifespan of the buildings.

Results – global projection

The supply of renewable energy to AWS infrastructures and Canal + CDNs hosted by Interxion has not been taken into account.

In one hour, on average, here are the flows that pass through the network:

500 000 hours of video
900 TB of data
3.6 GB / hr average throughput

The number of viewing hours for Canal+ subscribers has been broken down according to the parameters listed above.

The unit data obtained previously are then projected on these uses to obtain the overall consumption. By taking these results, we can obtain the usage intensities of each part (Terminal, Network, Server) to check the consistency of the overall consumption.

Intensity analysis

The usage intensities obtained can be compared to the Shift Project and IEA studies. This intensity is calculated by taking the distribution of devices, the use of Canal +, and keeping only the IP transfer part (without Satellite or TNT).

It is clear (and shared by the IEA) that the Shift Project study overestimates grid consumption. For servers, we have a fairly low value but are quite confident considering that it is based on data from a known infrastructure (with the uncertainty from Amazon servers and third-party CDNs). The estimate of the terminal part of the Shift Project seems to us to have been underestimated (shared by IEA). It seems that the IEA also underestimated many parameters and seems not to have taken into account the influence of the definition on the consumption of the terminal, certain elements such as boxes, and the consumption of new TVs that consume more. The CONVINcE study and the Sauber/Koomey analysis also validate the consistency of our study.

Impact of playing an hour of video

Across the Canal+ fleet, the average end-to-end consumption is 214 Wh per hour of video. For comparison, the IEA study announces consumption between 120 and 240Wh per hour. The breakdown is as follows:

The impact in average CO2 equivalent by type of access is as follows (with the assumptions specified in the paragraph CO2 emission factors where the manufacture of Satellite, DTT, network and server hosting infrastructures has not been taken. into account)

By taking the type of connection:

The impact ranges from 20 to 66 g CO2 eq, it depends on several parameters:

  • the more or less energy consumption of the device (for example Smartphone vs TV),
  • embodied energy and material life,
  • the means of access to the network (for example GSM access has a greater impact than wired access),
  • the viewing quality which will influence above all the share of the network (depending on a cost per Wh / Go),
  • the number of materials to access the service.

By taking real uses (see the end of the document), the average is 28g CO2eq. If we take only the IP part, the average value is 37g CO2eq.

For comparison, the IEA study (2020) announces 8g CO2eq for France (for the use phase only). Another study for the US (2014) announces 360g CO2eq on the use phase (and 420g CO2eq with manufacturing). If we take a US energy mix, we get 202g which brings us closer to this study. The lower value can be explained by the differences in assumptions, in particular on the energy intensity of the network. For example, if we take for our study a TV with 4K reception, IEA announces 20g CO2eq while we rather estimate 14g (37g with the manufacturing phase).

If we look at the usage / manufacture ratio, in some cases the use has more impact (UHD in particular), while in others it is the manufacturing (IP TV or PC in HD for example).

In this same study, the estimate of the purchase of a DVD is 400g EqCO2, which therefore leads to the impact of watching a 2-hour video. 5 times less than that of buying a DVD in France and equivalent in the US.

Consumption and overall impact

The result of the total energy consumption of viewing Canal+ videos over IP is 900 GWh per year with a greenhouse gas impact of 159,000 tonnes CO2eq.

For comparison, annual French consumption is 473 TWh per year (Source RTE) and France’s 2017 carbon footprint (national emissions + imports) is 749 Mt CO2 eq (source: Haut Conseil pour le Climat – 2019 report). The consumption of the Canal + fleet by IP is therefore 0.18% of energy consumption and 0.016% of the French carbon footprint.

The end-to-end distribution is as follows:

Most of the consumption is on the user’s premises (terminal and part of the network access). Indeed, it is necessary to have the equipment (TV, Box, Smartphone …) which is not shared like the servers.

To validate the consistency of this projection, we took the consumption of CDNs specific to CANAL as well as to suppliers. We have a consumption of Canal + CDNs of 2.6 GWh (and estimated at 7 GWh for suppliers) excluding video head-ends which are not at Interxion. We get 12 GWh with the projection, which validates the model.

If we look at the distribution of the impact in greenhouse gases, we have the following distribution:

répartition de l’impact en gaz à effet de serre

A large part of the impact comes from the manufacture of user terminals. On the network part, the manufacture of Boxes (FAI, Satellite …) also has a significant impact.

Areas for improvement to limit the impact of services

General strategy

As we have seen in the network part, efficiency improves. The same is true for terminals. But on the other hand, 4K will become widespread, networks will continue to increase their capacity and therefore increase the overall impact of consumption. By taking one of the hypotheses of a 30% improvement in network efficiency (according to the trends set out in the studies listed in the Networks section of this report) and an increase in average throughput of 20% over 3 years as well as of 20% of the hours viewed, as well as a transfer of 75% of the hours viewed from all interfaces to that of the OTT, we estimate an increase in the energy consumed by 39% and the impact of greenhouse gases greenhouse by 23%. This simplistic projection allows us to approach a more realistic consumption in 3 years.

To offset this increase, and optimize the impact of video playback, we examined the impact of the following projects carried out by Canal+:

  1. Switching from H264 encoding to HEVC
  2. Switching to multicast for live
  3. Switch audio encoding from AAC to AC4
  4. Strengthen bitrate downsizing
  5. Improve the interface and the software layer
  6. Help the user on their digital impact

These projects are not exhaustive. Other possible areas for improvement have been identified which could be launched subsequently by Canal+.

The measurements, estimates, and models that allowed us to obtain the overall impact were used to quantify the estimated gains.

Note on optimizing video servers:

The energy consumption of video servers is very low, as is their impact, as the hardware has a high lifespan (10 years). Several optimizations are under study (video passage Just-in-Time among others). However, these optimizations provide very little end-to-end gain. They are however necessary to optimize management and reduce storage size (impact not taken into account in this study because it is low). Optimizations such as switching to HEVC have a stronger impact (this is confirmed by the CONVINcE study).

“The “Just In Time Transcoding” approach will allow to reduce the number of video representations stored in the CDN and thus its power consumption. This is an end-to-end approach to be compared to the global abovementioned one consisting of reducing the bandwidth of the network by using the most efficient encoding technology (HEVC/AVC).

On CDNs in the same way, even if the impact is low, certain actions such as increasing the rate of use of Canal + infrastructures (using a transfer of flows from supplier CDNs to own CDNs) will improve the efficiency.

Switching from H264 encoding to HEVC

The HEVC video codec is about 20% more efficient than the H264, and a large number of devices are now compatible. For a 3-year projection of consumption, we have taken an increase in the market share of HEVC compatible devices (Box, Smartphone, etc.).

For users who are on 1080p 5Mbits to date (34% of users currently) as for users restricted to 720p for technical reasons (for example a limitation of the network), a 20% drop in consumption is expected. For other 1080p compatible users, there is no decrease in consumption, but an increase in quality with superior grip.

A new even more efficient format begins to appear (AV1), saving an additional 20%. However, very rare equipment is compatible: the transition is largely premature, we would hardly gain anything to date because the fleet is almost zero.

Switching to multicast for live

Broadcasting in hybrid multicast / unicast adaptive streaming for the OTT will greatly reduce the use of bandwidth, and therefore power consumption.

Usable only for live stream, it ensures that a single stream is sent for all customers to the final delivery point. This project will be accompanied by other ancillary projects such as the switch to CMAF packaging. The CMAF audio/video packaging format allows you to have exactly the same video files for all platforms.

Switch audio encoding from AAC to AC4

Currently we mainly use AAC audio, from 96kbits to 128kbits.

The EAC3 + is widely compatible to date and improves audio quality at equivalent bitrate while allowing 5.1. Switching to EAC3+ would be at a fixed rate, without hoping to save bandwidth (while 20% more efficient than EAC3 +).

On the other hand, the new AC4 format is 50% more efficient than the EAC3 + and would allow the audio bit rate to be divided by 2. Even if the share of the video is greater, the gains at the global level are not negligible.

Strengthen bitrate downsizing

To date, except in Africa, or on a cellular network (so as not to empty the customer’s subscription), the quality of the video is adequate . On PC, quality adaptation is possible but access is not necessarily easy.

Making the possibility of reducing the size more accessible by different means (improvement of the interface, communication, etc.) would make it possible to redirect some of the users to a lower but sufficient quality.

Taking into account the increase in video quality and that of network performance, quality caping by users of Canal + services should represent in 3 years a gain of 20% in average speed compared to that generated by uncapped use.

In this axis, several elements have not been included in the gain projection but are possible to help the user in his impact. For example, the Greenspector mobile measurements show that it is better (under favorable conditions such as wifi) to use downloading rather than streaming. Indeed, here is the comparison for a 45mn video (with 5mn download):

Consommation d'énergie d'un streaming vidéo vs d'un téléchargement et lecture vidéo

This is partly explained by the fact that when viewing the downloaded video, the radio cell is not used while it is much more during streaming.

Improve the interface and the software layer

Part of the impact of viewing an hour of a video comes from the interface. Indeed, viewing the catalog, managing subscriptions (via APIs), processing playlists … are necessary functions. Greenspector measurements showed that this could represent 10% of terminal consumption:

Improving the interface on all platforms (smartphone, PC, etc.) would therefore make it possible to obtain significant gains. It would also allow, beyond reducing the impact, to limit the exclusion of certain people as well as the obsolescence of platforms.

Among the actions identified:

  • Switch to the dark mode
  • Reduce the overall impact of the software layer
  • Improve UX
  • Limit the integration of third-party libraries

Help the user on his digital impact

Much of the impact of video playback is not directly related to video playback. Canal +, through its large audience, can act by making users aware of the impact of digital technology. If some of the users take these actions into account, the impact can be reduced. Among these actions:

  • Extending the life of the user’s equipment,
  • Use Ethernet rather than Wifi, rather than 4G,
  • Extinction of equipment out of use.

Results

Here is the projection of the various energy gains:

The improvements compensate for the increase in energy consumption and even allow a gain of 14% compared to the current situation. For the greenhouse gas impact, we obtain a gain of 8%.

There are many ways to reduce the carbon impact of streaming activities for Canal + by 30%, and the actions put in place will make it possible to make a gain of 26% on the environmental footprint of services and in particular -31% for the consumption in OTT only.

Conclusion – to remember

This study has uncertainties on future use, on the emission factors of each element as well as on the potential gains. However, the objective is to challenge the choices or even to rule them out (some actions not listed in this document have, for example, already been discarded), if they had no gain. One of the first actions is to be able to measure yourself in order to improve. This is the goal of this phase. Now comes that of improvement.

The environmental interest of the sites identified by Canal+ has been confirmed. Their implementation will make it possible to offset the effects of the growth in uses, or even more, in the years to come.

The conclusions of this evaluation evolve with many technological parameters but in summary:

  • Work on video and audio compression formats while taking into account new formats optimized by manufacturers.
  • Optimize the consumption of user functions to access the content.
  • Involve/guide users in the choices according to the context of use (streaming, type of network, device screen format, etc.) and lead them to extend the life of the equipment to reduce the impact.
  • Implement hybrid multicast / unicast adaptive streaming for OTT to dramatically reduce bandwidth usage and power consumption.
  • Pursue end-to-end measures to avoid future decisions that shift the impact without reducing it

Pierre-Emmanuel Ferrand, Chief Digital Officer at CANAL+

Testimony

– How does this assessment and improvement process fit into the Group’s strategy?

CANAL+ is anchored in its time. We have decided to become more involved in a major issue of our time, dear to our subscribers and users of myCANAL: the protection of our environment. CANAL+ was very early on as a pioneer in eco-responsible approaches. first. In addition to the rental model of decoders, which is very virtuous from the point of view of the circular economy, Canal+ organized in 1988 the recovery of old decoders to ensure their return to service or their recycling. Moreover, as a publisher, We have produced eco-responsible productions including series that have been exemplary on this subject, Baron Noir, L’Effondrement, and more recently OVNI (S).

-What main lessons/contributions do we draw from this work (on the design of services)?

This work allows us first of all to identify the technical projects to prioritize to minimize the carbon footprint of myCANAL video consumption as much as possible. At the same time, the lessons guide us on the awareness messages to relay to our users, throughout our future developments. This commitment to cooperation between our technical developments and our users is the key to consumption that has less impact on the environment. 

– What role do users play?

Protecting the environment is a priority for them. Their role is central to our approach. Our challenge is to offer them a platform offering the best content and the best video quality adapted to their equipment and their reception capacities to reduce the effects on the environment. By raising their awareness and supporting them in responsible actions, they too will be able to get involved, as they do in other areas for a more eco-responsible society.

Digital sobriety comparison of 3 direct messaging apps for business.

Reading Time: 6 minutes

Introduction

Today and more than ever, communication is essential in business. Since the start of the Covid-19 crisis, many companies and employees have discovered remote work. This exceptional situation has led to a change in our interaction habits: making teams communicate effectively with each other, remotely, instantly. We decided to compare the 3 most popular direct messaging apps for business: Skype, Slack and Teams.

6 scenarios were carried out on the basis of an average user journey:

– Launch of the application
– Opening of a blank one-to-one conversation
– Sending a text message
– Send an image (.jpg)
– Sending an attachment (.pdf)
– Send an animated image or GIF (.gif)

Consult the methodology and the details of the scenarios.

Carbon impact projection

Carbon impact (graph) of apps: Skype, Slack and Teams

During the application launching stage, the carbon impact of Skype (0.038 gEqCO2) and Slack (0.039 gEqCO2) are pretty similar. Teams exchanges 77% more data compared to Skype, therefore increasing its carbon impact where in terms of energy, the Teams application has a consumption similar to the other two apps.

On the part of sending a text message and sending an image, Slack is the most efficient application oscillating between -30% (message) and -60% (image) less than Skype, less good application on these two scenarios.

Generally speaking, Teams consumes a lot more data. Indeed, on average it is nearly 196 KB where Skype is at 134 KB and Slack is at 113 KB.

The application with the best carbon impact average is Slack (0.035 gEqCO2) followed closely by Skype (0.043 gEqCO2) then Teams (0.055 gEqCO2), a difference of 36% between the best and the worst.

Focus on background consumption

On the background idle side of the application, we notice several things:

Slack consumption in IDLE Background

Slack consumption in the background is higher than the other two apps. Especially in terms of data exchanged where Skype and Teams do not exchange any data in this user step. Slack also consumes in terms of CPU (1.16%) where Skype consumes 10x less and Teams is once again at zero. This consumption is not linked to the background setting (state change processing) but lasts over time both on background inactivity states and in foreground inactivity.

AppsEnergy consumption par second (µAh/s)Exchanged Data (KB)CPU (%)
Skype45.1700.11
Slack57.1442.61.16
Teams44.0800

The Slack app performs processing in the background, impacting battery, power and resource consumption throughout the day. If we project this impact for a user who puts his Slack application in the background on his phone for a whole working day (7 hours), we obtain an impact of 26 gEqCO2, or approximately the Carbon impact of an average light vehicle driven in 230 meters! At the scale of the year (220 days): this behavior for a person is equivalent to 50 km of the same vehicle. Probably a mess that could be taken care of and avoided.

Average carbon impact projection of the scenarios

Carbon impact of direct messaging apps user journeys

The scenario with the lowest carbon impact on average of the 3 applications measured is that of opening a conversation (0.018 gEqCO2) consuming 69% less than sending an attachment (0.061 gEqCO2). The step of sending an image is the second least impactful step with + 10% more than opening a conversation. Finally, sending a text message and loading the app are similar in their impact (less than 1% difference).

Disclaimer : Note that these scenarios do not have the same duration.

Scenarios and their duration (in seconds)SkypeSlackTeams
Launch of the application4,524,135,88
Opening a conversation1,761,828,95
Sending a text message33,331,7832,19
Sending an image15,169,0714,46
Sending an attachment10,1312,1310,99

Below, the ranking of applications according to their carbon impact per second.

Carbon impact per second of direct messaging apps

Projected energy consumption of scenarios over 60 seconds

Energy consumption of direct messaging apps

When it comes to the launch of the application, Skype is in the lead with energy consumption of 31 mAh followed closely by Teams (32.8 mAh) then Slack (35.5 mAh). A difference of 12% between the first and the last application for this step.

For the opening a conversation step, Teams (11.3 mAh) is doing well with a lower consumption of 61% compared to Skype and Slack side by side (29 mAh).

For the 3 scenarios of sending a text message, image or attachment, the ranking does not change: Slack remains in the lead followed by Skype and Teams.

In the end, by adding all the steps, the Teams application is the most efficient (71.3 mAh) followed by Slack in second position (85.6 mAh) then Skype, the last one (86.2 mAh).

Remember that this classification is projected over one minute of use. In real time, Slack is the fastest application (11.7 seconds on average scenario completion time), Teams the slowest (14.49 seconds), however Teams is the most sober in terms of downloading speed on the smartphone (237, 7 on average compared to 285.6 for Slack or 287.2 for Skype).

On average, a minute of writing and sending a text message consumes 3.33 mAh, which is 2x less consumption than a minute spent in videoconferencing (audio only: 6.60 mAh).

Slack vs Teams: send a GIF

Slack

Teams

For the same functionality of finding and sending a GIF via Giphy third-party, the two applications Slack and Teams have a different user journey.

In fact, Slack allows, with a simple command, the search and display of a SINGLE GIF via the keywords typed then offers the possibility of loading a new one if the first one is not suitable. The command used is as follows:

/giphy simpson

Teams meanwhile, displays a search bar that displays new GIFs with each new letter typed. So unnecessarily. loading dozens and dozens of GIFs. After typing the entire keyword “simpson”, the results window will always display a number. For this scenario, we have chosen to select the first gif from the results.

We therefore observe a difference between the two applications:

ApplicationsDuration of the scenario
(in second)
Energy consumption
(mAh)
Exchanged data
(Mo)
Carbon impact projection
(gEqCO2)
Slack24,842,370,3090,065
Teams24,423,9232,336

We can see that the Slack user journey is much more energy and resource efficient than that of Teams. Especially for the part of the data exchanged (a difference of more than 22 MB!), Which can be explained by the quantity of GIFs unnecessarily loaded by Teams.

The difference in power consumption between these two apps is 40% for a similar scenario duration. The carbon impact is multiplied by 36 for the Teams application compared to Slack.

For each of its applications, measured on an S7 smartphone (Android 8), the user scenarios were carried out through our GREENSPECTOR Test Runner, allowing the performance of automated tests.

Details of the scenarios:

  • Launch the application
  • Opening a one-to-one conversation
  • Sending a 28 character text message “Hello this is a test message”
  • Sending an image (.jpg): 32 KB (350×350)
  • Sending an attachment (.pdf): 188Kb – generated from a Word text file (A4 format)
  • Sending an animated image or GIF (.gif): GIF used for Slack – 225Ko – 500×375; GIF used for Teams – 600Kb – 500×352

Each measurement is the average of 3 homogeneous measurements (with a low standard deviation). The consumption measured on the given smartphone according to a wifi type network can be different on a laptop PC with a wired network for example. For each of the iterations, the cache is first emptied.

To assess the impacts of infrastructure (datacenter, network) in the carbon projection calculations, we relied on the OneByte methodology based on real data measured on the volume of data exchanged. This assessment methodology takes into account the consumption of resources and energy in use for the requested equipment. As this is a very macroscopic approach, it is subject to uncertainty and could be fine-tuned to adapt to a context, to a given tool. For the Carbon projection, we assumed a 50% projection via a Wi-Fi network and 50% via a mobile network.

To assess the impacts of the mobile in the carbon projection calculations, we measure the energy consumption of the user scenario on a real device and in order to integrate the material impact share, we rely on the theoretical wear rate generated by the user scenario on the battery, the first wearing part of a smartphone. 500 full charge and discharge cycles therefore cause a change of smartphone in our model. This methodology and method of calculation have been validated by the consulting firm specializing in eco-design : Evea.

Greenspector, an actor of Planet Tech’Care

Reading Time: 2 minutes

What is Planet Tech’Care?

Planet Tech’Care is a platform that connects organizations and training actors who wish to mobilize to reduce the environmental footprint of digital technology with a network of partners, digital and environmental experts.

By adhering to this manifesto, signatories have free access to a support program made up of workshops designed by the initiative’s partners. The platform is run by the Digital Responsible for Syntec Numérique.

Why is Greenspector doubly committed to this national approach?

Greenspector, a member of Syntec Numérique and a company with a mission, is committed both as a signatory of the manifesto and is committed as a partner of this program to support the signatory organizations to take action, act for a sober digital and inclusive. Digital sobriety is a major factor in reducing our impact, but it is also a performance factor. The awareness of digital makers is key in the image that digital reflects today, this infinite world, without barriers and without limits in use. Many want to ignore this impact by looking more at the digital contributions to the reduction of environmental impacts but it must not become this industry which did not know how to react quickly enough as we reproach today to our models of movement, to our food. . Beyond awareness, the Planet Tech Care initiative is a way to mobilize the digital world to engage. The subject of the eco-design of digital services will be a way to reduce the consumption of energy and resources in the use phase but also to reduce the impact of equipment by using it better and by extending its lifespan. life.

A reminder of the key points of the manifesto:

1. Recognize that environmental change is a major issue for humanity on which digital players have an impact and must mobilize:

  • Commit publicly through the signing of the manifesto
  • Disseminate the initiative to their sphere of influence

2. Take action to contribute, at their level, to controlling environmental risks

  • Measure the environmental footprint (at minimum carbon) of their digital products and services
  • Identify and implement actions to reduce their environmental impacts
  • Identify and implement actions to extend the lifespan of digital products and services
  • Share this information and procedures with the stakeholders concerned

3. For those involved in education or offering training, set up training modules or courses to develop the skills of students and employees in responsible and environmentally efficient digital.