GREENSPECTOR is a tool detecting software’s behaviors which have an impact on resources consumption (energy, memory…). In order to do that, we use a set of techniques allowing the developer to be furthermore precise in its observations, thus leading to greater gains with fewer efforts. Code analysis and recognition of consuming patterns are part of these techniques.
Most of the time, code analysis is mainly focused on a syntactic recognition (as we can see in an IDE – Interface Development Environment – whenever we code and the IDE offers another type of writing). At first, we were using these basic code analysis techniques but results didn’t seem convincing to us. We were obtaining too many violations (a developer could have drown in that amount of violations!), and sometimes false-positives. But more than that, basic syntactic rules couldn’t detect extensive rules (the ones having an impact on resources consumption) like the Wakelocks recognition on Android. This is the reason why we chose to go with another analysis technique. Here are our feedbacks.
Language-written source code analysis came out in the fifties, and, very early on, people could see the stakes it represented. Indeed, LISP, one of the first languages (1956), is by definition self-referential and let programs analyze themselves. When personal computers got democratized, it took only a decade for IDEs to appear on the market, like Turbo Pascal by Borland, which offered more and more assistance services to programmer. In the meantime, Emacs was leading the way: code analysis (thanks to LISP), color code, etc…
Analyzing the source code while it’s in the writing phase is now an integral part of a development environment implemented for a project initiation: Jenkins, Eclipse keeps offering more and more efficient services. GREENSPECTOR is one of these assistants which help developers write an app that is more efficient in terms of power consumption.
Dig in code bowels
GREENSPECTOR offers, among other things, to analyze the source code. The goal is to find ways of writing which could be improved in terms of execution performance, memory consumption or network consumption. Because these three factors have a great impact on a smartphone’s consumption, this improvment process allows your client to enjoy using its smartphone all day long.
Hello world pattern recognition
Let’s illustrate with a super easy example!
You all can admit it is smarter to write this :
var arraySize = myarray.length;
for (var i = 0 ; i < arraySize ; i++) {
    aggr += myarray[i];
}
than this:
for (var i = 0 ; i < myarray.length ; i++) {
    aggr += myarray[i];
}
In the second example, we would use the length method for each test loop.
In a chart with a rather important size, using this method can become costly.
AST
Obvisously we cannot analyze the code’s raw text, but it is possible for a data representation adapted to manipulation by programming.
We call this representation AST, which stands for Abstract Syntax Tree.
The name speaks for itself, an AST is a tree… And we will see later on why it is important.
The AST of our first bit of code could look something like that:
VarDecla ("arraySize", MethodCall(VarRef "myarray","length",[]));;
For (VarDecla ("i", Lit "0"),
        BinOp ("<", VarRef "i", VarRef "arraySize"),
        UnOp ("++", VarRef "i"),
        Block[BinOp ("+=", VarRef "aggr", ArrayAccess (VarRef "myarray", VarRef "i"))]
);;
Getting this AST is not an easy task. In Java, we have access to JDT and PDT, respectively for Java and PHP. These libraries are proven, and, even if they are a bit tricky to apprehend and they might seem illogical from time to time, they remain efficient.
We, at GREENSPECTOR, chose to use Scala to build our code analysis tool. Scala, the power of functional with the advantages of JVM.
In order to perform analyses on the AST, we wrote our own grammar in Scala, which is a mapping of JDT or PDT grammars. This grammar, using Scala’s case classes, allows us to benefit from a pattern matching. that this language stole from OCaml, when it was initiated.
This is how a variable assignment is defined under Scala:
case class AssignmentJava ( id:Long, vRightHandSide : JavaExpression, vLeftHandSide : JavaExpression, vOperator : JavaAssignmentOp, lne : (Int,Int)) extends JavaExpressionWhereas a pattern-matching (sort of a switch-case on steroids) on this structure looks like that:
case AssignmentJava( uid, vRightHandSide, vLeftHandSide, vOperator, lne) => ...On the right, we can do whatever we want with uid variables, vRightHandSide, vLeftHandSide, vOperator, …
This way of doing is very effective to analyze a tree.
Spot the problems
Now we have a tree, we will need to detect problematical spots that we will report to the user.
Problem is, you never know what specific problem is going to be reported. As a consequence, writing this recognition in the Scala program, with the pattern-matching, is not really flexible as you have to keep changing the program. Plus, it is not the easiest to write.
As any good lazy person would have done, I searched for the easiest method.
Actually, I lied: if you’re lazy, Scala and the pattern-matching is not suited for you. Yet, who says simplicity, means request.
There you go, we need a query language! Like SQL or the regexp ones, something you just describe whatever you are looking for, and BOOM, there you have it, brought to you by the system!
Graph database
Fortunately, the always-more-abundant world of open source came to the rescue: Neo4j is a graph database server.
Even though it is more suited to analyze who your Facebook friends are or who you discuss with on Twitter, we can still use it for a very simple reason: a tree is a graph’s particular case!
But above all, Neo4j is equipped with THE perfect language for a lazy person: Cypher.
Cypher is Neo4j’s query language and was specifically made to find any information in a graph.
Hence the idea to integrate our AST in Neoj4 and to use Cypher to find what we look for.
Finding coding mistakes
Most of the time it is only 20% of the code that mobilizes 80% of the CPU!
An AST is just the tree representation of a text, the amount of semantic information remaining limited. We need to increase the code’s semantic density in order to analyze more precisely the code and detect interesting patterns that could be hard to see. To do that, we will turn our tree into a graph, by creating links between our AST elements. For instance, we can connect knots like “Functionality Declaration”, that way we can know what function calls what function. Obviously, every single one of these calls will be connected to the position where the function is called.
We call this the “Call Graph”, and let’s mention that this construction is easier to do in some languages than others. This way Java, thanks to its structure and its mandatory declarations, allow us to retrieve the call graph more easily than languages like… let’s say Javascript or PHP 😉
Difficulty lies in not picking the wrong call: how many different methods are going to be named ‘read’ for instance? Well, potentially a lot of them. You have to make sure you are connecting the two correct functions, and to do so, you need to determine the type of caller, in object-oriented languages.
Knowing the call graph, combined with other analyses, is a way of being aware of what part of the code runs the most often. Most of the time you can sense it, but you don’t always know fore sure, and often, less than 20% of the code mobilizes 80% of the CPU. By acknowledging the most-executed parts of the code, we can draw the developer’s attention on specific optimizations doable on critical portions of the code.
It works just the same to save memory, you have to use the variables you declare in a smarter way. By retrieving declarations and the links with their use you become capable of indicating how to optimize memory usage.
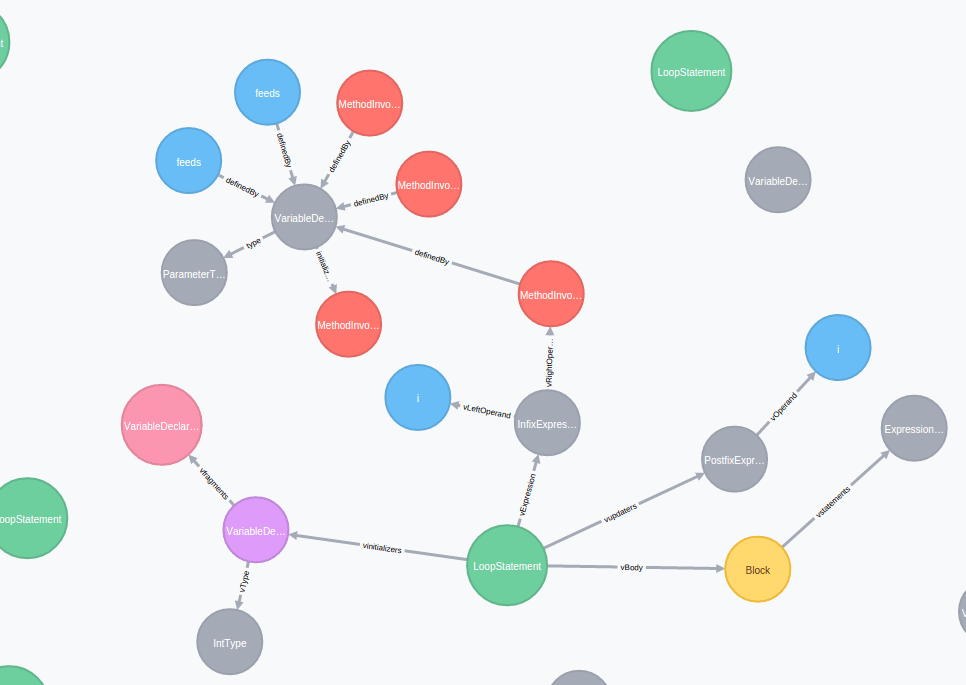
Let’s pick an easy example to illustrate what we just saw, the helloworld of pattern recognition. Often, in java, we observe loops simply iterating a chart, verifying the index is strictly inferior to the chart one. This example has room for improvement; indeed, using the .size() method is costly and could be “cached” in a variable.
for(int i=0; i < feeds.size(); i++) {
    feedIds[i] = feeds.get(i).getId();
}
Here is its graph representation:

The cypher language we were mentionning earlier allows us to detect this type of code:
“`match (n:LoopStatement) where n.loopType = “ForStatementJava” with n match (n)-[:vExpression]->(i:InfixExpression)-[vRightOperand]->(m:MethodInvocation) where m.methodName = “size” return n;
Basically, we ask it to find a classic “for” in Java with a call for size() method in the “for” updater.
Conclusion
Representation in editable graph form provides a better flexibility for the code analysis. It permits to analyze the code with a chosen level of complexity in the anlysis; it also constantly improves the quality of the code analysis. Thanks to the simplicity, power and intuitiveness of GREENSPECTOR, Cypher query language was adopted very quickly and the skill improvement heppenned fast! Now, our rules are way more coherent with way less false-positives. But it’s your turn to check it out and launch a code analysis with GREENSPECTOR! We, on the other hand, still have to explore all this architecture’s possibilities, which will allow us to realize analyzes of an even higher level (soon!).

