What impact does the network have on digital services?
According to the ADEME/Arcep study for 2022, the network in France is responsible for between 2% and 14% of the impact of digital technology. Fixed networks generate more impact than mobile networks (between 75% and 90%). However, given the greater use of fixed networks, the unit impact (per user or per GB of data exchanged, for example) is lower for the fixed network.
This observation has led to a number of recommendations encouraging the use of fixed networks rather than mobile networks. For example, here are ADEME’s recommendations for teleworking:
“8. Using WiFi rather than 4G on mobile phones
On your mobile phone, it’s best to use WiFi when you’re working at home. It puts less strain on the network than 4G. You can also use the wired network to connect your computer to your box.
This impact of the network is even reflected in the AGEC law. Communication operators are required to display the CO2 cost associated with user consumption.
Network evaluation for digital services
When it comes to assessing the impact of a digital service, the network must be taken into account. The commonly used approach is to use the intensity in gEqCo2/Gb. This assumes linearity between the CO2 impact and the data exchanged.
Note: Despite common usage, this approach is criticised. The reality of a network is that there is a constant consumption of energy, consumption which is not dependent on the data in transit. However, the intensity approach is applicable because there is a need to allocate this existing energy. In addition, the impact of manufacturing must also be allocated according to use. Other allocation methodologies by time of use would be preferable. However, this requires more precise data for each part of the network. Allocation by subscriber is also possible, but this metric is ill-suited to the granularity of a unitary digital service.
This impact-accounting methodology makes it possible to take into account the threshold effect caused by an increase in infrastructure and its use if the overall volume increases (new equipment, larger quantities of equipment and electricity to power it).
For certain parts, such as the user box, we have used a time allocation method rather than one based on intensity.
When assessing the digital service, it will also be necessary to have details of the different connections (Wifi, 4G, etc.).
With the AGEC Act, we have two interesting metrics:
- 50 gEqCO₂ / Go for mobile networks
- 18 gEqCO₂ / Go for fixed networks
However, the associated assumptions are not made explicit enough. The impact of the network will depend on many factors and assumptions:
- Scope taken into account (Scope 3 including network operator operations)
- Whether or not the equipment is manufactured
- Taking account of the user’s box
- …
If we look at other sources that can be used directly, there is no more information. For example, the ADEME database contains Negaoctet data and in particular two metrics on mobile and fixed telephony:
“Fixed-line network; at consumer; xDSL, FFTx average mix; . Data come from equipment installation and energy consumption in 2020 – (…) Sources: French operators, ARCEP, ICT report: European Commission, ICT Impact study, (…), IEA-4E, (…)”.
Even if sourced, there is no information to analyse the data. All the more so when you want to analyse the impact of digital accurately. This is the case with our methodology.
Analysis of market data
To make our assessments more accurate, we have carried out R&D work to obtain more reliable emission factors.
We have modelled the network in several thirds:
- The backbone, which interconnects the network
- The access network, closer to the user, with specific architectures for each type of connection (3G, fibre, etc.).
- CPE (Customer Permise Equipment): Mainly the box on the user’s premises
We have excluded the user terminal from the modelling. We’ll look at how to deal with it specifically at the end of the article.
For access types, we have grouped :
- Wired Fibre
- Wired Copper (xDSL)
- Old generation GSM (2G and 3G)
- New generation” GSP (4G and 5G)
- Public Wifi (hotspot)
- Wifi corporate LAN
- Company Ethernet LAN
It would be interesting to go further down the grouping (for example to separate 4G and 5G), but this grouping is adapted to the granularity of the data available.
We analysed 35 public sources (operators’ CSR reports, scientific papers, manufacturers’ data). Each data item identified in the documents was classified according to the 7 types of access, the third of the network, and the scope taken into account (Manufacturing/Usage in particular). 169 data items were identified. We selected 145 (some data did not seem relevant).
The quality of each data item was qualified according to our methodology. 39 parameters were thus qualified (Core network Usage, Core network Manufacturing, etc.) in a format compatible with our methodology (Trapezoidal determination usable in fuzzy logic). For example, for the impact of using the fibre access network, we have the following values: 0.1293 / 0.3181 / 0.7891 / 1.9415. This means that the impact of the fibre access network, according to the literature, is probably between 0.3 and 0.78 Wh/GB.
In the end, the model can be represented as follows:
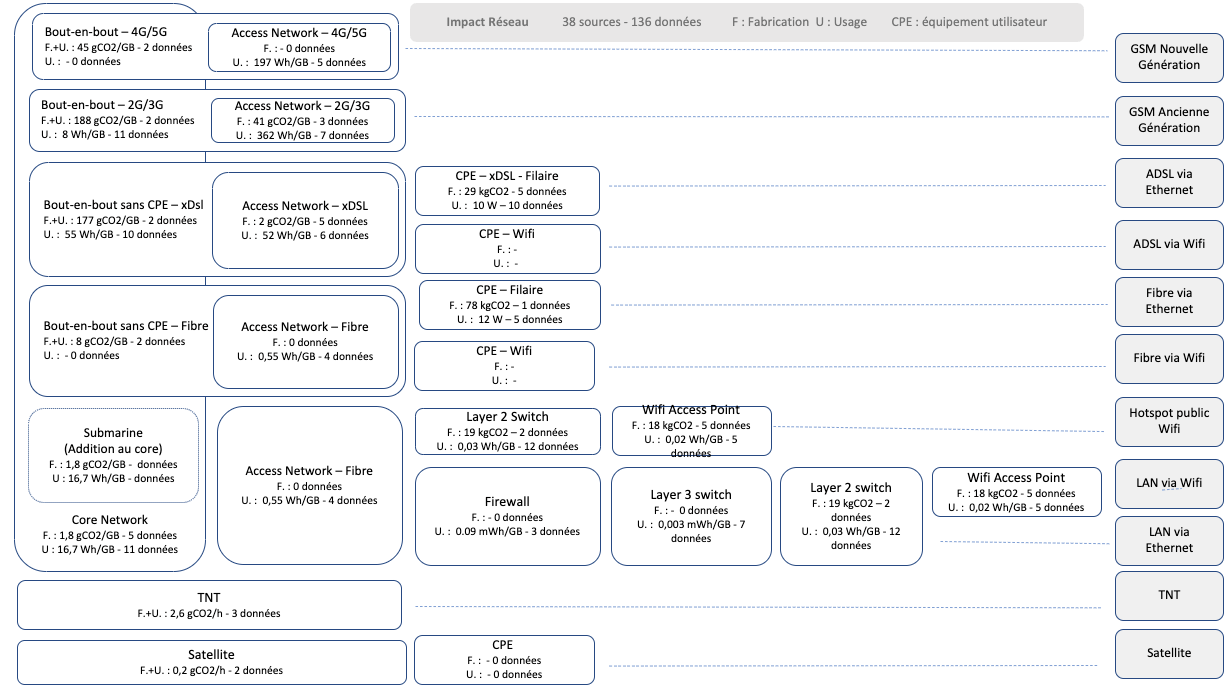
This model can be used dynamically by specifying certain parameters: EPC lifespan, energy mix, etc. Our API handles this automatically.
What is the likely impact of each network?
Taking the functional unit “Load a site of MB in 1s”, we obtain the following network impact:
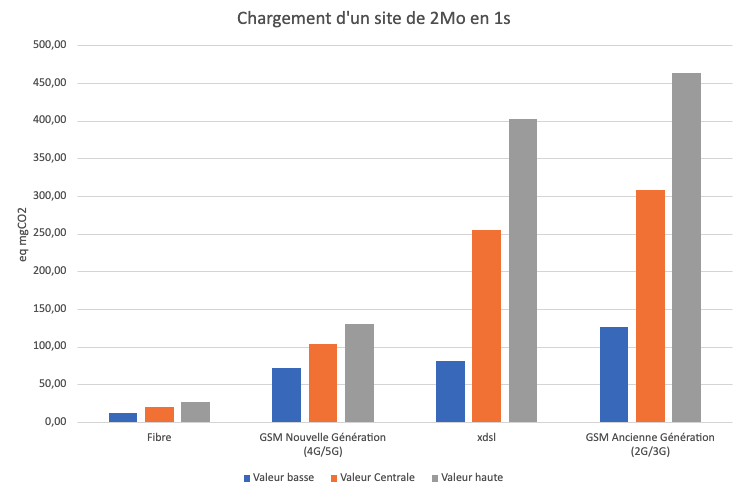
Fibre has much less impact than other types of access. The ranking of 4G/5G ahead of ADSL seems counter-intuitive, especially in view of the messages we regularly hear: Favour wired connection over 4G as mentioned above. This data is wrong for a number of reasons:
- The impact of base antennas and the access network of older GSM technologies is indeed more consumptive. The figures for older studies are based on these findings. It is important to adapt the recommendations according to the technologies and the age of the studies.
- Some studies talk about the impact of the network on the terminal. For example, the Eco-index documentation states that “(…) a 4G connection requires up to 23 times more energy to transport the same amount of data as an ADSL connection. (..)” However, the source used is a study on the impact of LTE connections on smartphones at cell level. We’ll come back to the reality of smartphones later.
Margins of uncertainty can be observed for XDSL and old generation GSM networks:

This is due, on the one hand, to the older study data (and therefore weighted by our algorithm) and, on the other hand, to a greater diversity of technologies.
The proportion of manufacturing varies according to the technology used:

There has been a marked improvement in the energy efficiency of new-generation networks, and this is a widely cited argument for promoting new architectures.
Critical analysis of network impact data
- Despite the model, which takes account of data sorting and qualification, the scope of all the data is not identified. We can find figures with the “raw” manufacturing impact and potentially others with the operator’s scope 3 (the impact of the operator’s offices, among other things). This will be taken into account in the model via the uncertainty margins.
- The Co2/GB network intensity model is used. It is not fully representative of reality. In order to improve representativeness, we need more sources for temporal allocation (network throughput, consumption per user, etc.). We have begun to use this allocation mode for certain metrics such as Box data.
- There are common elements between networks, and sometimes specific ones (for example, there are specific backbone elements for 5G). This needs to be taken into account.
- Even though we have a level of granularity that allows us to take account of the energy mix dynamically, some of the data incorporates the mixes of different countries. This potentially overestimates the value of some data.
We compared our metrics with other market data (for 1GB).
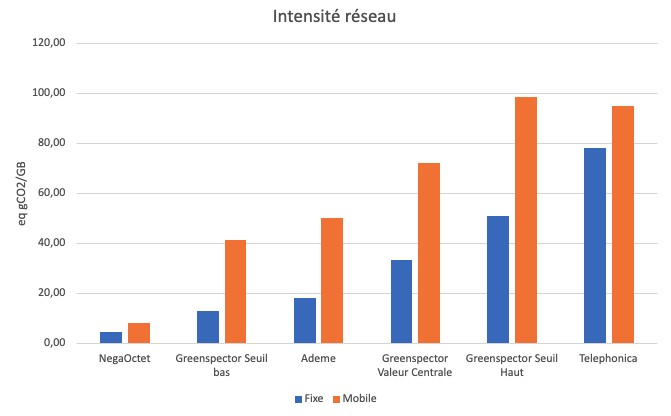
Greenspector values are higher than NegaOctet and Ademe values (ARCEP/ADEME values are however higher than the low Greenspector threshold). Telephonica data is higher (for fixed) than the high Greenspector threshold (and identical for mobile).
This difference can probably be explained by the fact that we have incorporated many network manufacturing values. A second explanation is perhaps an underestimation of the values for France, which has set its figures at a low threshold. Without getting into a debate, these figures on the impact of the network are often monitored, so the tendency may be to underestimate the figures rather than overestimate them!
Specific
Are connections other than a private box more sober?
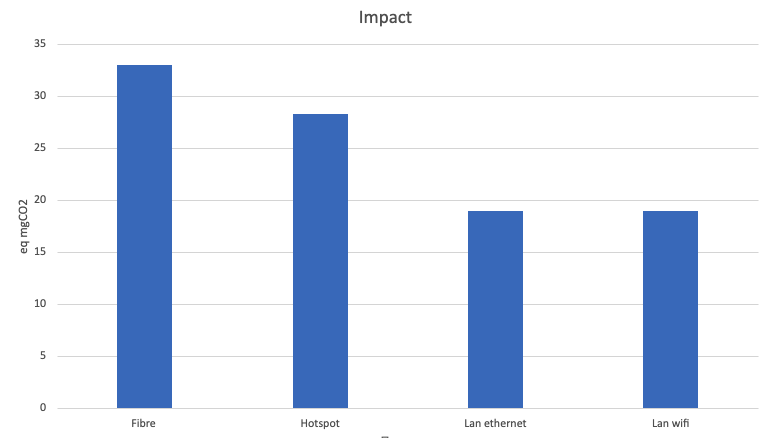
Yes, this is because this type of architecture is more shared. On the one hand, the hardware has a higher bandwidth capacity, so a lower allocation per item of data exchanged, and on the other, the impact of manufacturing is relatively low (in terms of capacity).
It should be noted that wifi has a slightly greater impact than ethernet. This is also true of boxes (for example, +3 Wh/h more on an Orange box).
Impact of the network on the terminal
We measure mobile applications and websites every day for our customers, so we deal with the impact of the network on the terminal and above all on the software. What we can say “from expert opinion”, but based on measurements, is that the impact of GSM networks is not 23 times greater, nor 10 times greater.
Here’s some measurement data on a streaming application (only the launch and connection to the application, not the streaming itself):

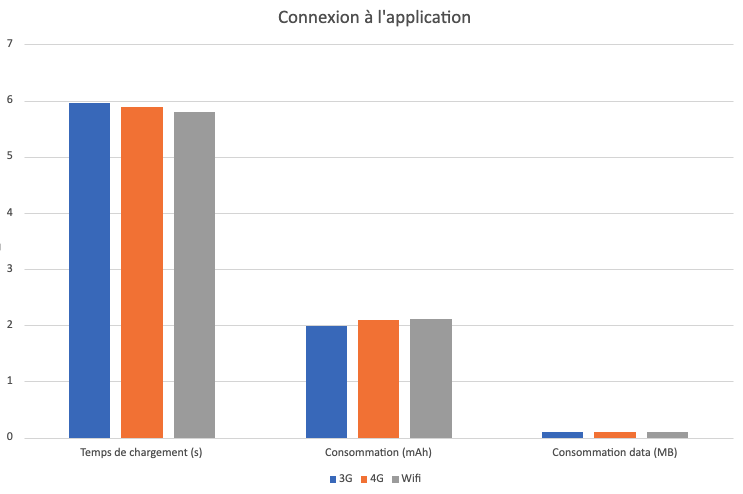
As can be seen for the connection (2nd graph), there is some data (~700 KB) and consumption is almost the same, or even slightly higher for the Wifi connection.
When it comes to loading the application (1st graph), WiFi consumes slightly less. However, there is a high level of data consumption (4MB vs 600kB). This can be explained by the different behaviour of the Wifi application (more data is loaded if the connection is Wifi). This has a major impact on loading times (from 4s to 7s for 3G).
The network will ultimately have an impact, but there are no set rules:
- If the application adapts its behaviour to the type of connection and the speed, then potentially more data will be loaded on connections with a higher throughput. And potentially more CPU to process this data.
- For 3G/2G connections, the loading time will be potentially longer (sometimes x2 or even x3).
- Depending on whether or not requests are grouped together, the impact of GSM networks will be greater or lesser.
It is necessary to measure the final application to understand its behaviour in relation to the network. Implementing estimation rules in models is therefore complex and will lead to false data.
Conclusion
Assessing the environmental impact of the network is complex. We need more data from operators and manufacturers. This data needs to be more detailed and more transparent. However, existing data can be used, provided it is properly qualified and used. Given these observations, the use of averaged data is not an ideal approach. This is why we have adopted an approach that includes calculating uncertainties. As soon as we can, we have to measure in order to have contextualised and more accurate data. This is the approach we apply. This provides important clarifications for LCIs (life cycle inventories), digital impact assessments, or more individually for software evaluation.

Digital Sobriety Expert
Books author «Green Patterns», «Green IT – Gérer la consommation d’énergie de vos systèmes informatiques», …
Speaker (VOXXED Luxembourg, EGG Berlin, ICT4S Stockholm, …)
Green Code Lab Founder, ecodesign software national association
